It has been nearly two months since my last #Weekllywonk, but its back. In May and June, I was preoccupied with the June primary, then end of the legislative session, and personal obligations. But I am back now and committed to weekly updates from now until the General Election in November. Each week I will dive into political subdivisions that are having elections this fall. However, for the next couple of weeks I will be focusing on some Board of Elections matters. This week I will focus on the 2022 Annual Report and the Board of Elections financial performance and struggles last year.
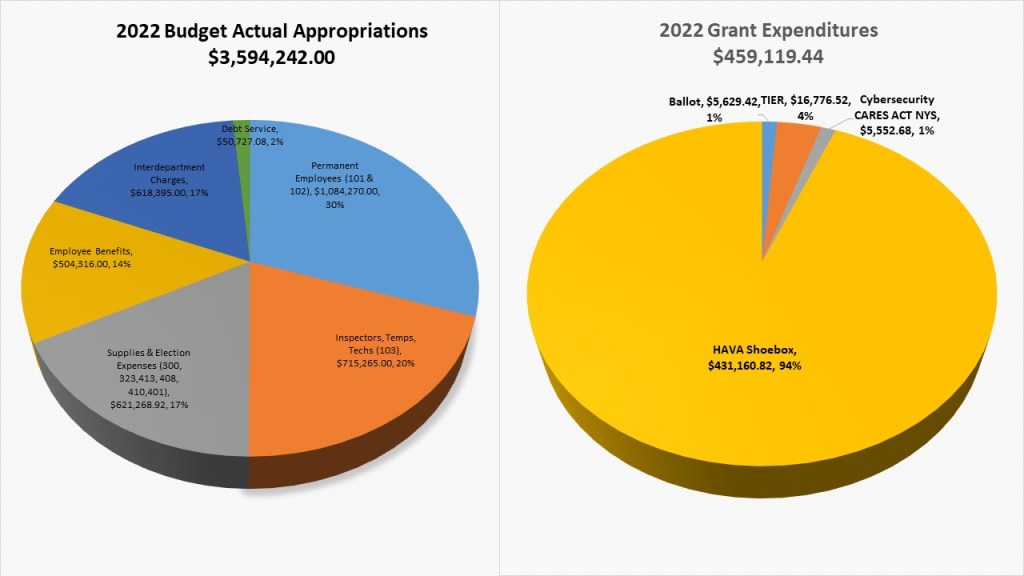
Boards of Elections are required by Election Law to do an annual report. At the Onondaga County Board of Elections, we make all our Annual Reports available online at onvote.net here: http://www.ongov.net/elections/annual-reports-and-minutes.html. We also distribute these reports to the County Executive, County Clerk, County Comptroller, and all County Legislatures. The report is intended to document all aspects of the Board of Elections operations. If you have followed my #wqeeklyWonk you are familiar with some of the statistics within as I have already talked about voter registration, turnout, and voter preference. In this #weeklyWonk I will highlight the financial statistics of the Board of Elections. In 2022 we spent $3,594,242.00 in local dollars and $459,114.44 in Grant spending. In the above graph you can see exactly how much we spent on each subcategory.
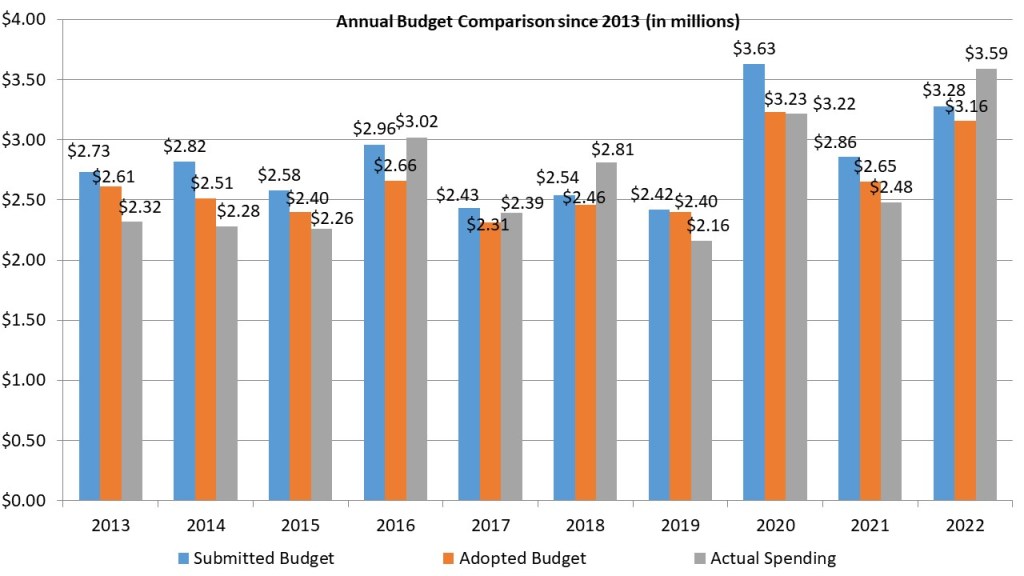
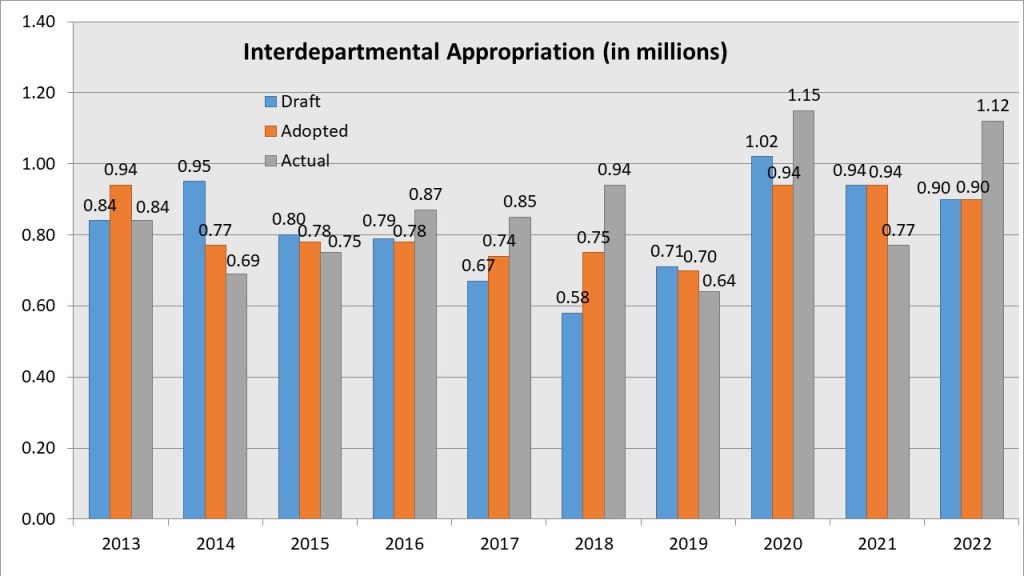
2022 was a financial struggle for the Onondaga County Board of Elections, and practically every Board of elections throughout New York State. When New York State by judicial order added the 2nd of August Primary for Congress and State Senate it was not anticipated in our already set budgets. In this slide we see our budgets going back to 2023, when I started as Commissioner. Each budget season both Commissioners agree on a budget that is submitted to the County’s Division of Budget and Management. The County Executive then proposes a budget, and the County Legislature makes changes. Often, they reduce our requested budget and many times the Board of Elections must exceed the budget to service the needs of the voters, which we are allowed to do in Election Law. The Board of Elections has only exceeded their submitted budget in 2016, 2018, and now in 2022. In 2022 we exceeded the budget because of the needs of the extra primary having spent approximately 3.59 million against the submitted 3.28 million and approved 3.16 million.
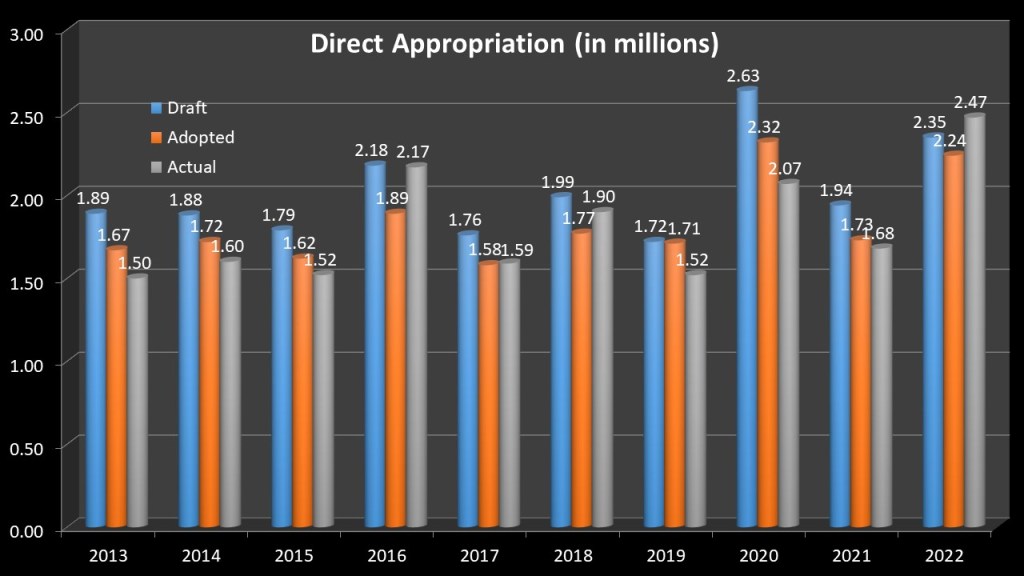
The budget is broken up into three different subsections, Direct Appropriations, Indirect Appropriations, and Revenue. The Direct Appropriations are made up of items that the Board of Elections controls directly such as salary, supplies, contracts, and all election inspectors. The BOE requested 2.35 million however the County Executive and legislature cut it to 2.35 million. We spent approximately 2.47 million, just 1.27 million over budget. Considering primaries cost approximately 300k dollars we performed admirably well. In fact, 2022 was the only year since my time in Commissioner where the direct appropriation came in over the requested amount by Elections Commissioners. Previously The Board of Elections did exceed the budgeted amounts in 2016, 2017, and 2018 however these were because of cuts by county government that did not consider increased turnout or primary costs.
Indirect appropriations are the portion of the budget that is least controlled by the Board of Elections. This budget category is made up of mainly permanent employee benefits and charges from other county departments. At the beginning of each year the office of Management and Budget assigns values to our budget. Estimates for benefits are based on permanent employees and interdepartmental charges are based on past performance in similar years. Unfortunately, 2022 was not a similar year to 2018. Though 2018 had higher activity the third primary and legal challenges in 2022 to absentees drove our interdepartmental charges way through the roof resulting in nearly 220k in charges over budget. Once again OCBOE has no control over these charges, and they are only assessed at the end of the budget year.

The third and smallest portion of our budget is Annual Revenue. The Board of Elections is not a profit-making department. Most of our revenue comes through programming and ballot charges when we help government entities hold their elections. This is mostly the May School district elections but also villages that hold elections in March and June. Since COVID our revenue base has been unstable as some villages have moved their elections to November and School districts went to all mail options in 2020 and 2021. In 2022 we started to reevaluate our reimbursement costs from School districts which resulted in us coming in 1.9k over budget. In 2022 we will be doing the same for villages as well.
It is important to look at the OCBOE budget performance not just against itself but the rest of the state. The State Board of Elections compiles budget, employee, and inspector stats in their annual budget. One of the stats they collect is the annual budget of all Boards of Elections throughout the state. The 57 counties and the NYC Board of are various size so you can’t do direct comparisons. The best comparison is to use the active voter registration numbers in each county and compare it against the chosen statistic. The next few stats I will compare how the OCBOE employee structure, overall budget, and inspector deployment compares to other Boards of Elections. These comparisons are compiled annually by me and posted at onvote.net here: http://www.ongov.net/elections/documents/NYSBudgetEmployeeComparisons.xlsx
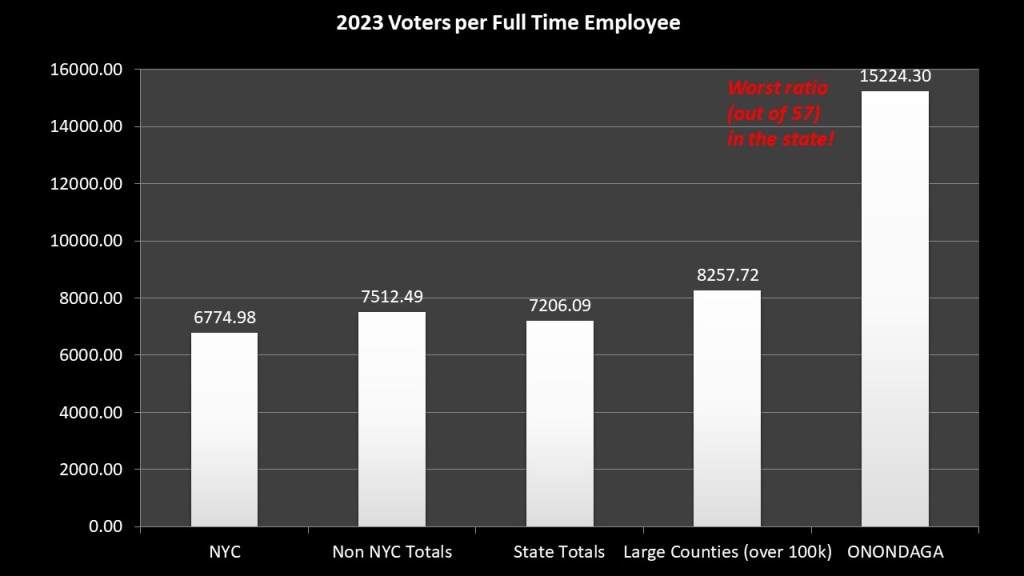
The first and most obvious comparison is the number of permanent employees compared to the rest of the state. The Onondaga County Board of Elections fields 20 full time employees (including Commissioners) and for the 2022 election had 304,486 registered voters. This means that OCBOE employs one full time employee for every 15,224.30 voters. This is the worst ratio in al of New York State. The other counties in New York State average 1 employee for every 7206.09 voters. When you take NYC out of the mix, the rest of upstate averages 1 for every 7512.48 voters. When you compared to large counties over 100k voters they average 1 for every 8257.72 voters. Despite adding 4 positions over the last two years, Onondaga County has not kept up with the rest of the state. In 2019 when electoral reforms added responsibilities to the local boards other counties responded by staffing up significantly. OCBOE was already the worst in the state and the county only added a few employees, so OCBOE has continued to fall behind other counties.
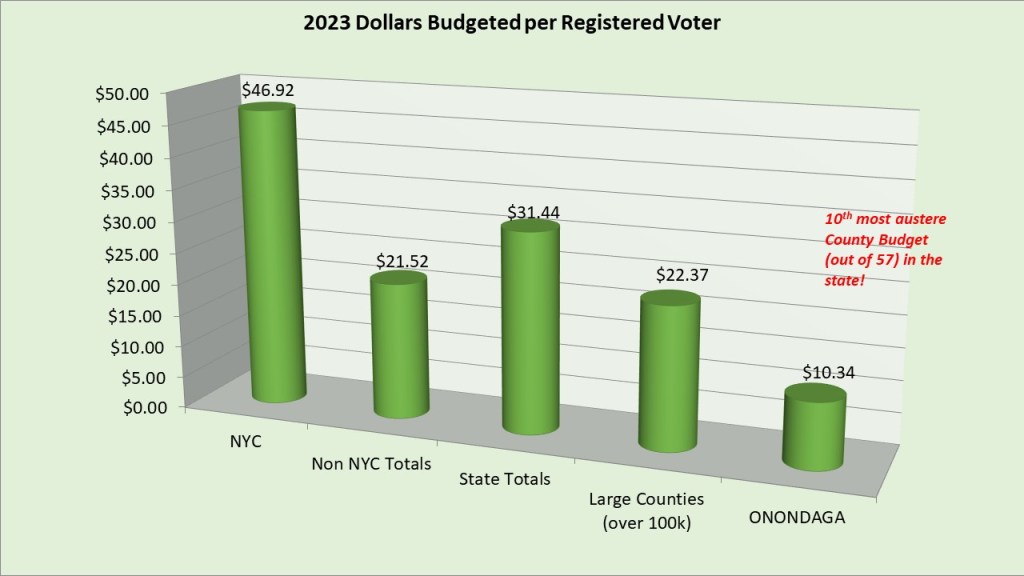
The lack of permanent employees is reflective of the overall budget that is annually approved by the County Legislature. In 2022 our budget was approved for $3,148,648.44. When divided by the active registered voters is $10.34 per voter. This is the second most austere budget in New York state, trailing only Cayuga County. New York State averages $31.44 per voter but that is skewed by NYC spending of $46.92 per voter. When we look at non-NYC counties, they spend $21.52 per voter and large counties over $100k spend $22.37 per voter. We make up for some of the lack of resources through the Grant spending outlined earlier and adopting of technological advances.

One of the places where technology has helped us grow more efficient is in the Inspector Deployment. The adoption of the Know ink Epoll Book and Printing on-demand allows us to have a streamline the voter check-ins on election day and early voting. Having more centralized polling places are also helping They no longer must staff individual election district tables and voters check in at one table and pick up ballots at the other. This has allowed us to deploy 1 inspector for every 253.95 voters. This is the 10th most efficient in the state. New York State averages 1 election inspector for every 157.12 voters. Once again NYC brings that average down by averaging 1 inspector ever 112.37 voters. Non-NYC counties average 1 for every 210.97 voters and large counties over 100k are 1 for every 219.53. With new machines and on-demand ballot printing being rolled out this year we are looking to be even more efficient in.

That is, it for this #WeeklyWonk. The next two weeks I will focus on recapping the June Primary first looking at Early and Absentee voting and finishing with Election Day and overall turnout. After that I will get back to analyzing the Towns, County Legislature seats, and villages that have competitive elections in November. Remember to subscribe to dustinczarny.com for all content and election news updates.
