Welcome back to the #WeeklyWonk. Each weekend I release an article on a subject relating to elections in Onondaga County and New York State. Often these articles will have detailed stats to consume but sometimes they will be a recap of a prominent issue or on relevant election law. I am turning my eye to the 2023 elections. This week I take a break from looking at the political subdivisions and focus on and look at Party Changes and New Voter Registration in Onondaga County for 2023.
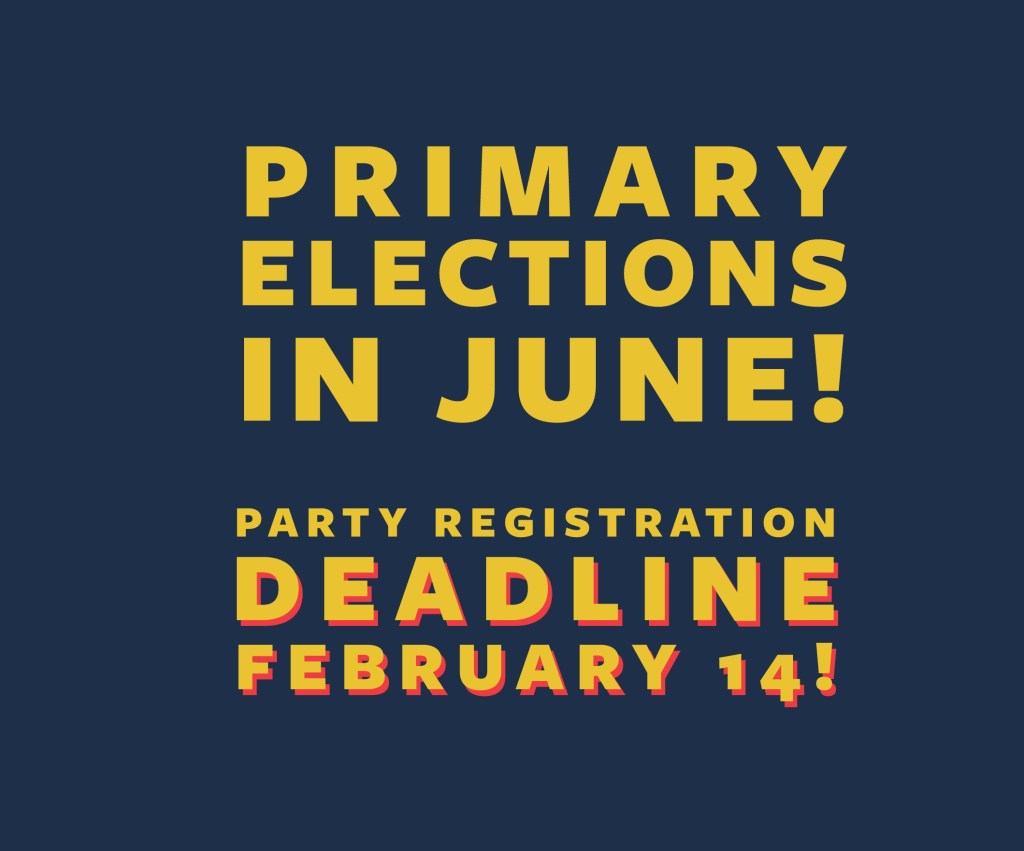
Each year New York has a freeze on party enrollment changes. For over 100 year that freeze started 25 days before the previous General Election and lasted until 7 days after the primary. The primary then was in September so that essentially meant an 11 month freeze in party changes. When the political calendar was changed in 2019 to move the primary to June that shortened the window by 3 months, however that was still one of the longest in the nation. In 2020 the Mew York State Legislature moved the party enrollment deadline to a single date each year, February 14th. Coincidentally that is Valentine’s Day, so I have named it Fall in Love with Your Party Day. These 4 months sequester now allows voters to switch their parties ahead of the June primary if they wish to vote in it. However, for those who don’t their party changes are held a virtual lock box until 7 days after the primary.
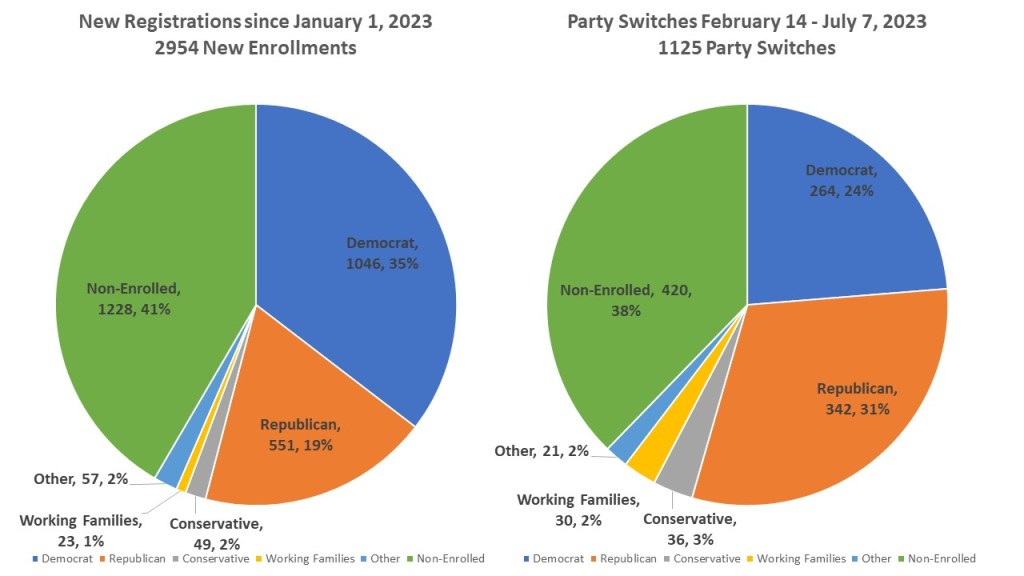
For the first time in my time as Commissioner we can now get date on newly enrolled voters and party changes thanks to our new registration system. The old system we had to compare before and after enrollment numbers that could not give out as accurate information as I would like. As of July 7th, we had 2954 New Enrollments in Onondaga County. Of those new enrollments 1228 (41%) chose not to enroll in any party, 1046 (35%) enrolled in the Democratic Party, 551 (19%) enrolled in the GOP, 57 (2%) enrolled in the other party category, 49 (2%) in the Conservative party and 23 (1%) in the Working Families Party. We had 1,125 Party switches between February 14th and July 7th, 2023. 420 (38%) chose not to enroll in a party, 342 (31%) enrolled as Republicans, 264 (24%) enrolled as Democrats, 36 (3%) enrolled as Conservatives, 30 (2%) enrolled as Working Families, and 21 (2%) in the other category. Clearly the Non-enrolled are continuing to gain ground in our county. Though the GOP had a small edge in party switches that is wiped out by the Democrats gain in newly enrolled voters.

While our system now allows us to track how newly enrolled voters in Onondaga County register, what it can’t tell us is if they are brand new enrolled voters or just new to Onondaga County. I decided to break down the newly enrolled by age groups. We can assume many of the younger voters 18-30 are new or first-time voters where the older groups are likely transfers from other parts of the country. No matter the age group the pattern is clear. Non-Enrolled voters is the biggest growing segment among newly registered voters in Onondaga County. Democrats are also gaining nearly 2 to 1 over the GOP in each category as well. The only exception is the 65+ group. Here Democrats outnumber both N/E and GOP, but the differences are smaller.
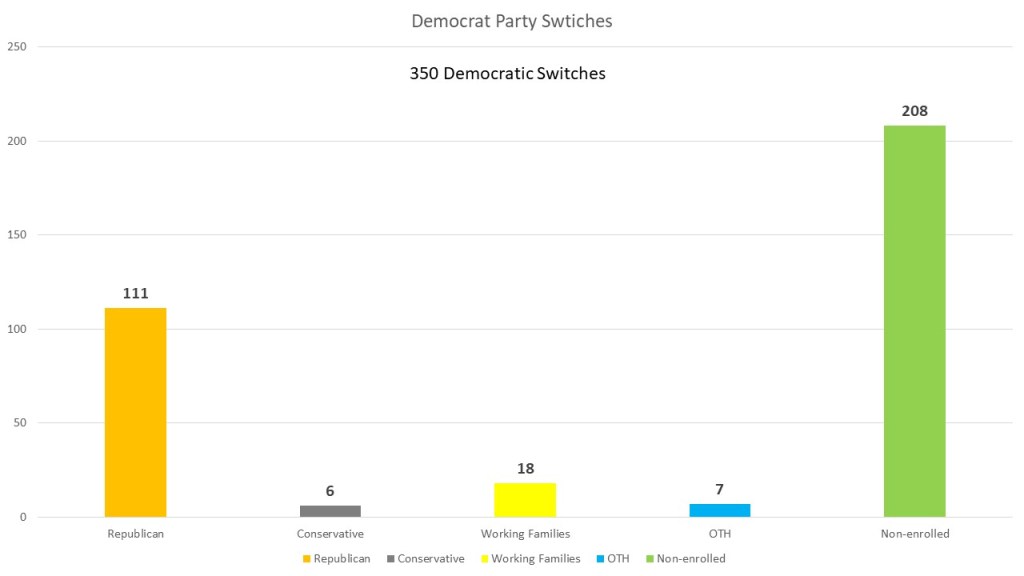
350 people chose to leave the Democratic Party. Of those that left 208 chose not to be enrolled in any party. 111 Switched to the Republican Party, 18 to the Working Family Party, 7 enrolled in the other party category, 6 enrolled in the Conservative Party. Once again, the non-enrolled dominates this category as more voters are choosing not to be part of a party.

209 people switched from the GOP. While less in number that the Democrats, there are significantly less GOP in the county. Once again, the largest number of former GOP, 131, decided to unenroll from any party. 58 decided to switch parties to the Democrats, 18 switched to conservative party, and 1 to Other, and 1 to Working Families. As a percentage 27% switched to the Democrats while 31% switched from Democrat to GOP.
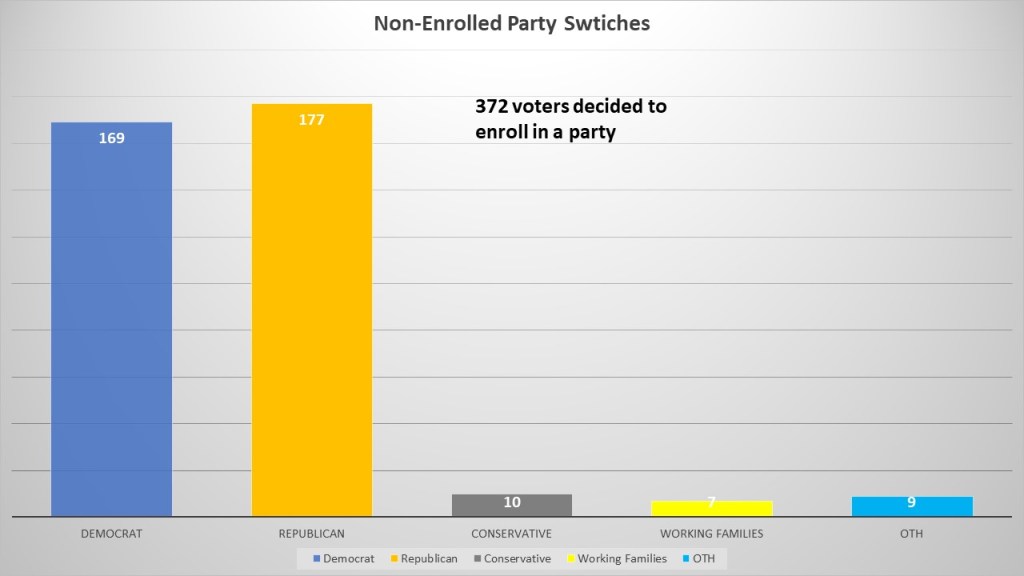
The largest party switch though was non-enrolled deciding to enroll in a party. New York is a closed primary state so often those not enrolled in a party will choose to enroll in a party to take part in the primaries. 177 decided to enroll in the GOP and 169 enrolled as Democrats. Only 28 decided to enroll in other parties (10 Conservative, 7 Working Families, and 9 Others). It seems during this party change period the non-enrolled broke evenly between the GOP and Democratic party.
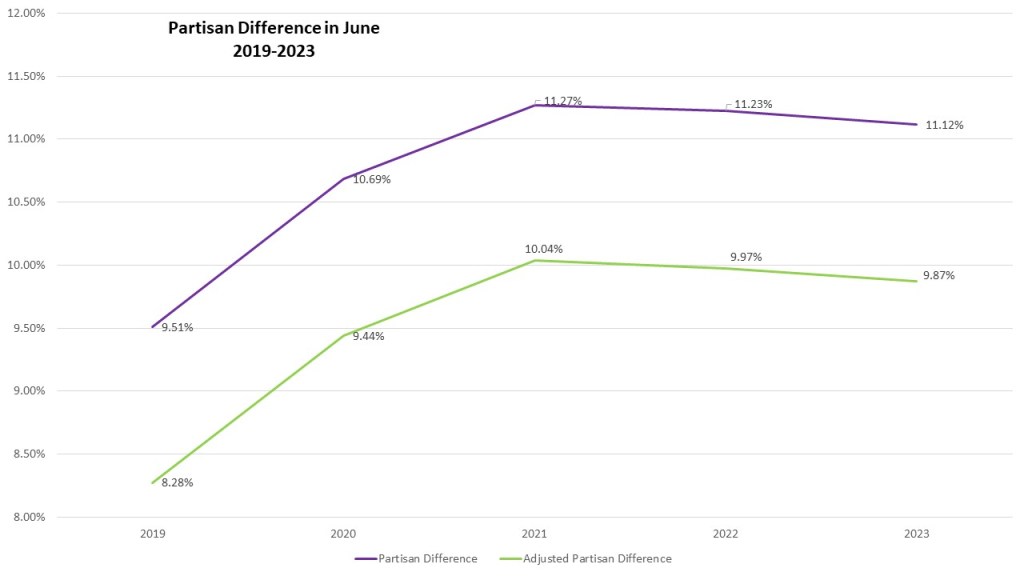
The June primary was established in 2019 so we only have data for where Onondaga County stood in June going back to them. Still, we are seeing more evidence of a leveling off in partisan advantage for the Democrats. During the Trump years the October registration levels showed significant increases for the Democrats, until 2022. We are seeing that in the June registration numbers The Partisan difference (Democrats vs Republican percentage) as well and Adjusted Partisan Difference (Democrats & WFO vs Republican & Conservatives) grew significantly in 2019 and 2020. However, in 2021, 2022, and 2023 we saw a levelling off. Trump being out of the Whitehouse is one of the reasons for this.

However, another reason for the slowing of and tepid decrease in Democratic partisan advantage is the rise of the percentage of the Electorate that is non-enrolled is taking up in the total population of Onondaga County voters. The Non-enrolled grew from 25.74% of the electorate to 28.19% since 2019, +2.45%. Democrats have remained steady during this time, gaining in 2019 and 2022 but slightly failing since then for a +0.16% gain. Republicans have still steadily lost ground, losing 1.46% since 2019.

This is my final look back at data stemming from the June primary. I will now start to refocus my #WeeklyWonks on the remaining Political subdivisions having contests in this fall’s election. I will restart my town series looking at the Town of Geddes. Comeback each week to look at the data that makes up our home in Onondaga County. Remember to subscribe to dustinczarny.com for all election news and content updates.
