
Welcome back to #WeeklyWonk. Each weekend I publish an article on a subject relating to elections in Onondaga County and New York State. Often these articles will have detailed stats to consume but sometimes they will be a recap of a prominent issue or on relevant election law. Today is my final recap of Onondaga County before Tuesday’s General Election.
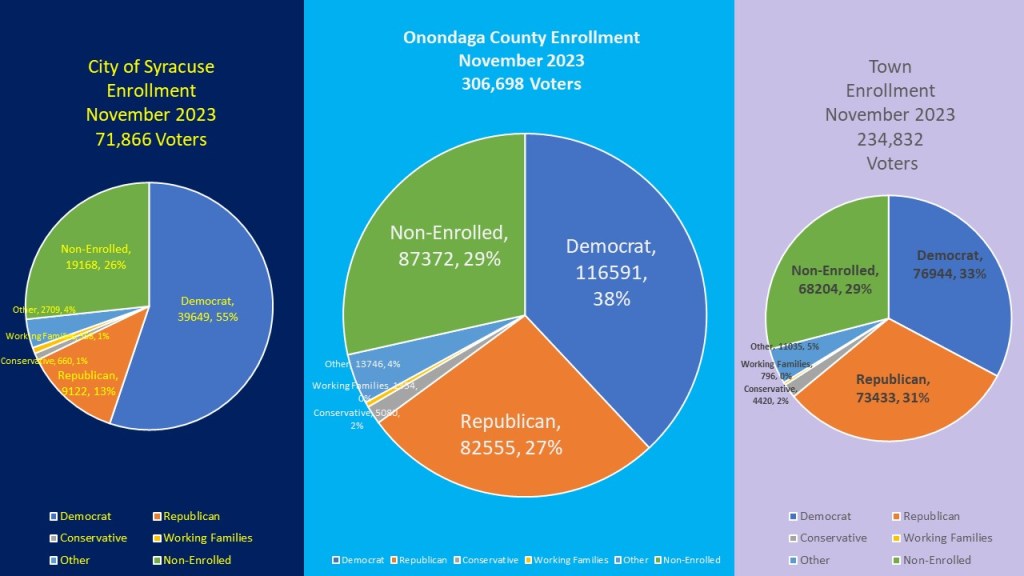
Onondaga County ends the year similar to how it started. As of Friday November 4th, we had 306,698 active voters in our county. Onondaga County overall leans slightly to the left. #8% of voters (116,591) are Democratic, 27% are Republican (82,555), 29% non-enrolled (87,372) with about 6% third party. The City of Syracuse makes up only 23.4% of the county with 71,866 voters. The City of Syracuse makeup is overwhelmingly Democratic with 55% of the voters (39,649) enrolled in the Democratic party, 13% Republican (9,122), 26% non-enrolled (19,168) and 6% third party. Finally, the nineteen towns of Onondaga County make up 76.6% of the voters of Onondaga County and are borderline Democratic. Thirty-three percent of the voters (76,944 are enrolled as Democrats, 31% (73,433) are Republican, 29% are non-enrolled (68,204) and around 7% are enrolled in a third party.
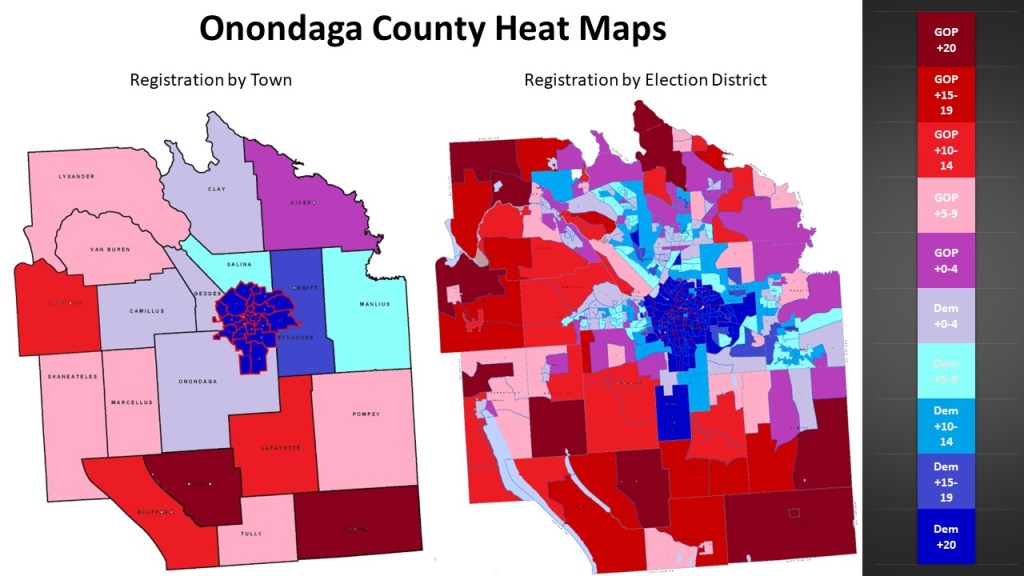
I have been doing heat maps for you all year, but this is my first heat map of our entire county. First, I do a heat map of the individual town and ward registrations. All nineteen wards of the city of Syracuse are rated overwhelmingly Democratic (+20% DEM). The Town of Dewitt is the bluest Town of Onondaga rating in the moderately Democratic category (+ 10-4% DEM). The towns of Manlius and Salina rate in the slightly Democratic category (+59% DEM). Camillus, Clay, Geddes, and Onondaga are rated in the borderline Democratic category (0-4%). Cicero is borderline Republican (+0-4 GOP). Lysander, Marcellus, Pompey, Skaneateles, Tully, and Van Buren rate slightly GOP (+5-9% GOP). Elbridge, Lafayette, and Spafford are moderately GOP (+10-14% GOP). However, I also provided a heat map of all 442 Election Districts in Onondaga County. We have 2 EDs that are actually tied and white, and small EDs with no voters in them that are black. Looking at the ED heat map we can really see the diversity of our home. Most towns have a great deal of diversity in them, and it is beautiful to see.
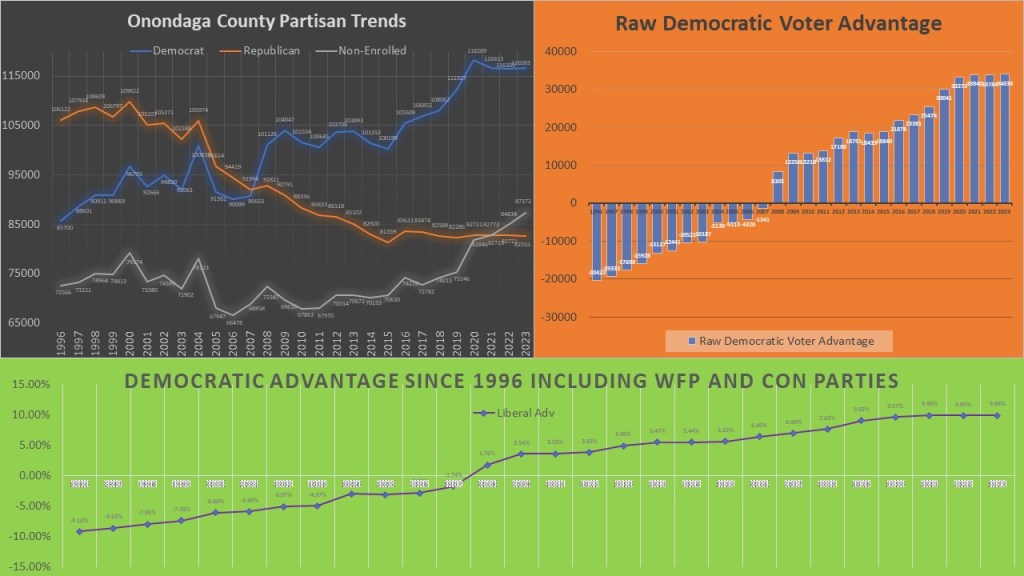
These are the historical trends for Onondaga County. We can see in 1996 Onondaga County started out as a pretty overwhelmingly GOP county. However, starting in 2004 we really start to see two dynamics starting to work, the GOP started to lose voters dramatically as their aging population was not replaced as voters moved or died. Then in 2008 we saw a dramatic rise in Democratic registrations around the Obama election. Democrats stayed steady as the GOP decreased until 2016. In the wake of the 2016 election, we saw dramatic increases in Democratic enrollment as the GOP plateaued. The non-enrolled though started to make their rise in 2019 and continues, while The Democrats have levelled off. While Democrats have a dramatic raw Democratic voter advantage (+34k) it has not changed much over the last few years. When we look at the Democratic advantage when paired with their traditional allies the Working Families party and the GOP paired with the Conservative party, Democrats have a +9.88% advantage.
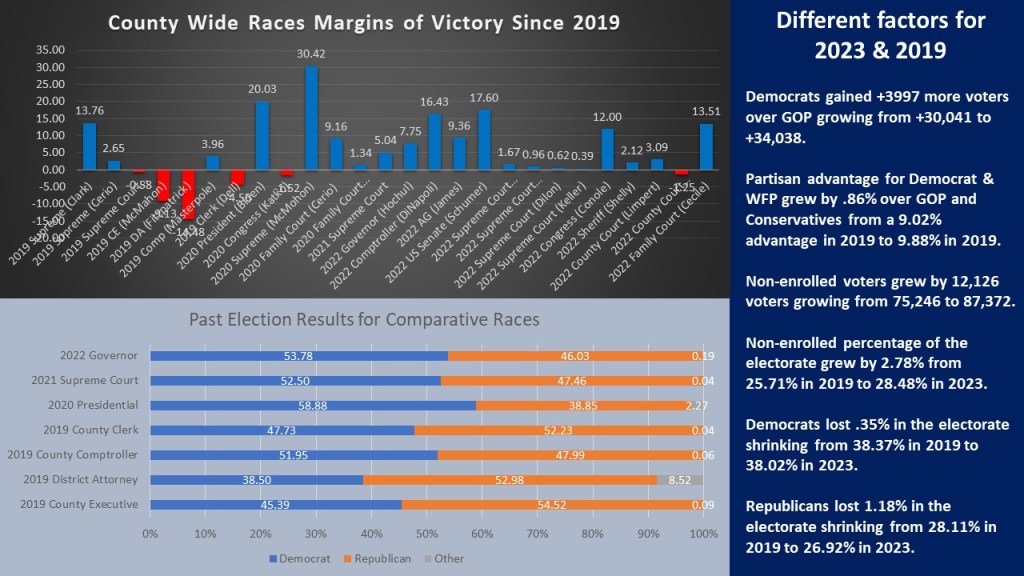
As we look toward the 2023 elections it is helpful to look at the results in our county since the last similar election, 2019. In 2019 the GOP won three of the four county-wide seats but the Democrats running for Supreme Court both carried Onondaga County. Since 2019 Democrats running County wide or in districts that has all of Onondaga County in its Democrats have won 17 of 19 races. We can also see that though the changes have leveled off in the last few years, the electorate is dramatically different than in 2019. Democrats have added to their raw voter advantage by nearly 4k voters and partisan advantage by almost 1%. However, the most dramatic increase is the over 12k new non-enrolled voters. In fact, overall Democrats lost .35% and the GOP lost 1.18% in their share of the county population while the N/E have gained 2.78%. The Raw Democratic gains and the unpredictable N/E population will help shape the 2023 election.
That does it for my last look at 2023. Early Voting runs today, Sunday November 5, 2003 9am to 5pm. You can still get an absentee ballot in person Monday November 6th 8:30 to 4:30 pm, and Election Day is Tuesday November 7, 2023 6am to 9pm. Go to onvote.net to get information. I will take a break from the Weekly Wonk as the election will have happened, but ballots and data will still be in flux. Starting two weeks from now I will start to take a look back at the 2023 Election and look forward to 2024. As always you can subscribe to dustinczarny.com to get all content updates and election news below.
