Welcome back to the #WeeklyWonk. This weekly column investigates an electoral aspect of Onondaga County or New York State. I am currently in my end of year review. This has been slightly delayed as the election was not certified because of the county-wide hand count for the County Clerk race. However, we are just in time to wrap up the 2023 General Election. I am on my final look back at the 2023 General election looking at the Election Day and Overall Turnout.

We had 90,744 voters in the 2023 General election. As of closing the books before the election Onondaga County had 306,077 eligible voters. That means 215,333 voters stayed home. A turnout percentage of 29.65%. the lowest since 2015. The voter turnout by party was Democrat 41%. Republican 34%, Non/enrolled 20%, Others 3%, Conservatives 2%, and Working families less than 1%. We get our first clue of why Democrats did particularly well as they led Early and Absentee voting as we saw last week, but they also led Election Day as well. Election Day check-ins were led by Democrats (38%), followed by GOP (36%), None-enrolled (20%), and third parties 6%.
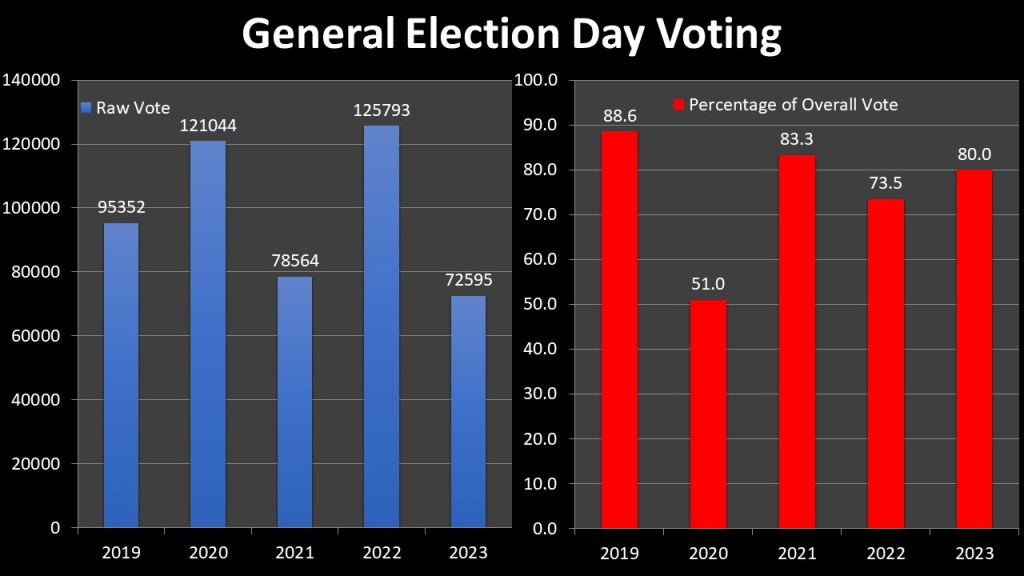
Like Early Voting and absentee, we now have three data sets of similar elections to look to see how that population is changing: 2019, 2021, and 2023. We can see a slight but steady decline in overall voters as well as percentage of the actual vote. The 72,595 voters that chose Election Day in 2023 is down from 78.564 in 2021, and 95,352 in 2019. Of course, overall voters were down as well so we have to look at the percentage of the overall vote that Election Day represents. There too we see a steady decrease from 88.6% in 2019, 83.3% in 3031, and 80.0% in 2023. Voters are choosing alternative voting options, absentee and Early Voting, at a more frequent rate each year. We will need to see more even year elections before we can analyze those populations however it does look as if non-frequent voters in those elections prefer the alternative voting even more.
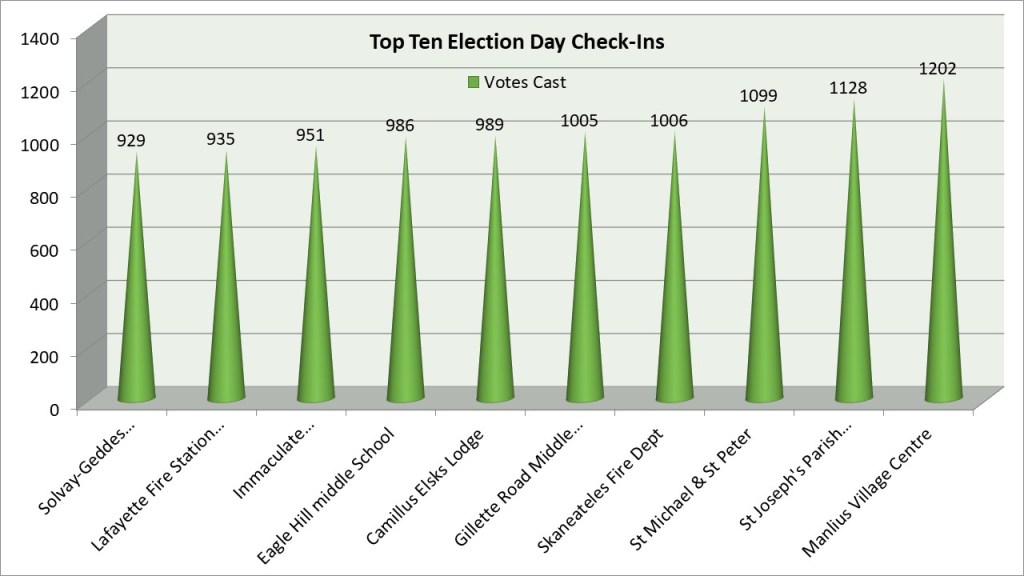
We actually had some changes to the top ten Polling places from last year with six new sites vaulting into the top ten. That is because redistricting gave us an opportunity to look at some of our highest polling places and restructure to address some of the largest lines, we saw in 2022 to get ready for the 2024 Presidential election. Some of the biggest sites from last year dropped off because of this: North Syracuse School District, Marcellus Fire House, Bucley Road Baptist Church, East Syracuse Fire Station, Camillus Municipal building, and Baldwinsville Public Library. It is no surprise though that all ten of our top ten sites are Town sites that tend to be larger as there are fewer acceptable sites and cater to a more mobile population than City sites that have more population without vehicle access.
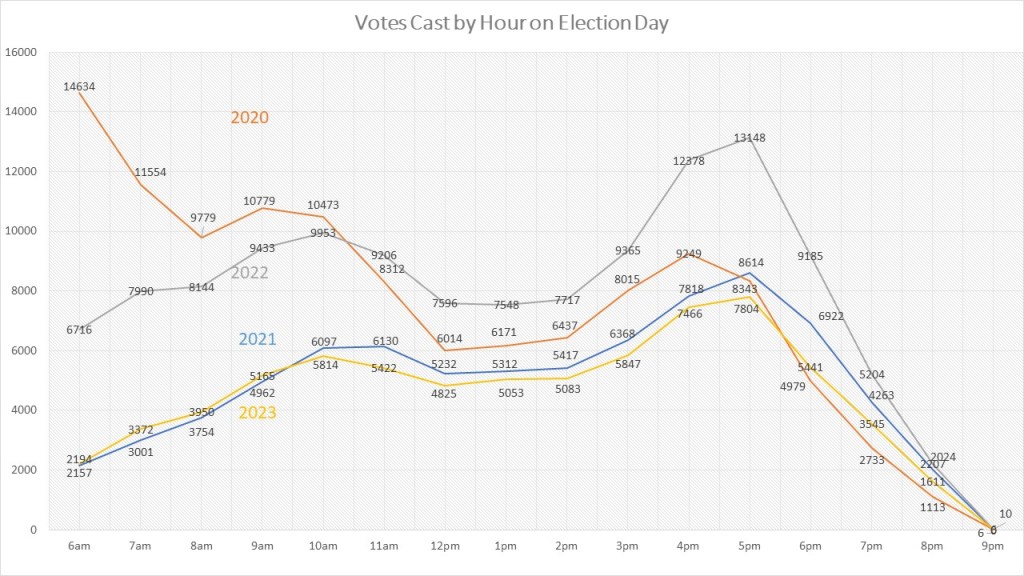
Before 2019 it was impossible to track how voters were processed each hour in our polling places, but then we did a full roll out of electronic poll books which now allows us to track that data. Unfortunately, I did not have the foresight to get the 2019 data before it was deleted (It only has a two-year retention rate). But now we have a full four-year cycle of hourly check-ins. 2023 really mimicked 2021 and in the morning actually outpaced it. However, at 10 am there was a notable and consistent drop off from. e 2021 rate. The pattern held the same, slow morning a steady increase till 10am, then a steady volume until 4pm and 5pm after work rush then dwindling rapidly until 9pm.
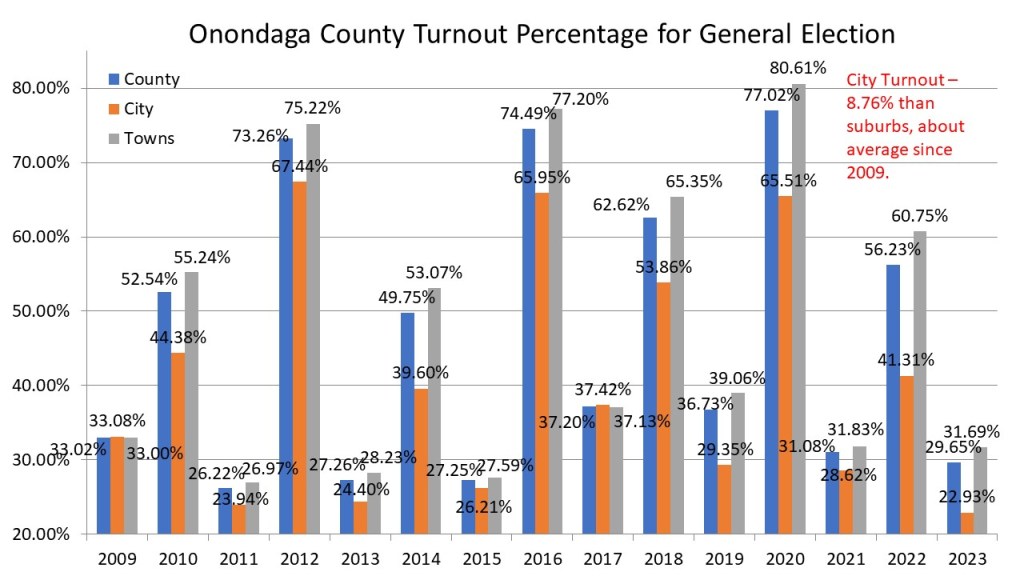
When looking at City vs Suburban voting, the City of Syracuse continued its trailing of suburban voter participation rates. Overall turnout was 29.65%. The towns turned out at a rate of 31.69%. The city turned out at a rate of 8.76%. That is a turnout deficit of 8.76%. That is near the 15-year average of 7.93% deficit. Ironically in odd years is where the city has had less dramatic deficits than the federal elections where the deficit is more dramatic because of surges in the Towns. The only two years since 2009 where City turnout was higher than Town turnout are 2009 & 2017. We had competitive seeming open mayoral elections in each of those years (2009 Stephanie Miner and 2017 Ben Walsh) that drove city voters to the polls.
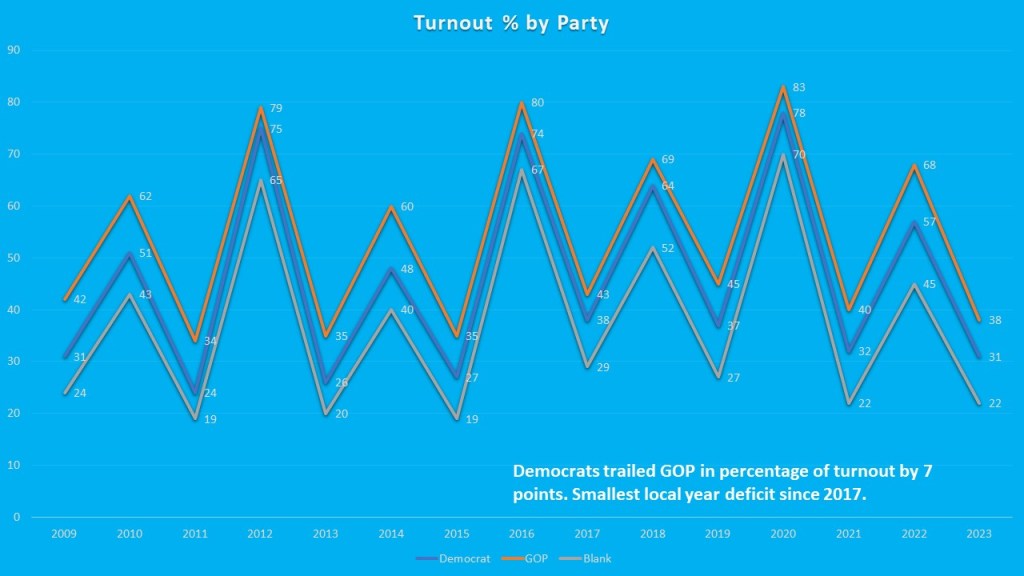
Where 2023 really changed was in party turnout deficits. There has never been a year where Democrat population has turned out in as high a percentage as the GOP population. Likewise, the non-enrolled squarely sits in third place each year. Remember Democrats and non-enrolled voters outnumber Republican voters, so even though they trail in percentage turnout Democrats usually outnumber GOP at the polls in modern elections. The name of the game is to reduce the deficit. In years where Democrats close in on the GOP they do well. Those are usually Presidential years, though 218 was a midterm that functioned as a Presidential. In odd years Democrats have specially trailed the GOP. The 7-point turnout deficit between the Democrats and the GOP is the lowest deficit since 2017 and lower than the average which is why they were successful in close county wide races like Family Court and County Clerk as well as some Town races.

My final slide is a new statistic I am going to keep track of. Starting in 2022 New York State mandated that any race that is within .5% between the leader and challenger must be recounted by hand to assure the ultimate outcome. Onondaga has become the king of hand counts. In 2022 we were part of the #sd50 hand count that counted 1130k ballots in Onondaga and Oswego County, 94k of which was in Onondaga County. We followed up again this year having to count all 91k ballots this year for the County Clerk race. We had three additional races that were close as well in 2023 Town Council Ward 3, Spafford Town Board, and Solval Village Ward 1. Despite these massive hand counts we see the deficit lead changed extraordinarily little. IN the SD50 race with 123148 votes cast John Mannion lost seventeen net votes from the final absentee canvass through the hand count process. In the County Clerk race Emily Essi lost sixteen votes out of 87430 votes cast. This shows the tremendous accuracy of our voting machines. I believe in the hand count law because it gives finality to the process. However, there is an argument for reform for the large ballot races where the lead changes have no chance to change the outcome. John Mannion’s 27 vote lead reducing to ten is definitely a race where a headcount is needed. Emily Essi’s 207 vote lead is an example of where the hand count was probably not needed. Moving the deficit to .25% would save Boards a good deal of time and money for an exercise that cannot change the results.

That is, it for this #weeklywonk. Next week I will rush to get the Election Day and Overall, Voter turnout investigation done before the holidays. I will then take some time off till the new year as we start to focus on 2024. When we get back in the new year, I will look at stats from my website dustinczarny.com. Enjoy the holidays and remember to subscribe to dustinczarny.com for all content and election news updates.
