
Welcome back to the #weeklywonk. Each week I investigate a political subdivision or election result here in Onondaag County and sometimes beyond. I analyze electoral and registration data to illuminate how voters are behaving and interacting with our Democracy. This week I start my two parts look back at the April 2nd Presidential Primary. I start off by looking at alternative voting methods, Early, Absentee, and Affidavits and how voters used these methods this last election.
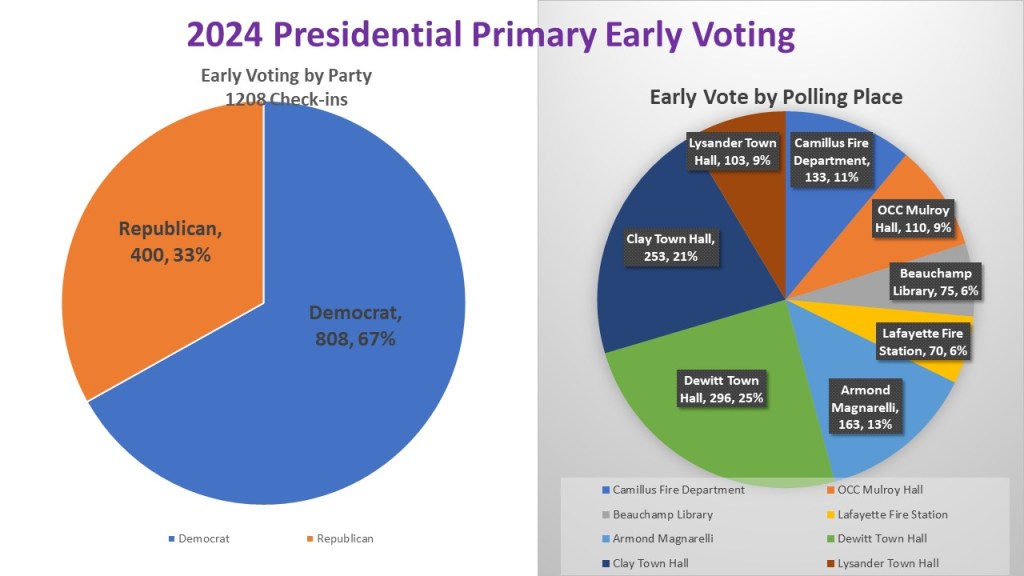
In the 2024 Presidential election we had 1208 voter check-ins during the Early Voting Period. The April 2nd Presidential Primary only had two parties involved, Democrat and Republican. 808 (67%) of the Early Voters are Democrat while 400 (33%) were Republican. We opened 8 sites for the Presidential Primary on April 2nd. The number of sites we open is dependent on the number of eligible voters for the primary, 1 for every 30k voters. There were nearly 200k eligible voters mandated at least 7 sites, and we opened 8. The reason for that is we were forced to make the decision on February 16th when other states were showing record turnout. Of the 8 sites opened they fell into 3 levels of activity.
Dewitt Town Hall (296 25%) was the largest turnout as usual, followed by Clay Town Hall (253 21%) which made up the heaviest usage. The next four sites were all Moderate usage: Armond Magnarelli (163 13%), Camillus Fire Department (133 11%), OCC Mulroy Hall (110 9%), & Lysander Municipal Building (103 9%). The smallest sites once again belonged to Beauchamp Library (75 6%) and Lafayette Fire Station (70 6%). Dewitt Town Hall and Clay town hall continue their ranks over the years of being top sites when they are selected as sites for primaries. Beauchamp and Lafayette Continue to be the lowest performing over the years. However, site performance is not the only reason to select a site, Lafayette Fire Station services voters in the southern part of the county and Beauchamp in the inner city.

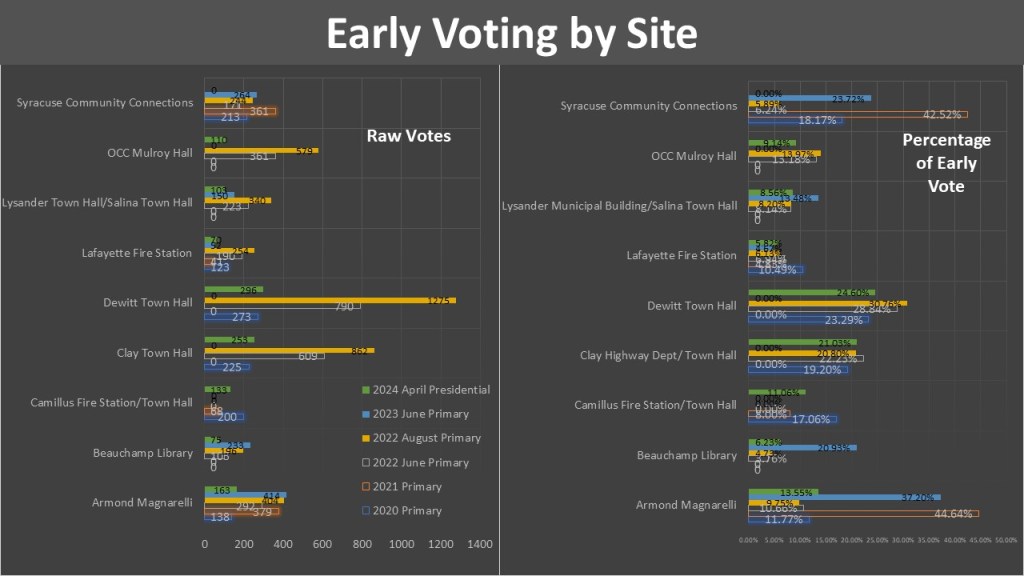
Early Voting took a bit of a hit this primary in terms of raw voters and percentage of the overall vote. Primaries are imperfect elections to compare to each other in the raw vote totals. There are different numbers of eligible voters for each primary. In the 2024 Primary all GOP and Democratic voters were eligible. The best comparisons are the two primaries from 2022. 1208 Early Voters in 2024 compared to 2761 in June of 2022 and 4154 UN August of 2022 shows what a low turnout election this was. However usually even in low turnout over the last five primaries we had seen usage of Early Voting grow in terms of percentage of overall vote. However, 2024 we saw that percentage dip to just 10.58%, the lowest since 2021. There are clues as to why this was the case later in this article.
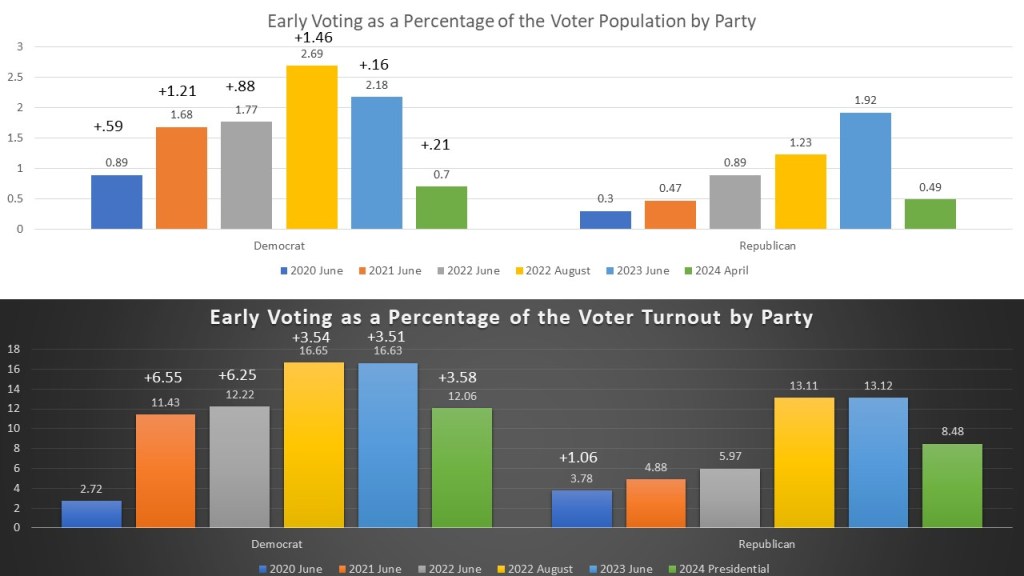
When we look at a comparison of parties that used Early Voting, we can see that Democrats continue to use this alternative voting method at a greater rate. There are more Democrats that Republicans in Onondaga County, so we expect them to outnumber the GOP, however they also are voting at a greater rate. When we look at percentage of the overall voter population in 2024 .7% of the Democrats showed up to Early Vote, while .49% of the GOP did. When looking at the percentage of the voters that chose to vote Democrats led the GOP 12.06% to 8.48%. However, the gap does appear to have closed in the last few primaries and that may be because the anti-Early Vote rhetoric is not as prevalent in the GOP side during a primary as opposed to General Elections.
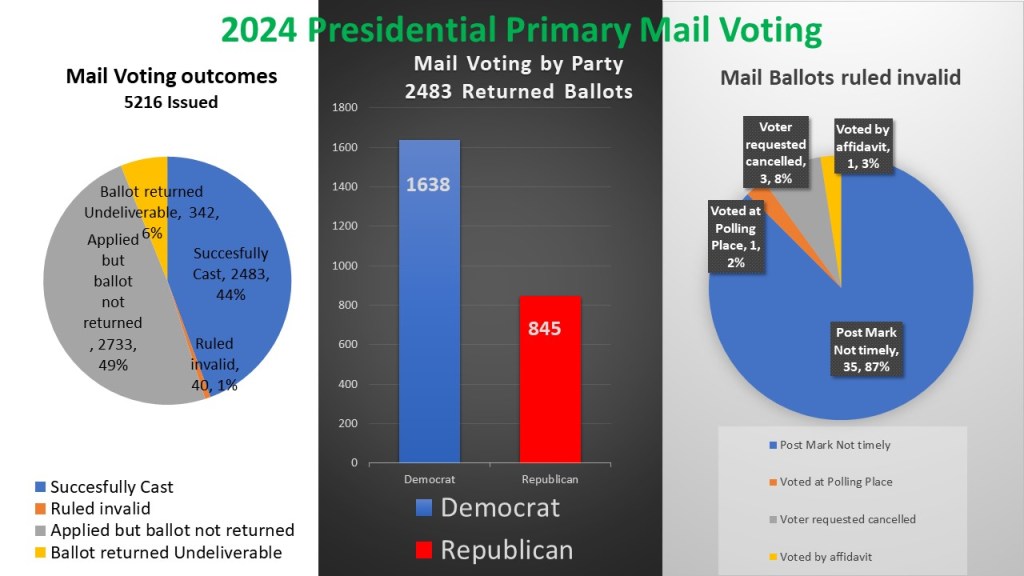
As we look to mail voting there is an interesting story to tell. There are new options for voters when it comes to voting by mail this year, starting with this primary. There is an Early Vote by mail option which eliminates the excuses that absentee voting requires. However absentee voting is still an option as it is a permanent option for every election as opposed to EVBM which must be selected each year. In purpose of reporting and tabulating they are done together in our system as Mail in voting. We issued 5216 mail ballots for the 2024 primary. 2483 were successfully cast &2733 were never returned. 342 ballots were returned undeliverable to the address on file and an additional 40 were rued invalid. Of the 40 ruled invalid 35 were because the postmark was after Election Day, 3 were because the voter wanted to cancel the ballot after returning, 1 because they voted in person at a polling place, and 1 because they voted affidavit. Of the 2483 successfully returned ballots Democrats had 1638 (66%) and the Republicans had 845 (34%).
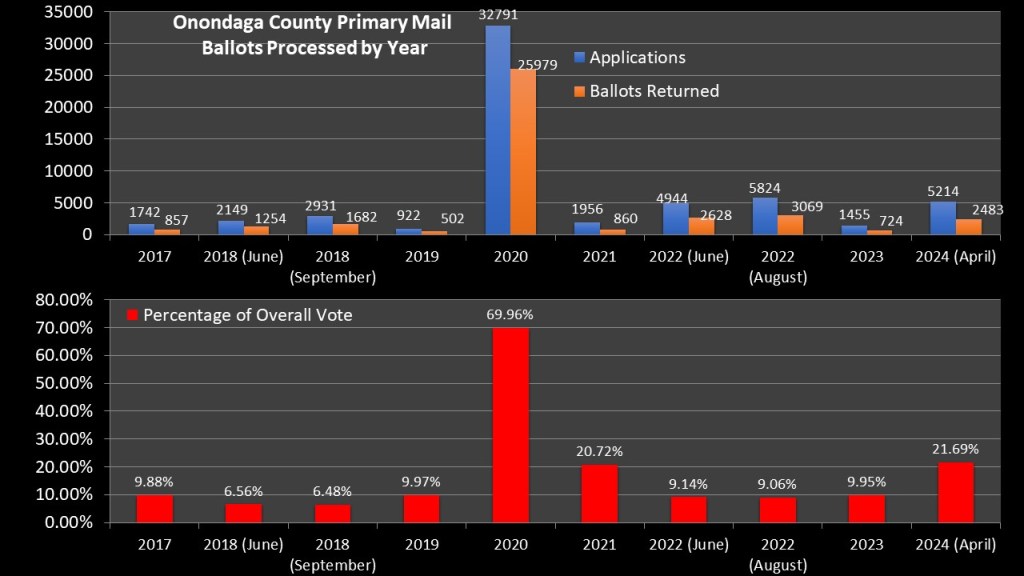
When looking at mail balloting by year in terms of raw numbers it is comparable to the two previous similar primaries in 2022. 2483 ballots returned out of 5214 ballots requested is like 2022 June (2628/4944) and August (3069/5824). However, where this primary stands out is the percentage of the overall vote that was cast by mail. The 2024 primary had 21.69% of the overall ballots cast were cast by mail. This is the highest percentage since the record of June 2020 in the middle of the pandemic which saw 69.96% of the ballots cast by mail. There are several reasons why this occurred. The EVBM option made it easier to chose mail in balloting. The postage paid option removed a barrier to casting ballots. However, the biggest reason may be that when mail ballots were sent out in mid-February the Presidential primary still had active candidates on both sides of the aisle. Nikki Haley and Dean Phillips pulled out after the Super Tuesday contests in early March which made the April 2nd primary in New York fait accompli. This made Early Voting and Election Day turnout smaller than normally expected increasing the returned absentee influence on the election.
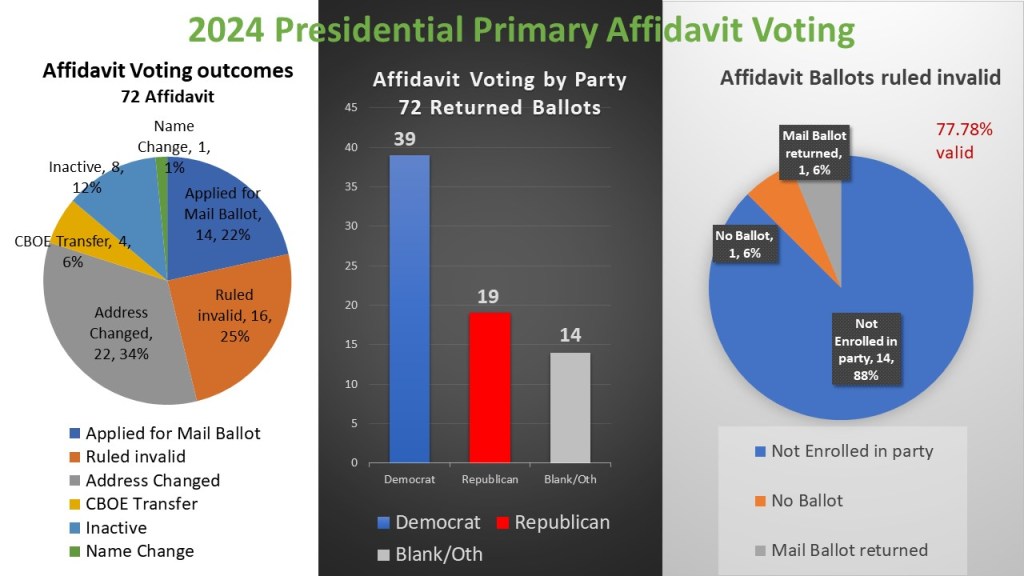
The last form of alternative voting is voting by affidavit balloting. Affidavits are cast by voters who are not listed as active voters at their current address when they show up in person to Early or Election Day. In the 2024 Presidential primary we had 72 voters who voted by Affidavit. 54 ballots were ruled valid: 22 were voters that changed their address, 14 were voters who applied for but did not return a mail ballot, 8 were voters classified as Inactive, 4 were CBOE transfers from other counties, and 1 a name change. Of the 72 Affidavit ballots 39 were Democrat, 19 Republican, and 14 were of voters by another party. Since New York is a closed party state, all non-Democrat and non-Republican affidavits were rejected, and the voters properly registered for future elections. In addition, 1 voter had already returned a mail in ballot and 1 voter returned an affidavit envelop with no ballot. That means 77.78% of all affidavit voters had their ballots accepted and counted.
That is all for this week’s edition of the #weeklywonk. Next week I will conclude my look back at the April 2 Presidential Primary with a look at Election Day and overall turnout. As always you can subscribe to dustinczarny.com for all content and election news updates.
