
Welcome back to the #weeklywonk. In this space I try to shed light on the forces that make up the body politic in New York and Onondaga County. Each week I will look at electoral and registration data that make up a political subdivision or an election event. I continue my look at political subdivisions that will make up the General Election 2024. This week I investigate the only town having a primary this election, the Town of Lysander.

The Town of Lysander has 17,525 active voters making it a mid-size suburban town in Onondaga County. Democrats make up 5,059 voters or 29% of the active registered voters of the district. The GOP makes up the plurality with 6,345 voters (36%). The non enrolled are a close third with 4,928 voters (28%). The GOP have a +7.34% enrollment advantage. For this article, I once again break up the town into Western, Center, Southern, Eastern regions, and a portion of the Village of Baldwinsville. The southern portion (eds 5,8,9,10) make up 24% of the town (4,172 voters). The eastern portion (eds 6,13,14,16) make up 23% of the town (3,970 voters). The center portion (eds 3,11,17,18) make up 20% of the town (3,486 voters). The western portion (eds 1,2,15) make up 14% of the town (4,172 voters). There is also a portion of the village of Baldwinsville that straddles Van Buren and Lysander. The Lysander portion of the village of Baldwinsville (Eds 4,7,12) make up 19% of the town (3,381 voters).

The Town of Lysander has had quote a journey since 2009. This once blood red town has moved quite a bit towards the Democrats. And non-enrolled. This is dramatic during the Trump’s Presidency from 2016 to 2020 Democrats gained 1,173 voters, the Gop gained just 539 voters and the non-enrolled gained 1013 voters. Since 2021 the district has remained basically stagnate with Democrats gaining just 33 voters, the GOP losing 185 voters, and the non-enrolled gaining the most with 494 voters.

The five different regions of Lysander are all lean to the GOP but by different degrees. The most GOP district is the West, with the GOP having a +20.39% advantage and the Democrats outnumbered by the N/E. The second most GOP district is the southern region with the GOP having a +9.13% advantage and once again the Democrats in third place to the n/e. In the eastern district the GOP has just a +4.86% advantage and the Democrats rose to 2nd place. The Center district is +3.90% GOP as Democrats inched closer to the GOP. The least GOP portion is the village of Baldwinsville with just a +1.86% advantage for the GOP.
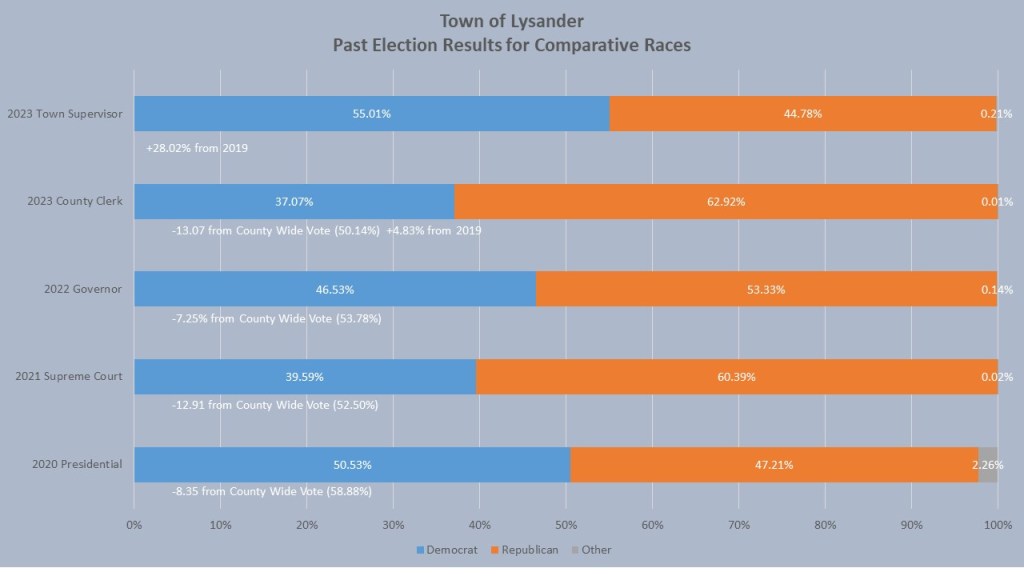
It’s a new year and we have a new addition to our four comparative races, though it will feel slightly familiar. In addition to the Presidential race of 2020, the Supreme Court race of 2021, the Governor’s race of 2022, we will look at the County Clerk race of 2023 to compare how it performed in the political subdivision we are investigating. This replaces the 2019 County Clerk race, but we can now compare those races as well. This town, though a slight GOP lean, has shown an ability to vote Democratic. In 2020 Biden won this town by 4.34%. The Democrats also won the Town Supervisor race in 2023 by 10.23%. However, the GOP won inside Lysander for the 2023 County Clerk race (+13.07%), 2022 Governor (+7.25%), and 2021 Supreme Court (+12.91%). However, another promising sign for Democrats is the electoral chances seem to be improving. When comparing the 2019 County Clerk race to the 2023 County Clerk race Democrats did +4.83% better. Also, when comparing the 2019 Town Supervisor race Democrats did +28.02% better but that can be chalked up to Kevin Rhode consolidating support with the conservative party running a 3rd party candidate in 2019 while supporting Supervisor Rhode in 2023.

Last year I introduced heat maps as a way of showing the complex makeup of the political subdivisions that will have races this year. #SD48 has some of the highest variety of political polarization of any district we will see this year. There is only one of the 18 election districts (17) where Democrats have an advantage, represented by the solid blue category (Dem +10-15%) The eds with light purple (eds 4 & 8 have a borderline Dem lean (Dem 0-5%). The eds with the dark purple (eds 6,7,12,13, & 18) have a borderline GOP lean (GOP 0-5%). The eds in pink (ed 11 & 14) have a slight GOP lean (GOP 5-10%). The eds in red (Eds 5,9, 16) have a solid GOP lean (GOP 10-15%). The eds in burgundy (eds 2 & 3) have a strong GOP lean (GOP 15-20%). Finally, the eds in dark red (ED 1,10,15) have an overwhelming Gop lean (GOP +20%).
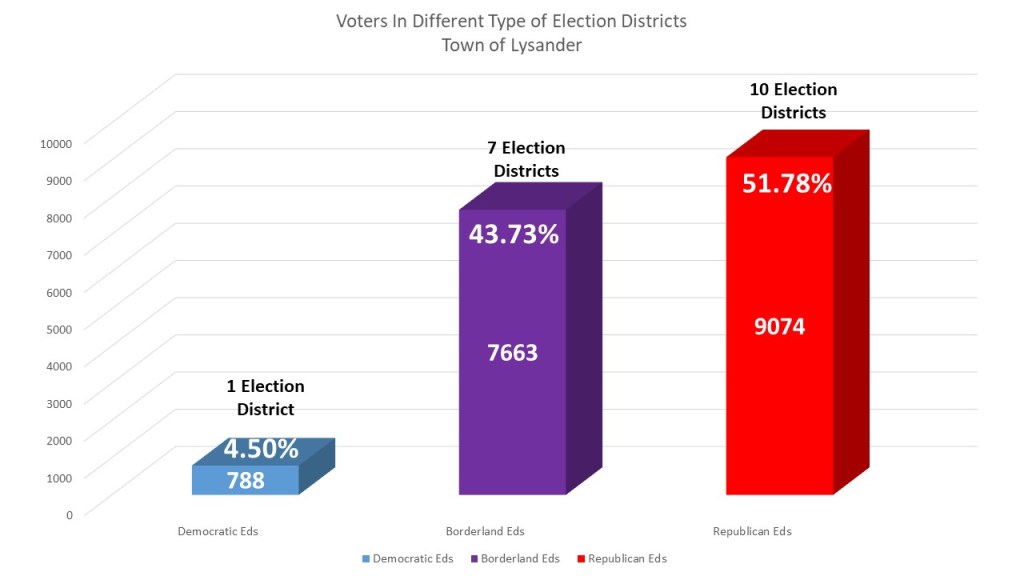
This year in addition to the heat map I look at the number of districts that lean. Though Lysander has been trending towards the Democrats over the last 15 years, there are no regional advantages for the Democrats. There is only one ed out of the 18 that democrats with 788 voters or 4.5%. There are 7 eds with GOP lean have 9074 voters or 51.78%.

There will be a GOP primary for the Lysander Town Board vacancy between Joel Lorenzo and Eugene Dinsmoore. The Conservatives have backed Eugene Dinsmoore setting up an interesting problematic outcome for the GOP should Dinsmoore win. The Democrats have nominated Ken Christopher who ran unsuccessfully for Town Justice in 2023. The Democrats best hope is to form a coalition amongst Democratic and non-enrolled voters to overcome the slight GOP advantage and hope for increased turnout among democratic constituencies due to the Presidential race. Though a split ticket may theoretically help Democrats, it didn’t in 2019 when the GOP won a similar race for town supervisor by over 28%.

That is, it for this week’s edition of the #WeeklyWonk. Next week I will look at the village of Liverpool that is having village elections in June of 2024. They have a proposition to move their elections to November so we will get a sense of the village as a whole. As always you can find it on dustinczarny.com where you can subscribe for email notifications for content and election news updates.
