
The #weeklywonk is back! About once a week I will write an article looking into the registration and electoral data in Onondaga County. In 2025 This will be a semi-weekly article and switch between electoral results data and registration data on races having elections this year. This week we will start to look back at the 2024 General Election and review the different data pieces from this pivotal event for our county. This week we start off by looking at Alternative voting in the 2024 General Election.
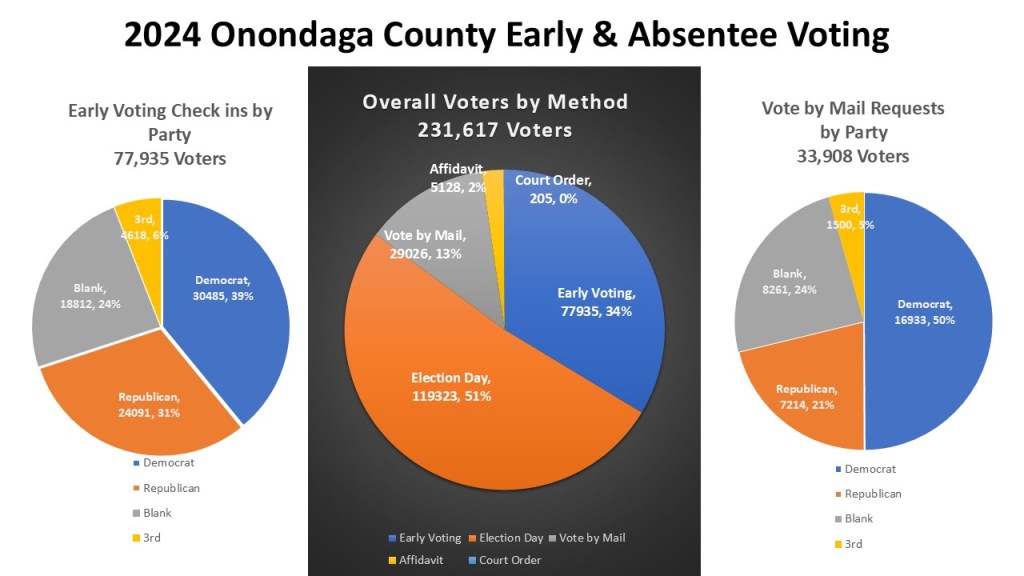
When I talk about alternative voting, I am referring to ways to cast a vote other than showing up and voting on Election Day in the normal matter. Alternative Voting generally comes in 4 main categories: Early in Person Voting, Vote by Mail, Affidavit Voting, and Court Orders. In 2024 we had 231,617 voters of which 51% (119323) voted on election Day. The remaining 49% voted in alternative methods. Early Voting (77,935 34%) led the way, with Vote by Mail (29,026 13%), Affidavit voting (5,128 2%), and finally court orders (205 <1%). Democrats tend to dominate alternative voting, and it was no different in 2024. Democrats made up 39% of Early Voters and 50% of Vote by Mail Voters. Republicans did a little better in Early Voting climbing to 31% but only 21% of Vote by Mail voters. Non enrolled made up 24% of both Early and Vote by Mail voters. 3rd Party voters were 6% of Early Voters and 5% of Vote by Mail.

Early Voting has only been in place since the general election of 2019. Looking at the raw total of Early Voting, the 77,935 Early Voters in the 2024 General Election easily broke the record of both raw vote (59,284) and percentage of the over vote (24.96%) set in the last Presidential election. When making comparisons we should look at similar years in the four-year cycle. We have now had only two repeat years of similar years, 2019 & 2023 as well as 2020 & 2024. In both cases we saw significant increases from the past cycle in terms of raw vote totals. The 2020 to 2024 increases saw a 31.46% increase in raw totals and a 34.94% increase in percentage of overall vote.
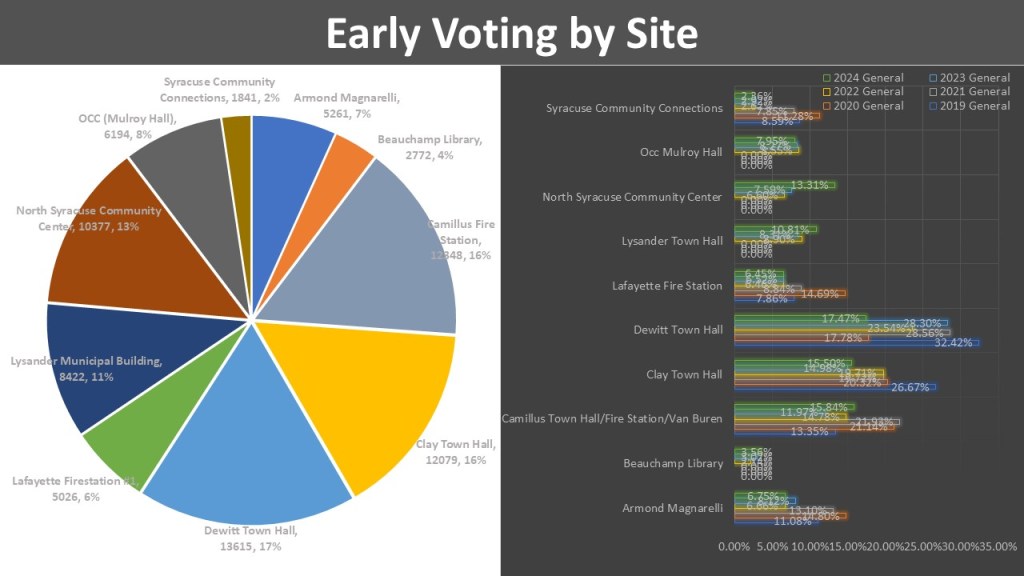
We have 10 Early Voting Sites for a general election. Onondaga County started with 6 Early Voting sites from 2019 to 2021 and increased to ten in 2022 and remains to this day. These site numbers represent the minimum Early Voting sites required by NYS law. Over the course of the last few cycles our Early Voting sites have grouped themselves into large, medium, and small volumes which held the same in 2024. The 3 large sites are Dewitt town Hall (13,615 17%), Camillus Fire Station #1 12,348 16%), and Clay town Hall (12,079 16%). The 4 medium sites are North Syracuse Community Connections (10,377 13%), Lysander Municipal Building (8,422 11%), OCC Mulroy Hall (6,194 8%), and Armond Magnarelli (5,261 7%). Finally, there are three small sites Lafayette Fire Station #1 (5,026 6%), Beauchamp Library (2,772 4%), and Syracuse Community Connections (1,841 2%). One of the innovations we used this year was a wait time display on our website which helped spread out the totals and kept our large sites from being overwhelmed as in previous years.

Vote by Mail experienced large volumes in 2024 with the addition of the Early Vote by Mail option which allowed a non-excuse-based ability to vote by mail. This saw a large increase in terms of requests (33.908) and returns (29. 361). This was down from the records in 2020 (68,468 & 57,203) which was skewed due to the COVID pandemic. In addition, the return rate, the number of ballots returned versus request, was 86.59%. This represents one of the largest return rates since tracking started in 2009 indicating an enthusiasm, at least among vote by mail voters, to participate in the 2024 election. The percentage of the over all vote though is hard to compare. Since the pandemic we have had a variety of circumstances and access laws different just about every year. The 12.53% certainly shows a jump from the last few years but a decrease from 2020. We also can see that overall, more voters are using vote by mail in comparing previous cycles. We will have to see how the next four-year cycle goes to truly judge.

2024 was also a record year for affidavit voting in Onondaga County, Affidavit ballots are mainly for voters who are properly registered at one point but have moved or need to correct other information. These ballots are counted after Election Day as they need proper research by the staff of the Board of Elections. This was the highest number of voters (5,403) since we started tracking the data in 2009 eclipsing 2012’s record (5112). It was also the highest number of valid affidavits (5,128) by far also eclipsing the record in 2012 (3602). Finally, it also holds the record of percentage of affidavits that were ruled valid (94.91%) eclipsing 2021’s record (91.96%). The new vote by mail canvassing procedures as well as the increased intensity of a Presidential election is the reason we saw a large increase in volume. New rules and hard work of the Onondaga County Board of Elections is responsible for the high percentage of valid votes.
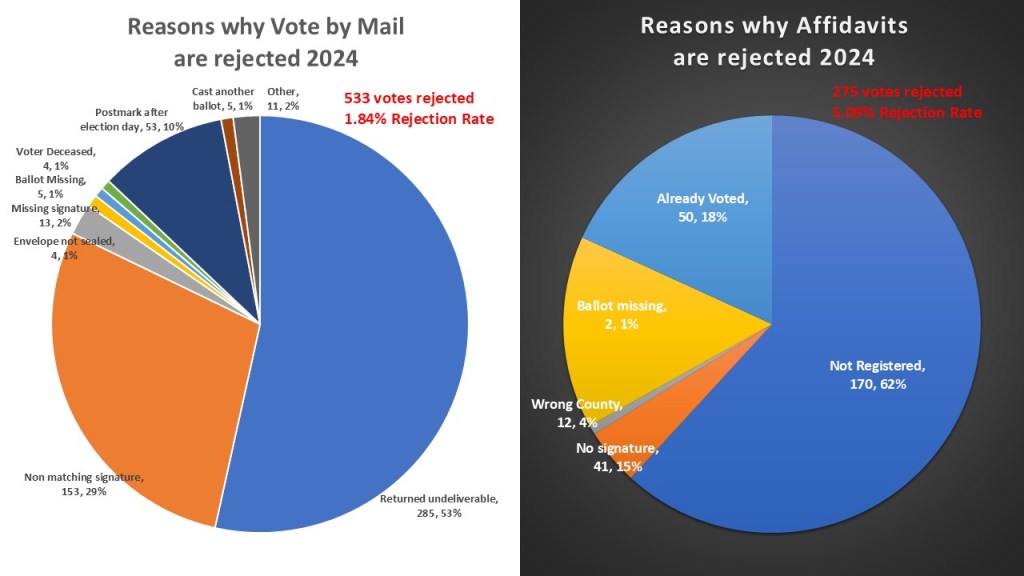
We track the Vote by Mail ballots and Affidavit ballots that are ultimately rejected by the Onondaga County Board of Elections. For both Vote by mail and Affidavits, when we are able, cures are sent to voters when a ballot is ruled invalid seeking to correct any deficiencies to count the ballot. This data represents the ballots that were not cured and had to be rejected. For Vote by Mail 533 ballots that were mailed were rejected for just a 1.84% rejection rate. The largest set of rejected ballots was 285 ballots that we mailed that had an undeliverable address. This is usually due to Permanent Absentee voters moving and not updating their address. Following that 153 (29%) did not have a matching signature, 53 (10%) were postmarked after Election Day, and the remaining 7% are spread over a variety of small reasons. 27th affidavits were rejected with a rejection rate of 5.09%. 170 (62%) voters were not registered to vote at all, 50 (18%) voted either in person or by mail and the affidavit was rejected, 41 (15%) of the affidavits the voter failed to sign the envelope, 12 (4%) were voters who resided in other counties, and 2 (1%) the voters failed to enclose the ballots.
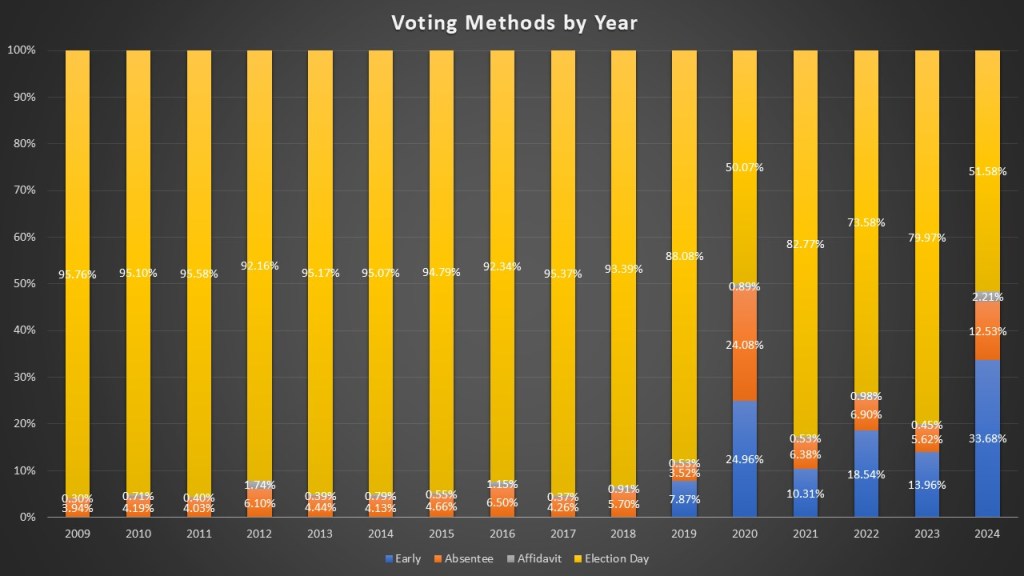
Looking at voting methods by year we get a great sense at how voters are gravitating towards these new options. Before 2019 New York and Onondaga County were primarily in person on election Day voting states averaging just 4-7% of voters voting by mail or affidavit. In 2019 this immediately jumped to 11.92%. During the pandemic in 2020 still holds the record with 49.93% choosing alternative methods. However, we saw growths in 2021 with 16.23%, 2022 with 26.42%, a slight decrease in 2023 to 20.03%, and grew a great deal in 2024 to 48.42%. It is likely that we will continue to see an increased usage rate for alternative voting. Though there was a slight decrease from the similar years of 2020 to 2024, that could be summed up to the anomaly that was the COVID pandemic. We did see a decent increase from 2019 to 2023 (68.04%).
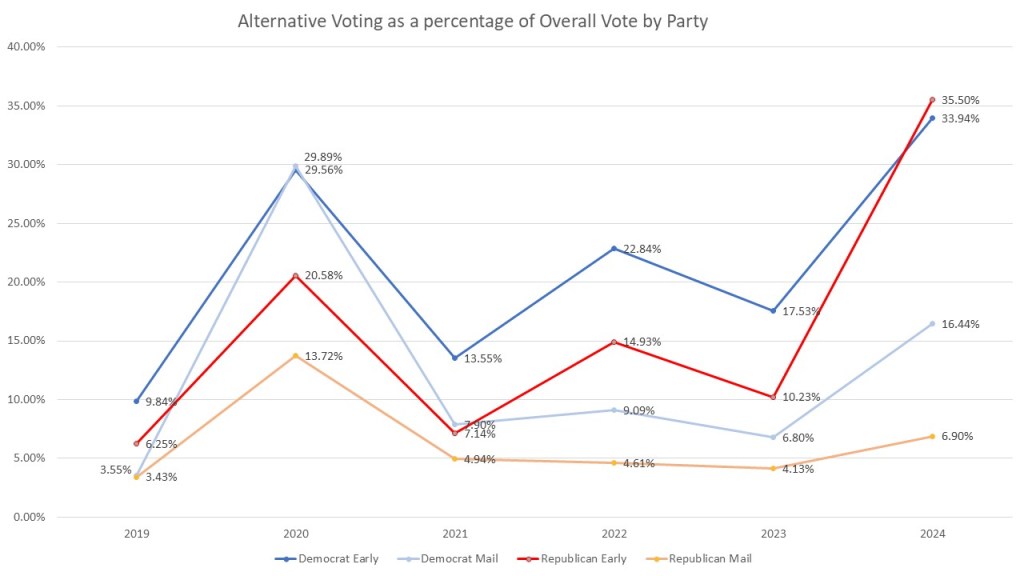
Unfortunately, alternative voting has been a polarizing subject since its introduction in 2019. Democrats outnumber Republicans statistically in Onondaga County. Thuse it is expected for Democrats to dominate the raw numbers of any voting method. However, with Alternative voting we see consistently that a larger percentage of the overall vote chooses the two big alternative voting methods of Early Voting and vote by Mail. In 2024 we saw a dramatic increase in usage of Early Voting by republican voters (3550%). So much so they eclipsed the rate of Democratic voters (33.94%) when comparing the overall turnout. We saw the opposite in vote by Mail. Democrats took better advantage (16.44%) of the new Early Vote by Mail option than the GOP (6.90%) which grew only slightly.
That is, it for this week’s edition of the Weekly Wonk. Next week I continue my look back at the 2024 as we check in on election Day voting and overall turnout. Check back each week at dustinczarny.com as I examine more aspects of our community.
