
Welcome back to the #weeklywonk. This is the semi-weekly column I write on dustinczarny.com. In this article I examine electoral and registration data that makeup our home, Onondaga County and New York State. It has been a few weeks since I have been able to publish an article, but I am finally ready to finish my analysis of the 2024 General Election. This week I look at Election Day and Overall turnout in Onondaga County.
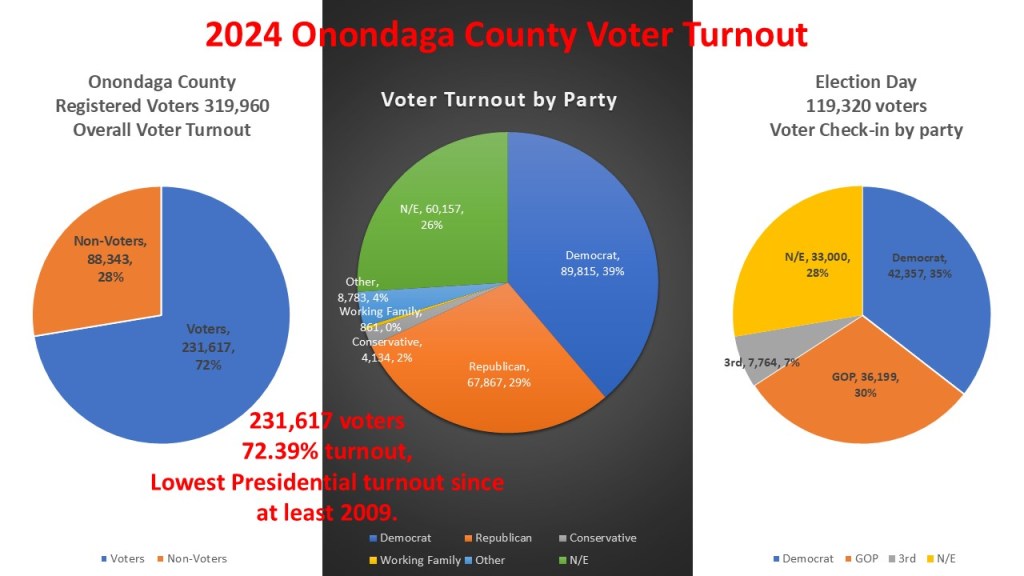
Going into the November 2024 General Election Onondaga County had 319,960 voters. By the end of the 2024 election 231,617 voters participated in the election. Meaning 88,343 registered voters did not participate in the 2024 election. We had 72.39% turnout, which is actually the lowest Presidential turnout since I started tracking data going back to 2009. Of the Turnout we saw 89815 Democrats (39%), 67,867 GOP (29%), 60,157 non-enrolled (26%), 8,783 enrolled in other party choices (4%), 4134 Conservatives (2%), and 861 Working Families (<1%). On Election Day there were 119,320 voters checking in via the Knowink poll pads. That was made up by 42,357 Democrats (35%), 36,199 GOP (30%), 33,000 non-enrolled (28%), and 7,764 made up of other parties (7%). The Election Day universe was more conservative than the overall turnout, but nowt overly so as Democrats still outnumbered Republicans by a significant amount.
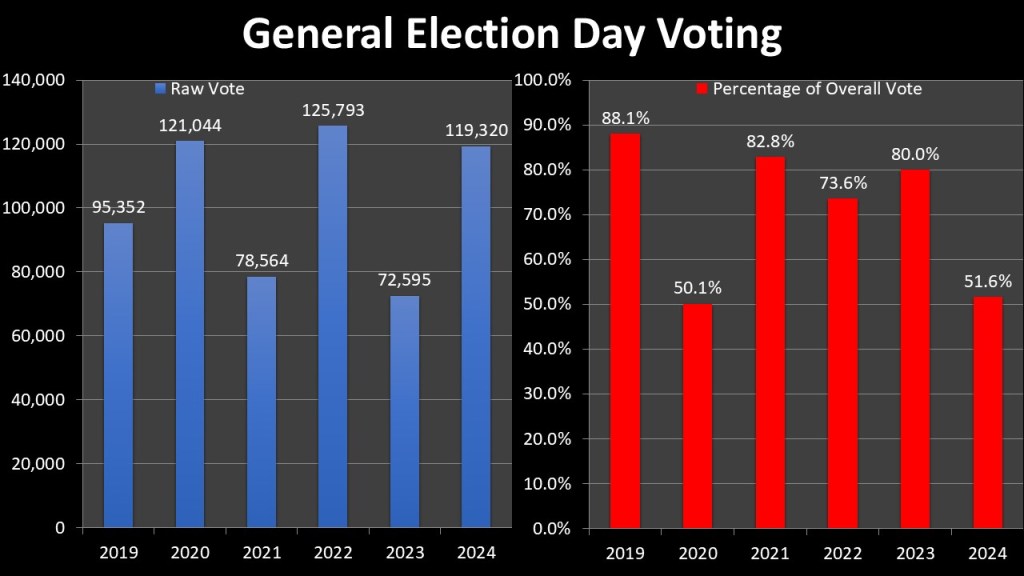
The election Day universe has been decreasing since the introduction of alternative voting methods in 2019. In 2019 Early Voting was introduced, then in response to the pandemic more permissive absentee voting was used 2020-2022. Finally in 2024 the Early Vote by mail option finalized these alternative voting methods. The raw vote total of 119,320 for 2024 was the lowest even year total since the alternative voting methods. When we look at the percentage of the election day when compared to overall turnout, we really see the lasting and permanent change to the Onondaga County electorate that these alternative voting methods had. 51.6% was the lowest total since the pandemic year of 2020 (50.1%). We can also see that there is a steady decline, especially in higher turnout even for years.

The ten top polling places in Onondaga County. Election Day reflects the original polling place sizes. All ten polling places are suburban polling places which tend to be larger polling places that can support large vehicular traffic. They are specially located in the larger suburban towns. Gillette Road Middle School & Brewerton Fire Station are in Cicero. Buckley Road Baptist Church, St. Elizabeth Ann Seton, & N. Syracuse School District are in Clay. Camillus Municipal and St. Joseph’s Parish are in Camillus. Liverpool Christian Church is in Salina. The only one of the top polling places in a small town is Marcellus Fire House in the town of Marcellus.
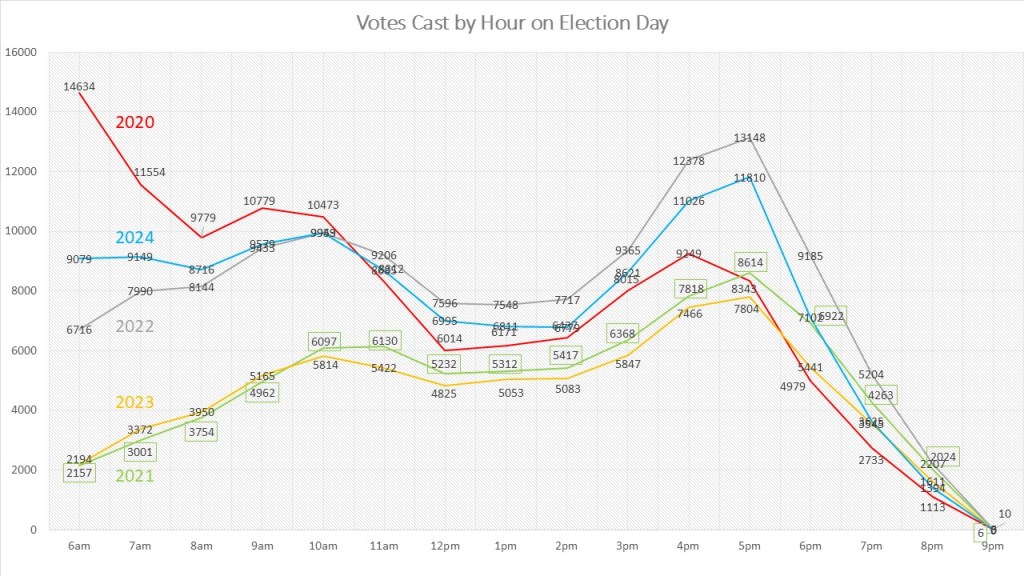
The adoption of electronic polling books in 2019 allowed us to get a unique set of data to map out the hourly turnout for an election. Of the five elections we have been able to track, 2024 acted in a typical fashion with three other elections. Moderate turnout in the morning with a lull around the afternoon and a ramping up of activity in the after-work dinner rush leading to a sharp decline into the evening. We now can see that the pandemic election of 2020 was atypical with the largest hours being the opening of polls with a steep decline into the afternoon and a moderate dinner rush and really low turnout in the evening hours. This highlights the uniqueness of 2020 and why it is hard to make comparisons to it when looking at predicting future presidential elections.

In 2024 75% of Democrats turned out compared to 80% of the GOP. Democrats always trail the GOP in turnout among their members. However, in Onondaga County the turnout deficit of about 5% was the lowest deficit since 2012. The non-enrolled turnout was just 63, 17% lower than the GOP. This was the highest deficit in the three presidential elections I have tracked since 2009 (2012, 2016, & 2020). Just like Democrats always trail the GOP, the non-enrolled are always the least participatory of the three main categories of voters.

We can also look at geography when determining turnout discrepancy. The overall turnout was 72.39%. Turnout in the suburban towns was seventy-seven. The City of Syracuse turnout was just 58.00%. The 19.04% deficit between the city of Syracuse and the suburban towns is the highest on record since 2009. This is a problem that is getting worse with few exceptions. In 2009 and 2017 are the only two years on record where city turnout was higher than the suburbs. These were open mayoral elections following an incumbent that termed out. 2025 is another one of those years so we will see if the pattern holds.

Looking at the individual town turnout we see that the closer we get to the City of Syracuse, the lower the turnout as well. The towns around the City of Syracuse (Salina, Dewitt, Geddes, & Onondaga) have urban feelings and tend to turn out at lower rates than the exurban and rural towns that radiate away from the city of Syracuse. Inside the City of Syracuse, we see a similar pattern. Inner city wards of nine. 10. 15. & Eighteen are lower than other wards inside the city. 16th ward is also low, but that is mainly due to another low turnout population, younger voters in the City of Syracuse.

That is, it for this edition of the #weeklywonk. My next edition I will start to look at Onondaga County as a whole. Every February we take enrollment numbers statewide, and it will be a good opportunity to look at our county and where it stands electorally post this Presidential Election. Subscribe to dustincarny.com to get all content and election news updates.
