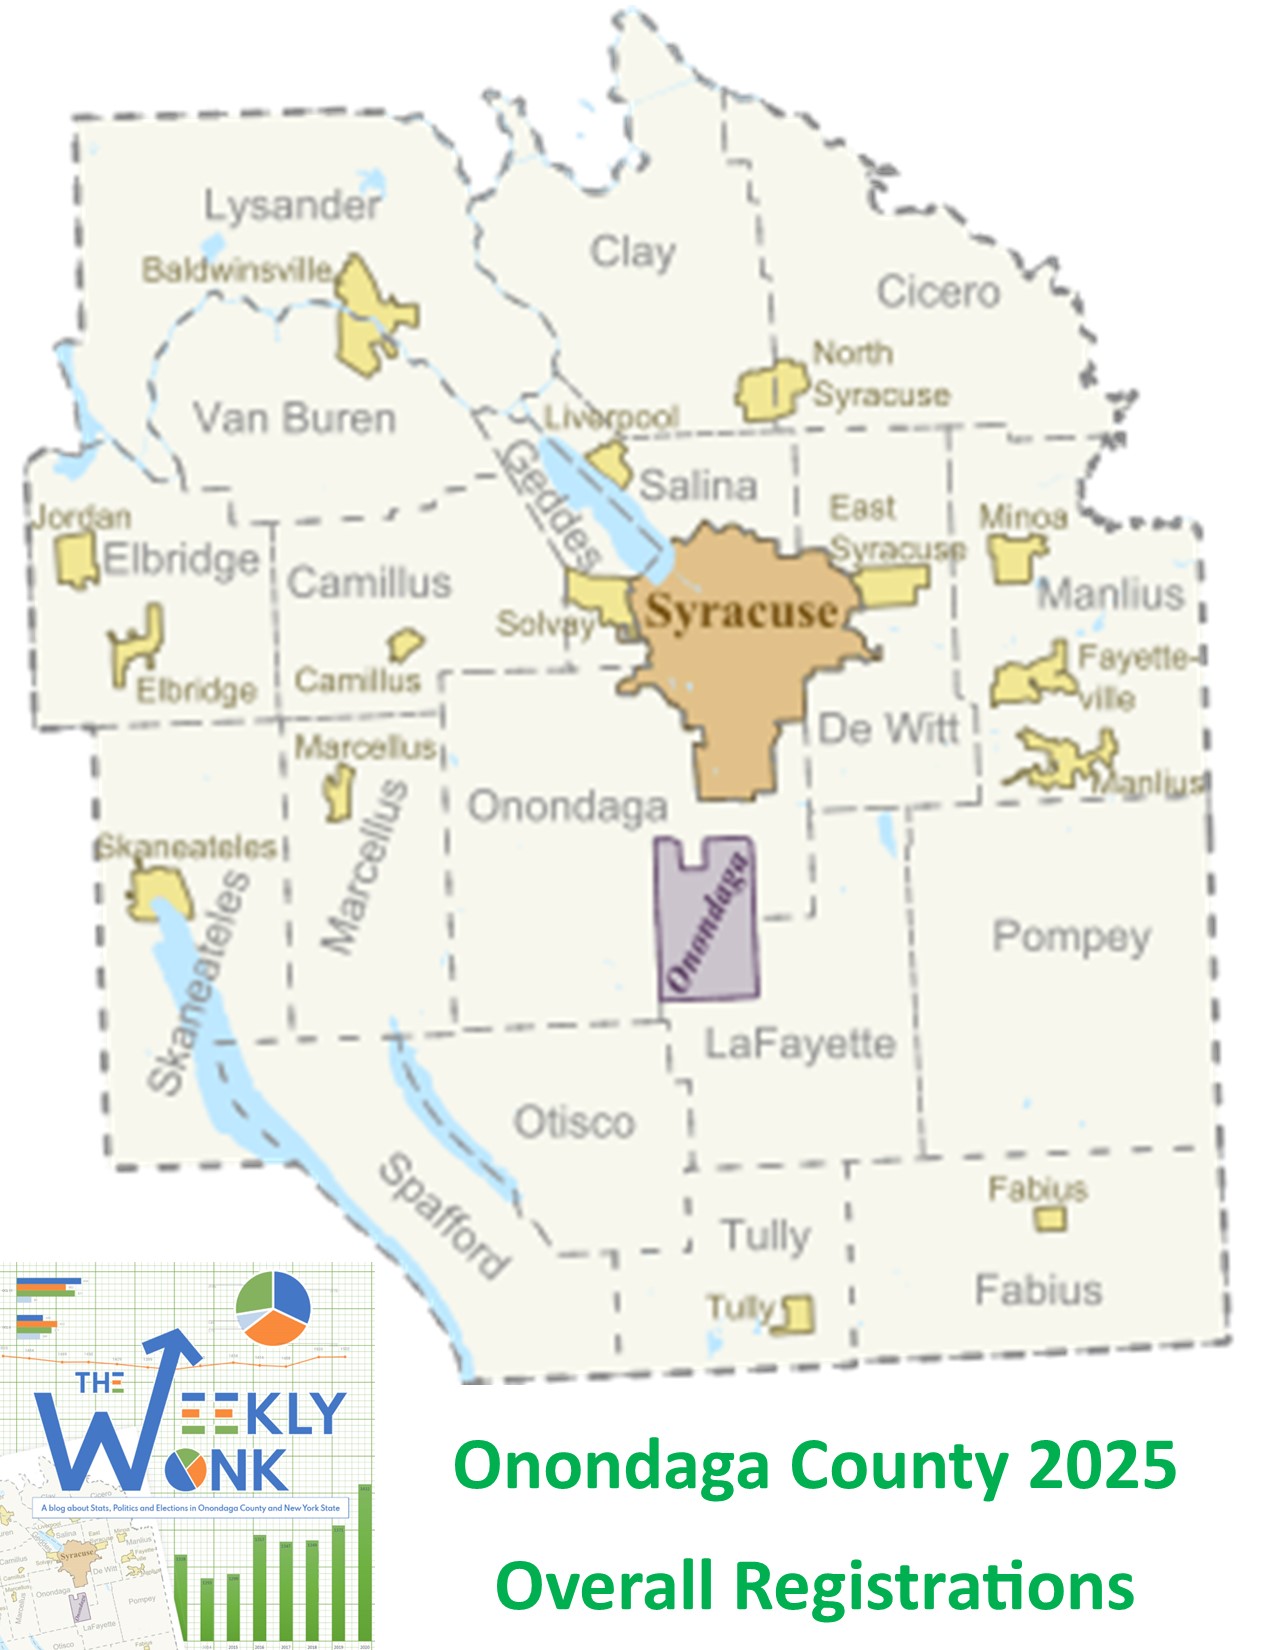
Welcome back to the #weeklywonk! Each week I take a deep dive in some form of electoral and registration data. By examining this data, I hope to give a more comprehensive view of our home, Onondaga County. This week I start looking at the political subdivisions having elections this November. We start with a top line view of Onondaga County as a whole.
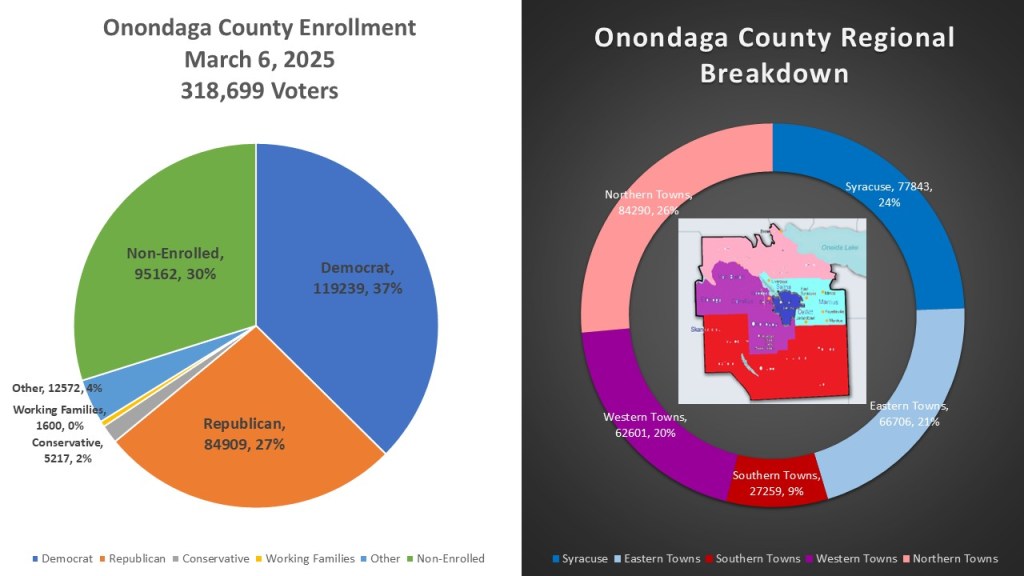
As of March 6, 2025, Onondaga County has 318,699 Active registered voters. 119,239 are Democrats (37%) and 84,909 are republican (27%). The non-enrolled portion is the 2nd highest voter type at 95,162 (30%). The rest of the county is divided between the conservatives (5,217 voters 2%), Working families (1,600 voters <1%) and the other category (12,572 4%). The county itself is broken up into 5 main sections. The Northern towns have the largest voter enrollment at 84,290 (26%). That is followed by the City of Syracuse at 77,843 voters (24%). The eastern towns make up 66,706 voters (21%). The western towns have 62,601 voters (20%). The largest land area of the county is the southern agrarian towns, but they have the smallest voter portion of just 27,259 (9%).
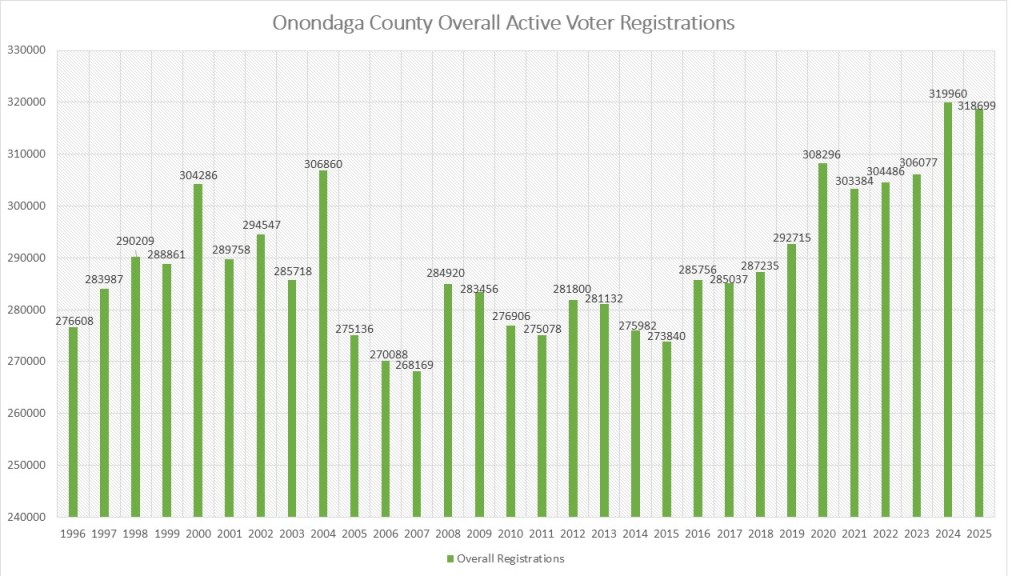
This graph measures the active voter population right before the general election of each year dating back to 1996. As you can see Onondaga County set a record in 2024 with 319,960 voters before last November’s General Election. This reflected a decent jump in registration as is normal in a Presidential election (+13,883). However, it paled in comparison to the jump we had in 2020 (+15,581) but was more than the jump in 2016 (+11,916). We have started to lose voters in 2025 because the new registrations are being outpaced by the deaths and voters being made inactive due to return mail.
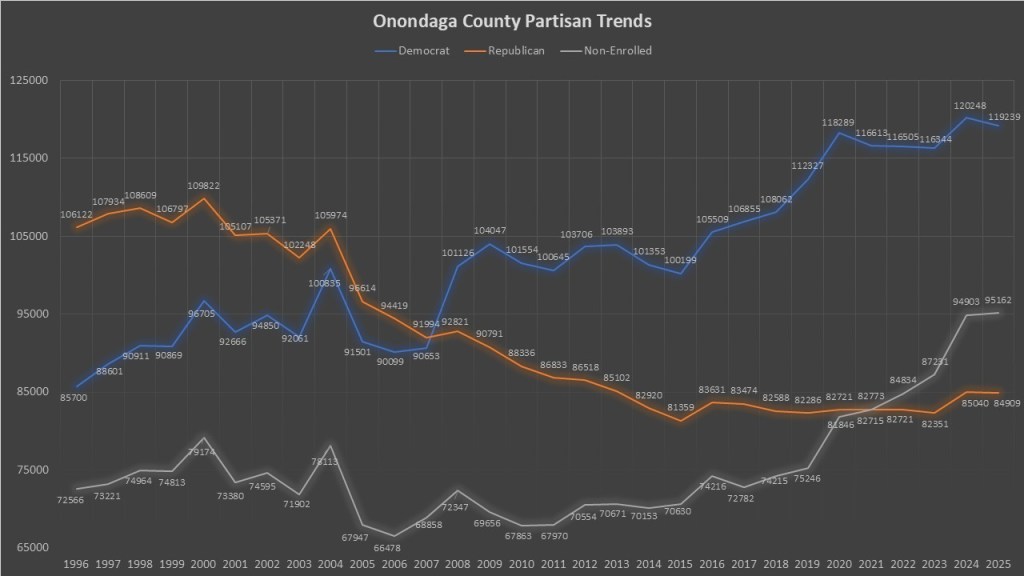
Democrats in Onondaga County continued to outpace the GOP but it’s the non-enrolled that is the biggest story. Going back to 1996 Democrats have added 33,539 voters while the GOP has lost 21,213 voters. The non-enrolled has only added 22,596 voters since 1996. However, if we look at the last four years, the story is different. The Democrats have added 950 voters, the GOP has added 2,188 voters, and the non-enrolled has added an outstanding 13,316 voters. This is a marked change from the previous four years during the first Trump presidency. We will see if this was the result of a democratic administration being in office or the start of a long-term trend. What is no doubt a major force in Onondaga County is the increasing share of non-enrolled voters.
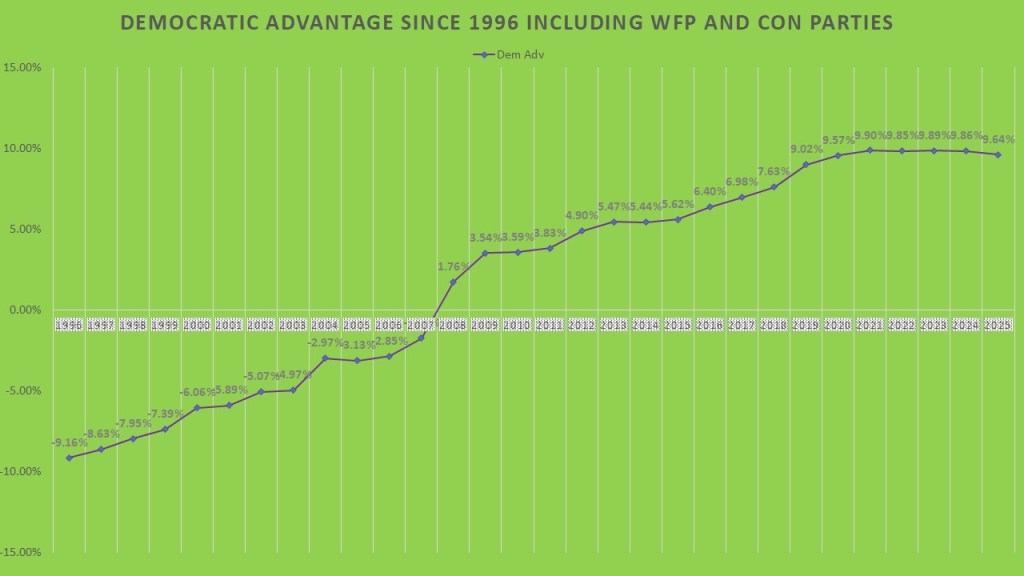
When looking at the Democratic advantage in Onondaga County in terms of overall registration you can not just look at raw numbers of democratic vs. republican. We have two other parties in New York, the Conservative and Working Families. These parties tend to align ideologically with the major parties. The Conservatives sit to the right of the GOP and generally support GOP candidates. The Working families sits to the left of the Democrats and generally support Democratic candidates. If you couple those together and compare them to the overall voters currently the Democrats have a +9.64% in March of 2025. However, despite the GOP faring better in overall registrations, the Democrats held a +9.86% in November of 2024, growing from +9.57% in November of 2020.
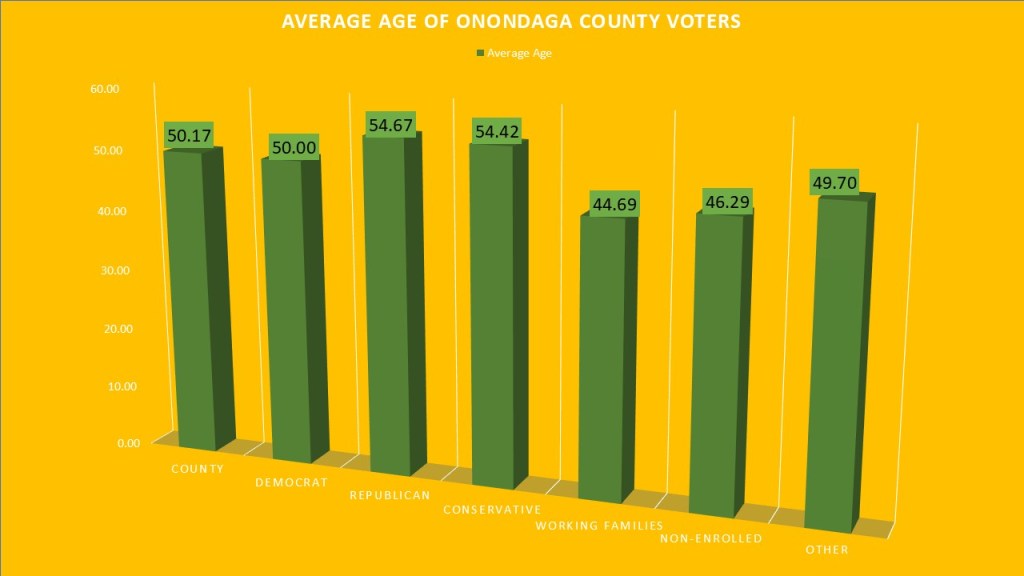
A new facet of analysis this year for me will be the average age of different voting populations inside a political subdivision. Our new registration system has some better features for me to do this analysis and I hope to put them to good use this next year. The average age of Onondaga County active voters is 50.17 years old. Democrats reflect the general makeup of the county with an average age of 50.00 years old. Republicans have the oldest average age at 54.67 years old followed closely by the conservatives at 54.42 years old. The Working families is the youngest age group at 44.69 years old. The non-enrolled population is slightly older at 46.29 years old. The other category is just under the county average at 49.70 years old. I hope to do a deeper dive on age statistics later this summer.
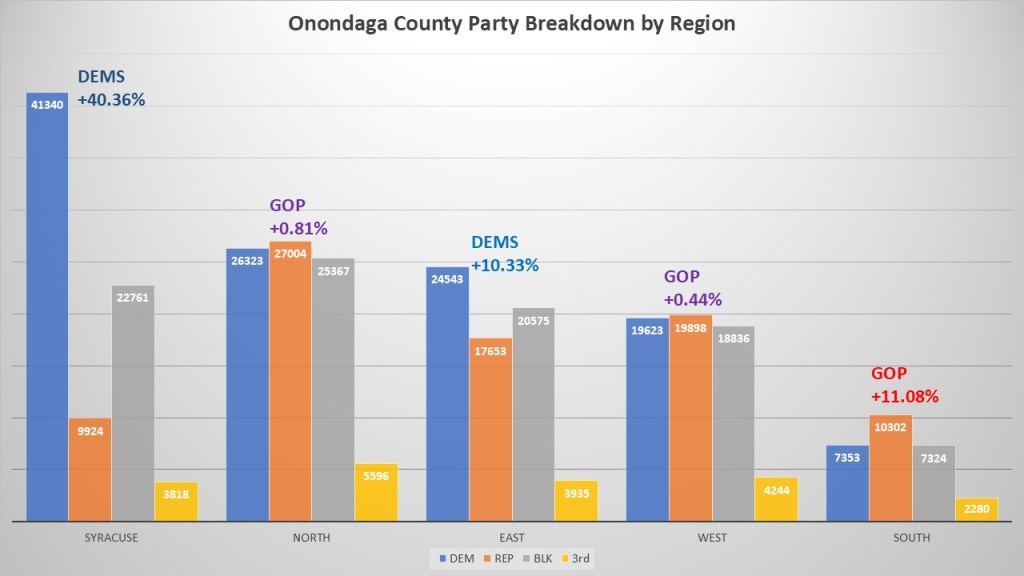
The five basic regions of the county reflect Onondaga County’s diverse but slightly blue nature. The City of Syracuse is overwhelming Democratic with Democrats owning a +40.36% registration advantage over the GOP. This followed by the eastern towns of Dewitt, Manlius, and Salina with Democrats having a +10.33%. The northern towns (cicero, Clay, & Lysander) have a collective borderline GOP lean (GOP +0.81%). The same can be said for the western towns of Camillus, Elbridge, Geddes, Onondaga, and Vanburen (GOP +0.44%). The only place where the GOP has a solid collective advantage is the southern towns of Fabius, Lafayette, Marcellus, Otisco, Pompey, Skaneateles, Spafford, & Tully (GOP +11.08%).
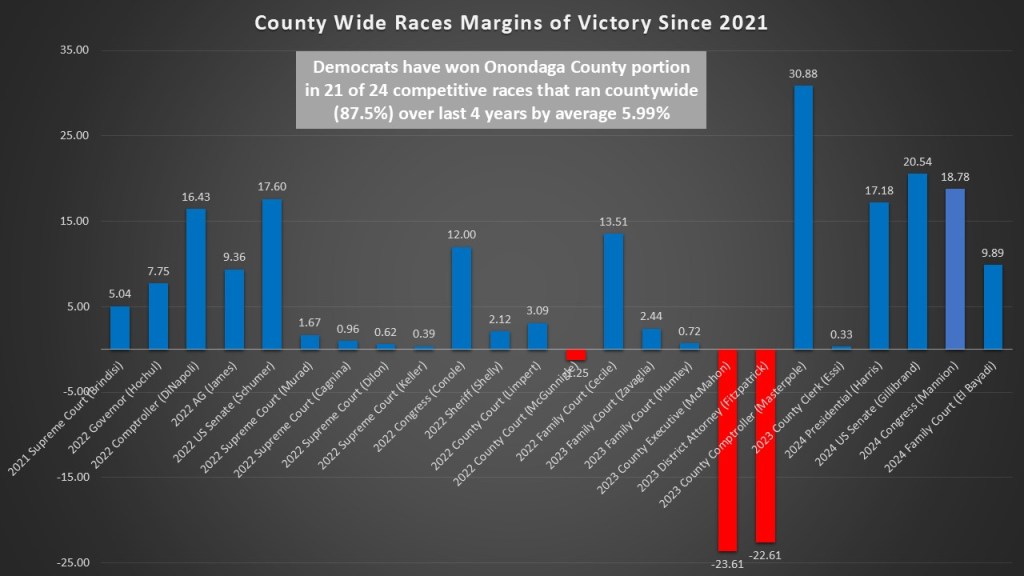
The overwhelming blue nature of Syracuse and solid blue nature of the eastern towns has outpaced the slight GOP leans of the other areas and has led to significant victories for Democrats on a county wide basis. Over the last 4 years there have been 24 competitive races that covered the entire county of Onondaga. These are races where both the Democrats and the GOP fielded candidates. The Democrats have won the Onondaga County portion of those races in 21 of those 24 contests. It should be noted the 2021 and 2022 supreme court races the Democrats won Onondaga County but went on to lose the races in the other counties. 2024 was a banner year for Democrats locally, most notably in congress. John Katko won Onondaga County by 1.52% in 2020. Fran Canole’s congressional campaign won Onondaga County by 12.00% even though he went on to lose the race. John Mannion not only won Onondaga County by 18.78%, but he also outpaced the Presidential ticket and went on to win NY22 propelled by his success here.
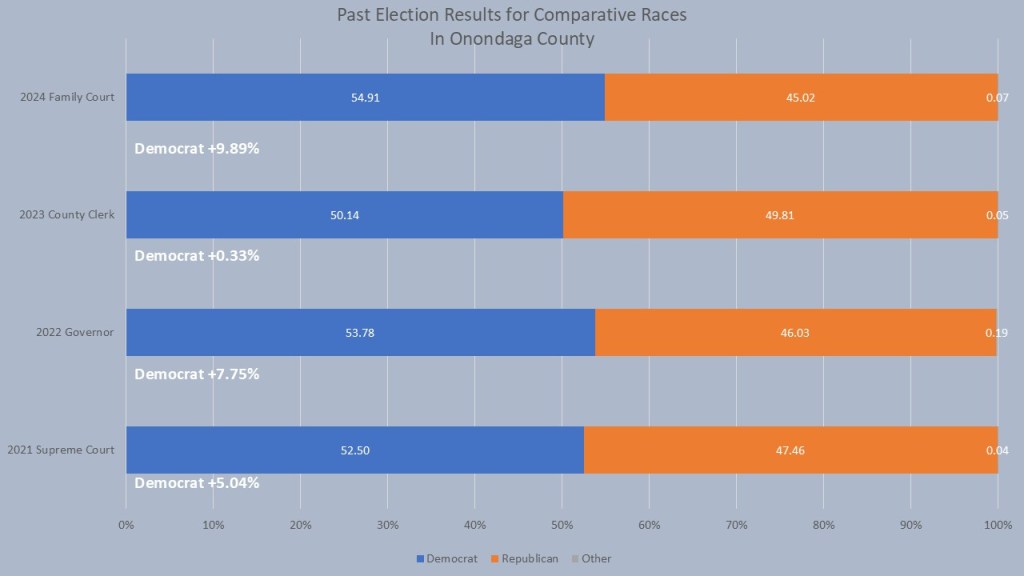
It’s a new year and I have a new set of comparative races that will give us some insight on a political subdivision’s voting habits. For each of the last four years I chose the countywide race that was the closest election in a one-on-one matchup countywide. In 2021 this was Anthony Brindisi’s unsuccessful Supreme Court run, in which he won Onondaga county portion by 5.04% but ultimately lost the race. In 2022 Governor Kathy Hochul won Onondaga County by 7.75%, which was higher than her statewide total but not by much. Emily Essi won the 2-23 County Clerk race in one of the closes county wide elections in Onondaga county history, winning by just .33%. Finally, Christina El-Bayadi won family Court in 2024 by 9.89%. These races in essence show the political leanings of a region based on general party preferences and can by a good gauge to whether a generic Democrat can be successful and under what conditions. We will come back to these in each #weeklywonk throughout the year.
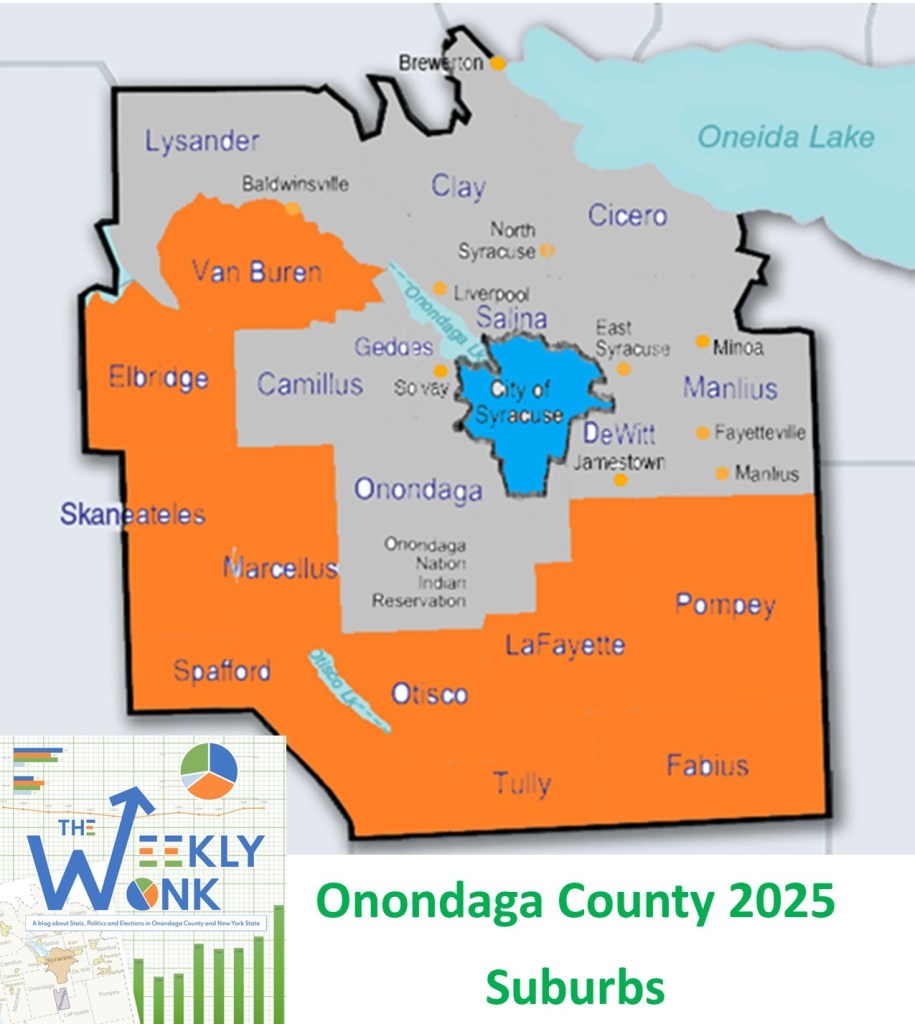
That is, it for this week’s edition of the #weeklywonk. In the next edition I will focus on the suburbs of Onondaga County as a whole. These unpredictable areas are the key to winning county wide for both Democrats and republicans. You can subscribe to dustinczarny.com for all content and election news updates.
