
Welcome back to the #weeklywonk. Each week I take a deep dive in some form of electoral and registration data. By examining this data, I hope to give a more comprehensive view of our home, Onondaga County. I am excited to bring you a fresh look at Onondaga County this week. For the first time I do a deep dive into Age and gender in Onondaga County.
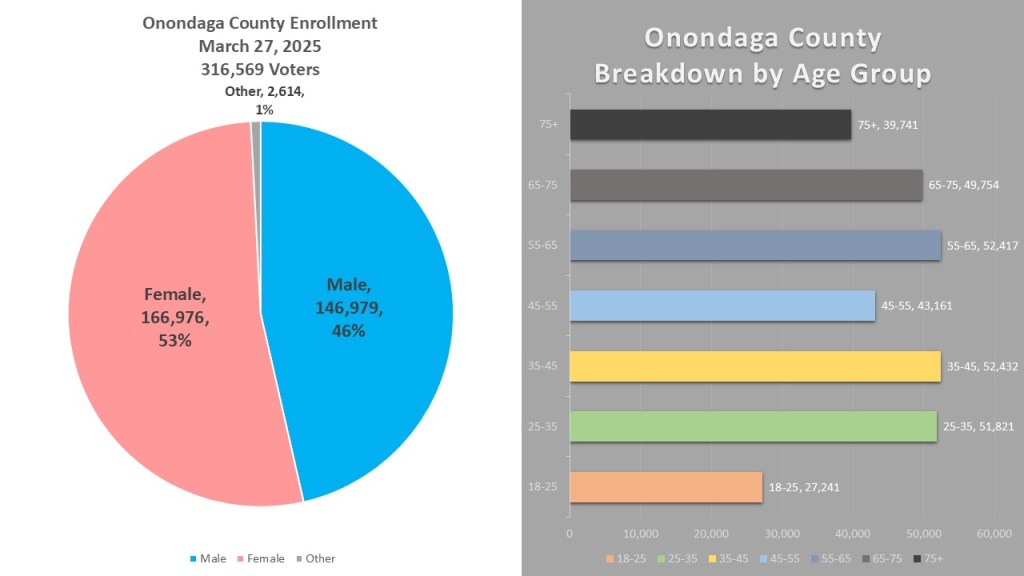
There are 316,569 voters in Onondaga County as of March 27, 2025. Of those 53% (166,976) identify as Female and 46% (146,979) identify as Male. Another 2,614 (1%) either refused to identify a sex, were unisex, or another option. We also breakdown Onondaga County into the standard age categories used to study population. The most populous age group is 35-45 with 52,432 voters. This is closely followed by 55-65 (52,417) & 25-35 (51,821), Dropping down a bit is 65-75 (49,754) then 75+ (39,741). In last place is the youngest demographic 18025 (27,241).

There is a stark divide in the partisan registrations among the gender. Democrats dominate the Female population with 71437 voters. The none-enrolled is second in the Female electorate with 46,950 voters. Gop comes in 3rd in the female electorate with 39,328 voters. The male population is a bit more even. First in the male population is non-enrolled at 46.199. This is followed in close second by Democrats at 45,935 voters. Third is the Gop at 44,926. The Other category is much smaller with 1,358 NE voters, 876 democrats, and 291 GOP.

When we look at partisan makeup by age group Democrats lead in just about every age group. As we progress through the age groups lead tends to shrink. The non-enrolled is in 1st place in the 18-25 age group by quite a bit, outpacing the Democrats and double up the GOP. As we progress through the age groups the NE influence lessens, and the GOP grows. Though the GOP does not lead in any age group it is 2nd place in the 55-65, 65-75, and 75+. The GOP comes closest to the Democrats in the 55-65 and 75+ group.
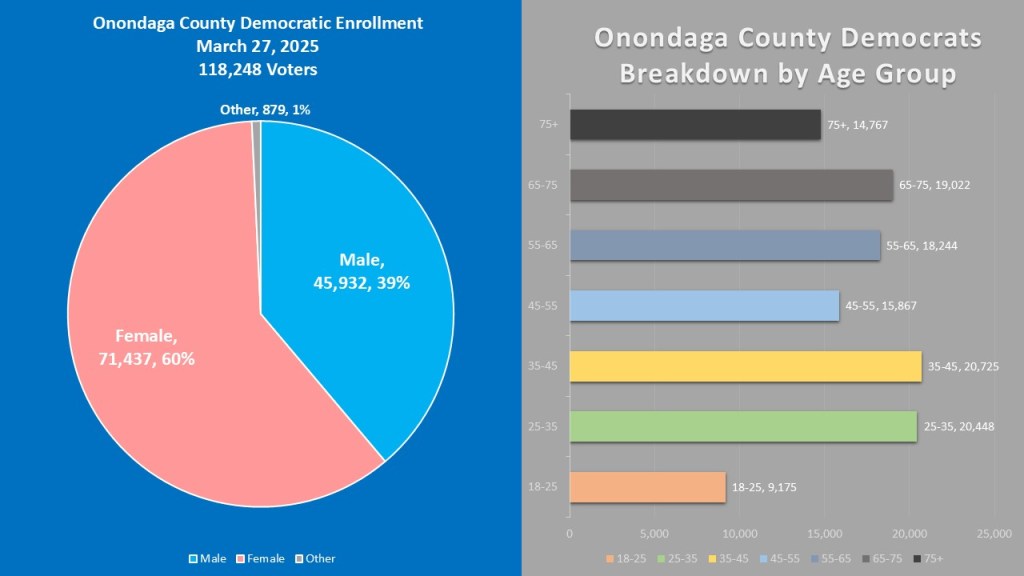
Looking at the Democratic electorate it is decidedly more female and younger than the overall Onondaga County electorate. There are 118,248 Democratic voters in Onondaga County. 60% (71,437) are female, 39% (45,932) are male., 1% (879) are other. When looking at the age groups that Democrats are most popular, the 35-45 is the most populous with 20,725 voters. This is followed by the 25-35 age group (20,448). The third largest is the 65-75 age group (19,022 voters). Most of this population resides between 25-55.
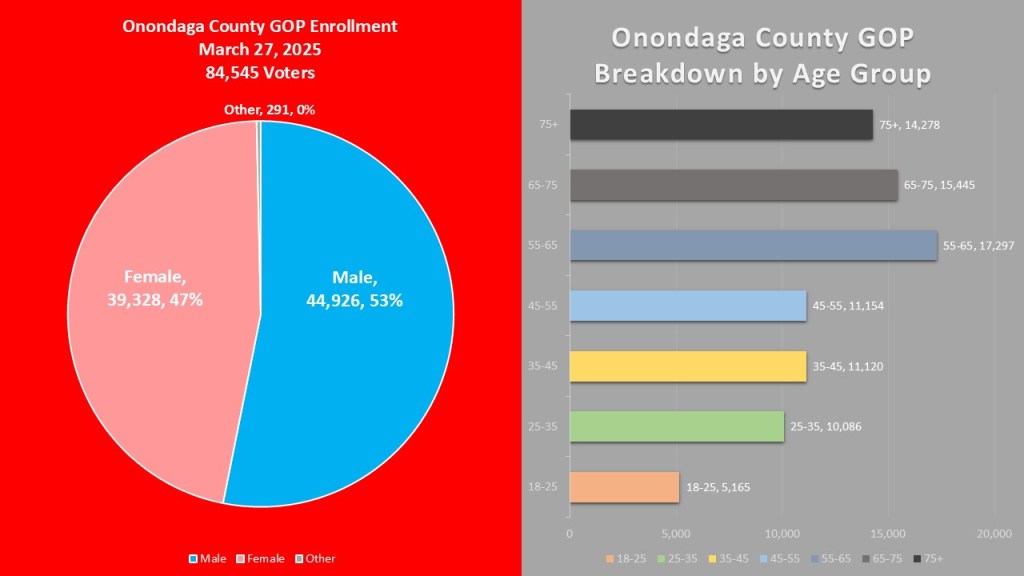
The GOP electorate is the opposite of the Democrats, more male than the county and older. There are 84,545 voters. 53% (44,926 voters) are male, 47% (39,328 voters) are female, and <1% (291) are other. The three oldest age groups are where the GOP mostly reside. 55-65 is the biggest group with 17,297. This is followed by 65-75 with 15,445. Finally, is 75+ at 14,278. Most of this population is 55+.

Lastly let’s examine the non-enrolled population. This is a balanced population and only slightly more make than Onondaga County as a whole, but significantly younger. There are 94,507 non-enrolled voters in Onondaga County. The highest plurality resides in the 25-35 with 18,421 voters. The second biggest group is 35-45 with 17,034 voters. The third biggest group is 55-65 with 13,142 voters. Most of this population is under 45 years old.

That is, it for this edition of the #weeklywonk. Next week I will return to the City of Syracuse to look at each of the 5 common council districts to get ready for the expected June primaries. I start on the northside with common council district 1. As always you can subscribe to dustinczarny.com for all content for election news and content update.
