Welcome back to the #WeeklyWonk. This is my weekly look at election related stats and demographic information that is important to Syracuse, Onondaga County, and New York State. I took a brief hiatus from this blog in 2025 but now that 2025 election is officially certified, along with manual recounts and write-ins, we can now take an official look back at the stats that made up the 2025 election. As we close out December, I will do this in three parts: Election Turnout, Election Methods, & The New Blue Onondaga. This week we dive into part 1: 2025 General Election turnout.
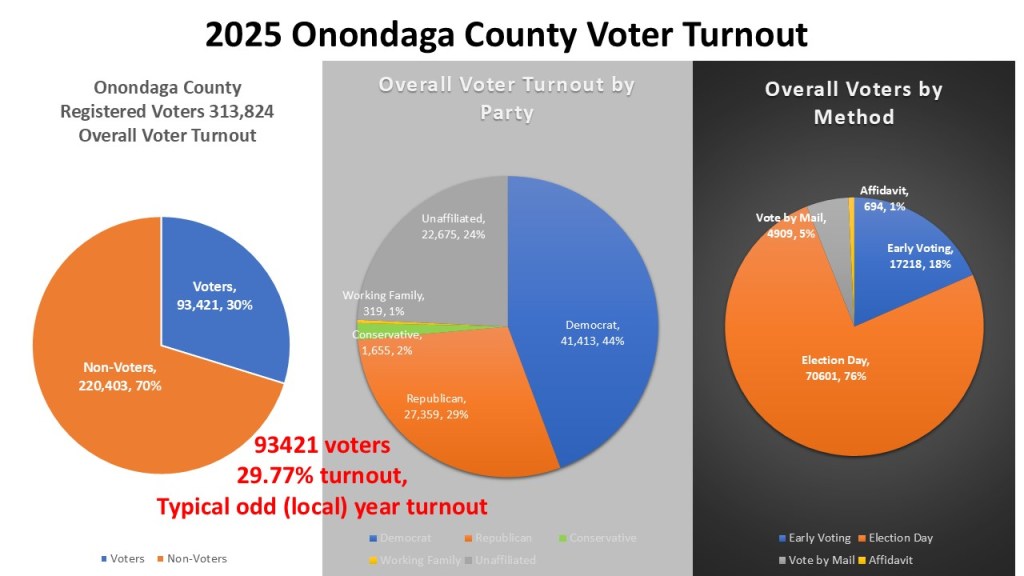
For the 2025 General Election Onondaga County had 313,824 registered voters. Of them 93,421 (30%) turnouts while 220,403 (70%) stayed home. Of those that turned out 41,413 (44%) were Democrat, 27,359 (29%) were Republican, 1,655 (2%) were Conservative, 319 (1%) were working families. Another 22,675 (24%) were Unaffiliated. Meaning either non-enrolled or enrolled in an unrecognized party. Also, of those who turned out 70,601 (76%) voted on Election Day, 17,218 (18%) voted Early In-Person, 499 Voted by Mail, and 694 voted by Affidavit (either on Election Day or during Early Voting). We will go more into voting next week. The official voter turnout percentage was 29.77%. On its surface this was a typical local (odd) year turnout like 2023 (29.64%) and 2021 (31.08%).

To get a true sense of what happened in 2025, we must look at party turnout. There are always way more Democrats enrolled than republicans in Onondaga County, in fact the GOP are behind the Unaffiliated voters. However, every year the Democrats fail to turnout in as high a percentage of their enrollment as the GOP and thus undercut their strength in numbers. This year though, for the first time since 2009 (where I have data back to) the Democrats turned out in higher number and Higher percentage. Democrats turned out 35.59% of their electorate (41,413/116,353). Republicans turned out at 32.587% (27,359/83.970). The Unaffiliated turnout percentage is always much lower than the two major parties despite their numbers with just 21.25% turnout (22,675/106.687).
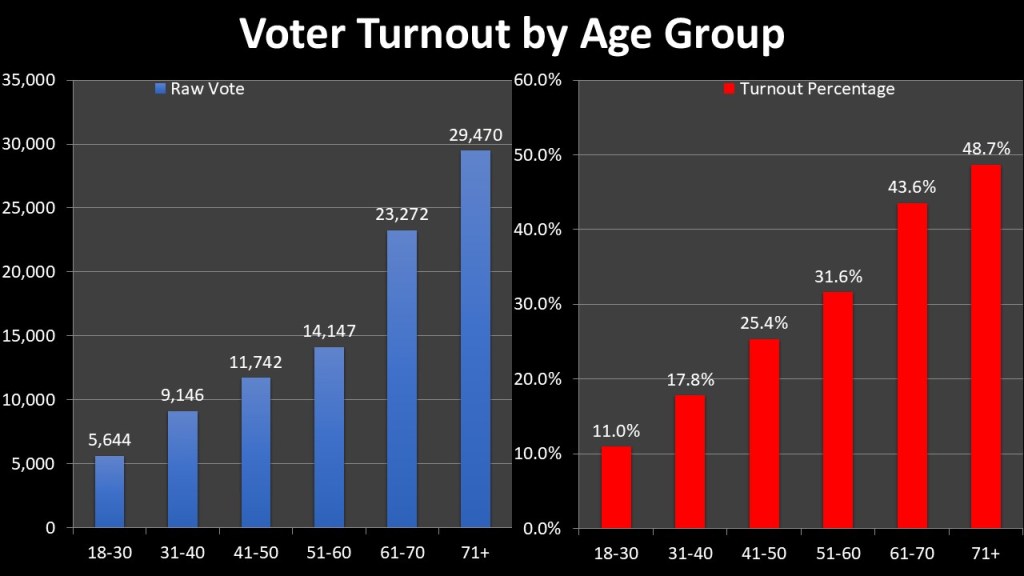
New year I wanted to look at voting age groups. To do so I broke Onondaga County into six distinct age ranges. As we can see this year, as every year, the age of the electorate is distinctively older. The older an age group, the higher in both raw numbers as well as the percentage of their registered numbers. 18-30 had 5,644 voters (11.0%), 31-40 9146 voters (17.8%), 41-50 11,742 (25.4%), 51-60 14,147 (31.6%), 61-70 23,272 (43.6%), 71+ 29,470 (48.7%). This means that 52,742 voters or 56.46% of the electorate that showed up was age 61+.
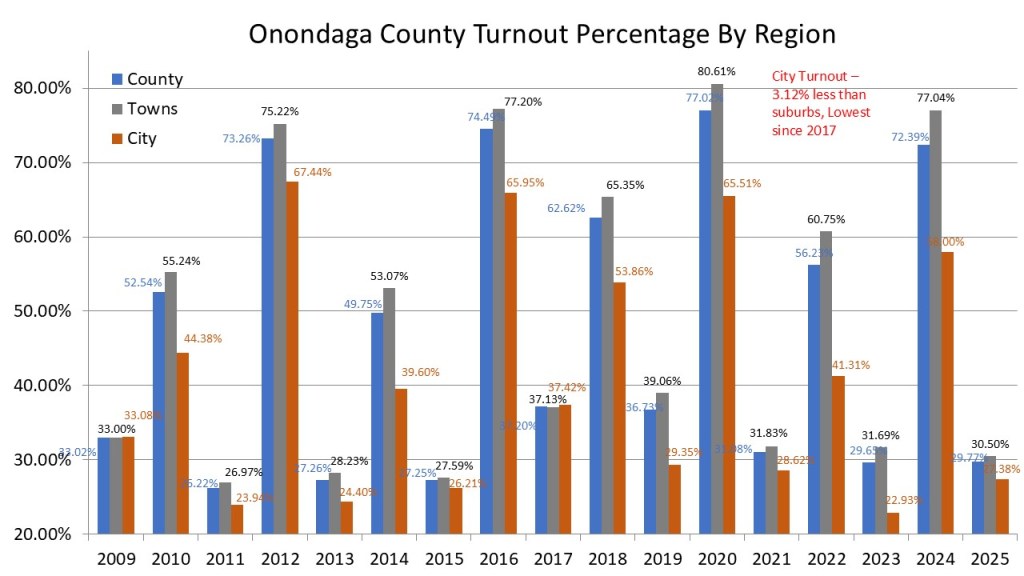
The next demographic to look at is regional turnout. Traditionally Onondaga County turnout into two distinct regions, The City of Syracuse and the Suburbs. The City of Syracuse, like with most urban centers, is usually a drag on voter turnout. The only year since 2009 that City of Syracuse turned out at a higher rate than the suburbs was in 2017, the last open mayoral contest. That is true this year as well but bnot be ,uch. Suburban turnout did outpace overall turnout at 30.50%, however the City turnout of 27.38% was only 3.12% behind the suburbs. This is the best City performance since 2017 and is due to the mayoral election generating turnout.
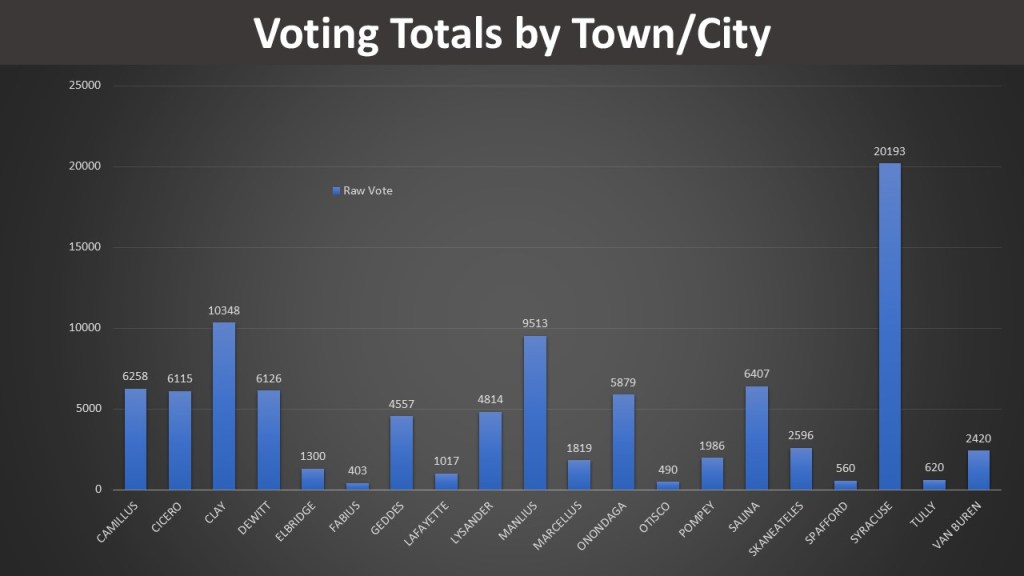
Even though the City of Syracuse trailed the suburbs in percentage of turnout, by sheer numbers they dominate raw number turnout. The 20,193 voters in the City of Syracuse is twice more than the #2 (Clay 10,348) and #3 (Manlius 9,513). We can see that Onondaga County has two class of suburban towns after that. Suburban moderate sized towns like Camillus, Cucero, Dewitt, Geddes, Lysander, Onondaga, & Salina which span from 4557 – 6407 voters. After that we have the smaller agrarian towns Elbridge, Fabius, Lafayette, Marcellus, Otisco, Pompey, Skaneateles, Spafford, Tully, and Van Buren spanning from 403 – 2,596 voters.
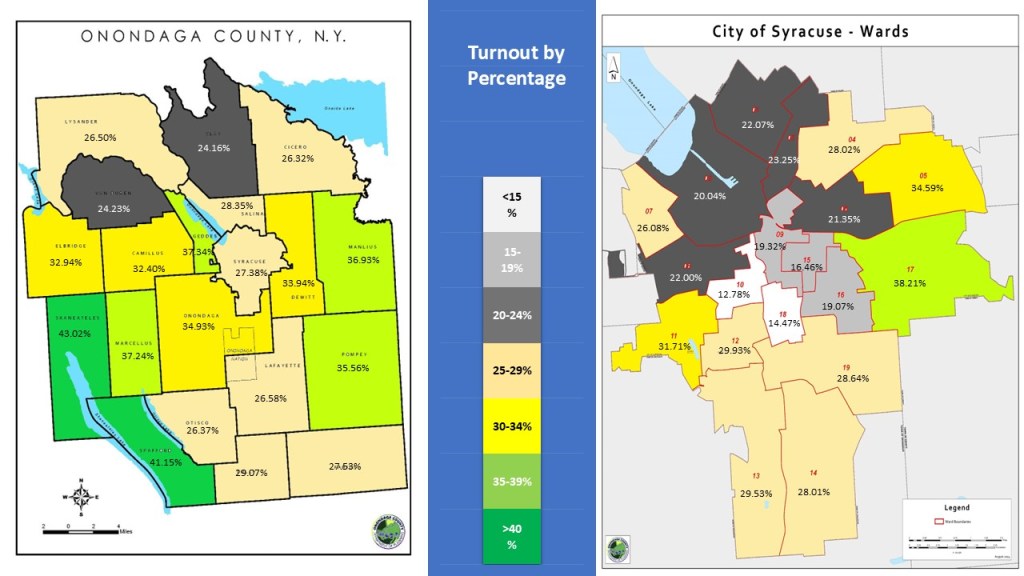
Further looking into the regional differences there is a stark difference to last yea’s performance. The City of Syracuse was so far behind the suburbs last year that there was not a ward inside the City that eqaled or surpassed any of the towns, not so this year The City of Syracuse (27.38%) had better turnout than 6 of the 17 towns such as Clay (24.16%), Cicero (26.32%), Lafayette (26.58%), Lysander (26.50%), Otisco (26.37%), & Van Buren (24.23%). In fact the 17th Ward of Syracuse (38.21%) was better than all but two towns. Other standouts beside are Strathmore (11 31.71%), and Eastwood (5 34.59%) areas. The king of this year’s turnout was the Town of Skaneateles (43.02%) followed closely by Spafford (41.15%).
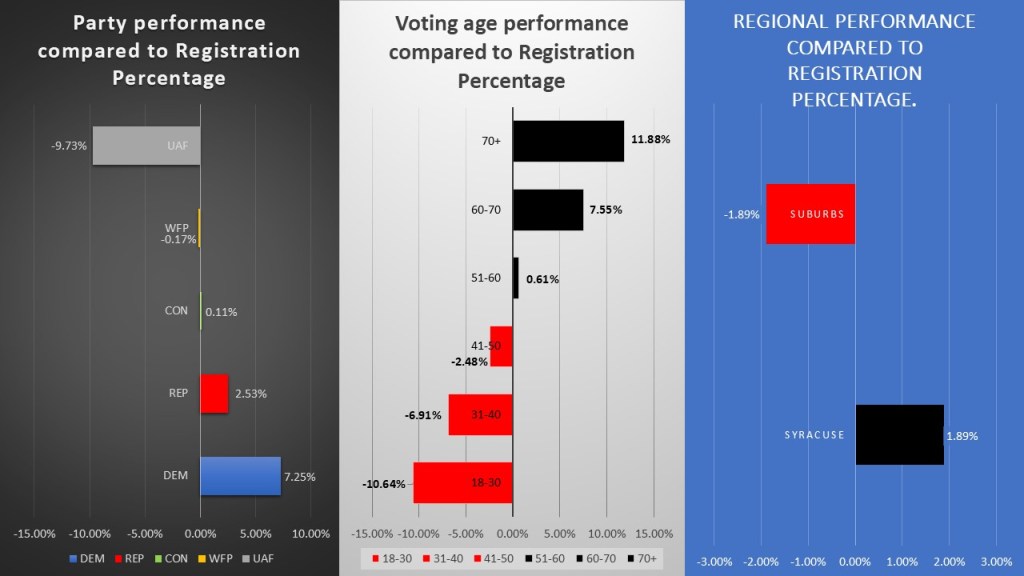
Finally, to get a true sense of these numbers we want to look at performance when compared to registration. Here we look at the percentage of turnout in the 2025 General Election when compared to a demographic registration in the overall electorate. This chart gives us a great final look at why this election turned out the way it did. We see that Democrats overperformed their registration by 7.25% which is part of why we saw the results we did last month. Unaffiliated voters severely underperformed their registration by 9.73%. Older voters 61-70 (+7.55%) and 71+ (+11.88%) truly outpaced younger voters 31-40 (-6.91%) and 18-30 (-1064%). The City of Syracuse because of its larger population overcame its turnout deficit and made up a slightly higher proportion of the electorate when compared to its registration. It is important to show these figures when politicians are making tough choices, they will remember who shows up more often than who does not. I hope switching to elections aligned with even years will help balance these numbers.

That is, it for this week’s edition of the Weekly Wonk. Next week I will look at part 2 of my series examining the 2025 General Election. We will look at the methods that voters in Onondaga County choose to vote for this year. As always follow along at dustinczarny.com to get all content and election news information as we get ready for the big midterm 2026 elections.
