It is time for another edition of the #weeklywonk. This is my weekly look at electoral and registration data in Onondaga County and New York. I am currently in the middle of a four-part series taking an overall look at our home Onondaga County heading into 2026. Part 1 Onondaga County Overall and Part 2 Onondaga County Suburbs can be found here (https://dustinczarny.com/weekly-wonk/) as well as all my now weekly episodes. This week I bring you part 3 in this series with a focus on the City of Syracuse which will elect an at-large member of the Common Council in 2026.
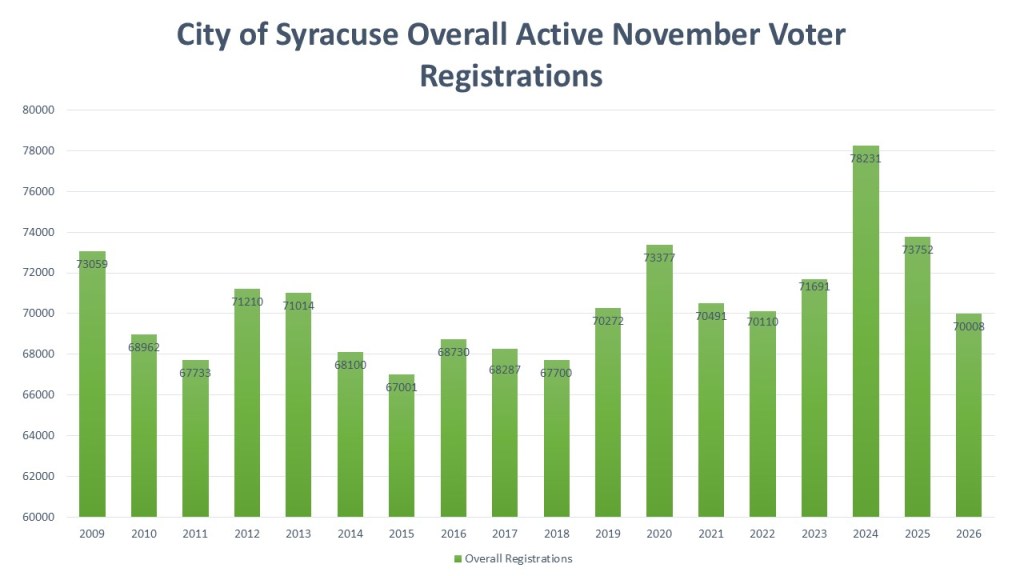
Unlike the county, the City of Syracuse voter population has remained stagnant. The Onondaga County Board of Elections only has enrollment data readily available going back to 2009. If we compare 2009 to 2025, which are both November collections in the year after the Presidential election, the difference is Syracuse has only grown by 693 voters. The city of Syracuse has behaved the same, large gains in a Presidential election, then large drop offs in between. The reason for that is obvious, Syracuse University. Younger college voters tend to register in the Presidential years and then leave the area after graduation resulting in a fall off voters.
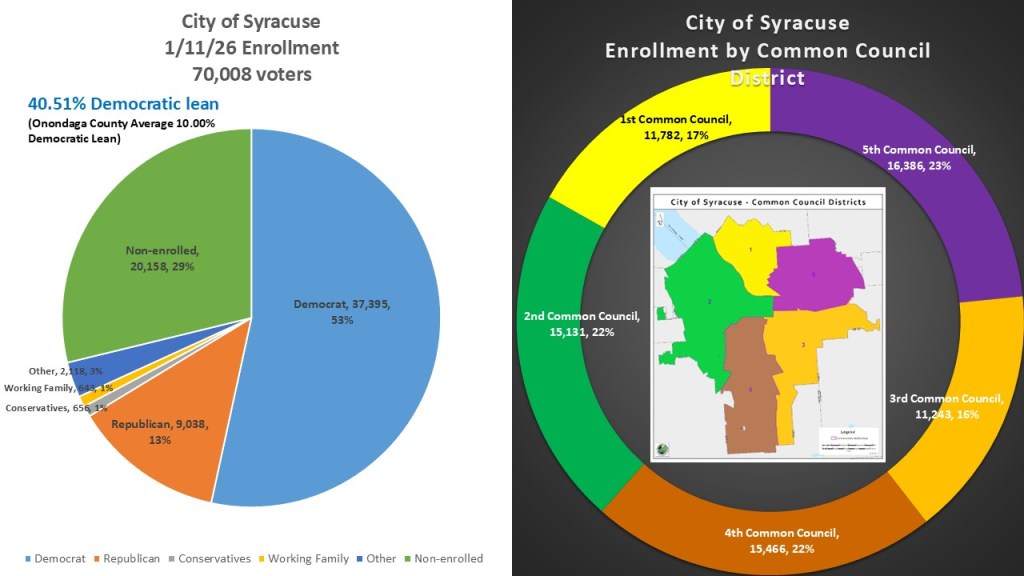
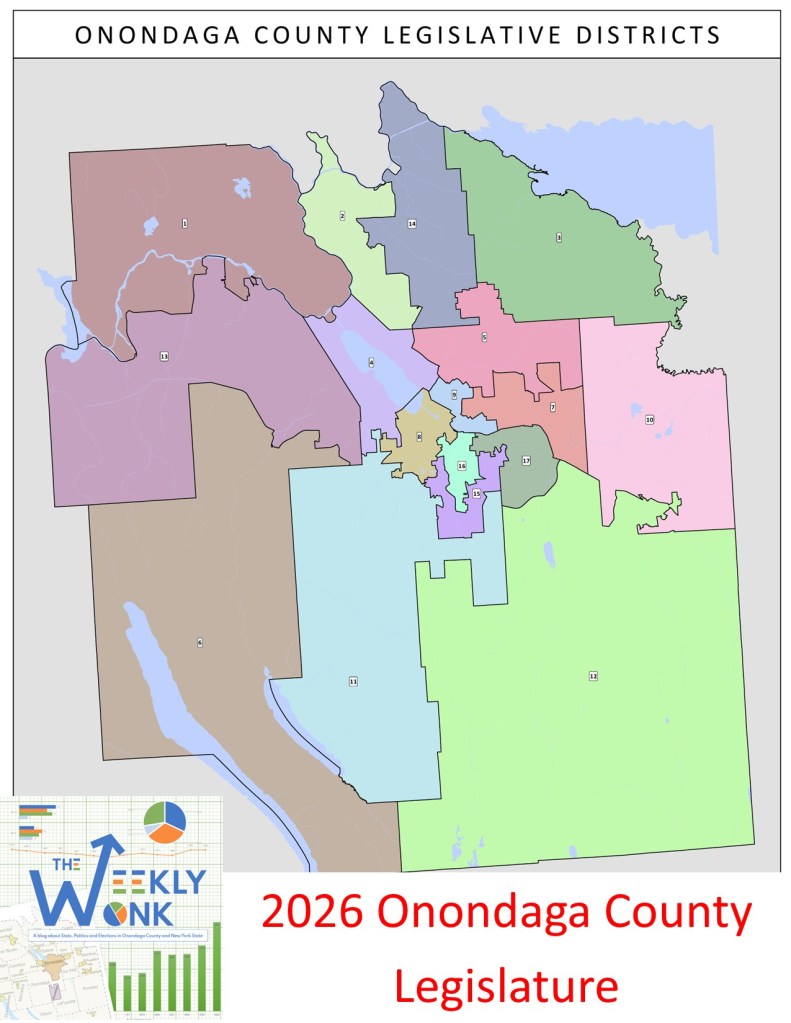
According to registration data pulled on January 11, 2026, the City of Syracuse currently has 70,008 voters. 37,395 (53%) are Democratic, giving Democrats a rare straight majority. The non-enrolled are second with 20,158 voters (29%) and the Republicans are a distant third with just 9,038 voters (13%). Democrats have a whopping 40.51% advantage in the City of Syracuse. The City of Syracuse has 5 Common Council districts drawn by the Citizen led independent redistricting board in 2022. District lines are drawn based on the number of residents, not on how many people are registered to vote. So, this leads to a substantial change in registered voters. The 3rd Common Council District on the east side is the lowest registered voters with 11,243 (16%) mainly because of Syracuse University and Lemoyne College being inside its borders. Up next is the first common council district with just 11,782 (17%) on the northside, known for a large refugee non-citizen community. The west side second common Council (15,131 22%), inner city and vallfourth4th common council (15,466 22%), and Eastwood based 5th Common Council (16,386 23%) are close together at the top.

The story of the City of Syracuse is not so much Democratic dominance, but the rising tide of the non-enrolled. Democrats are the majority party but have remained stagnate since the watershed election of 2016 losing 540 voters. The Republicans on the other hand have lost over twice as many with 1213 less voters. This is especially troubling considering how much of a deficit they had to begin with. In many ways 2016 signaled the beginning of this non-enrolled wave we are seeing, especially in the city. The non-enrolled have grown by 3,993 voters since 2016. We can see why Ben Walsh had a path to victory in 2017 and 2021 despite not being a Democrat. We also see why Sharon Owens his former deputy mayor was able to win so largely as she was able to bring his strength with non-enrolled and add her party affiliation of Democrat to the mix.

No matter which commo council district you pick, the Democrats dominate every corner to varying degrees of intensity. The most democratic in terms of percentage is the east side third common council district with the mighty 17th ward anchoring a +52.90% partisan gain for Democrats. However, the inner city/valley 4th Common Council district (+50.89%), West side 2nd Common Council (+360.40%) and Eastwood based fifth common council (+34.28%) have statistically more Democrats. The least Democratic district is the north side first which has +28.99% democratic lean. In all five districts Democrats had significant advantage doubling, tripling, and even sextupling them. IN every district the non-enrolled more than doubled the GOP as well.
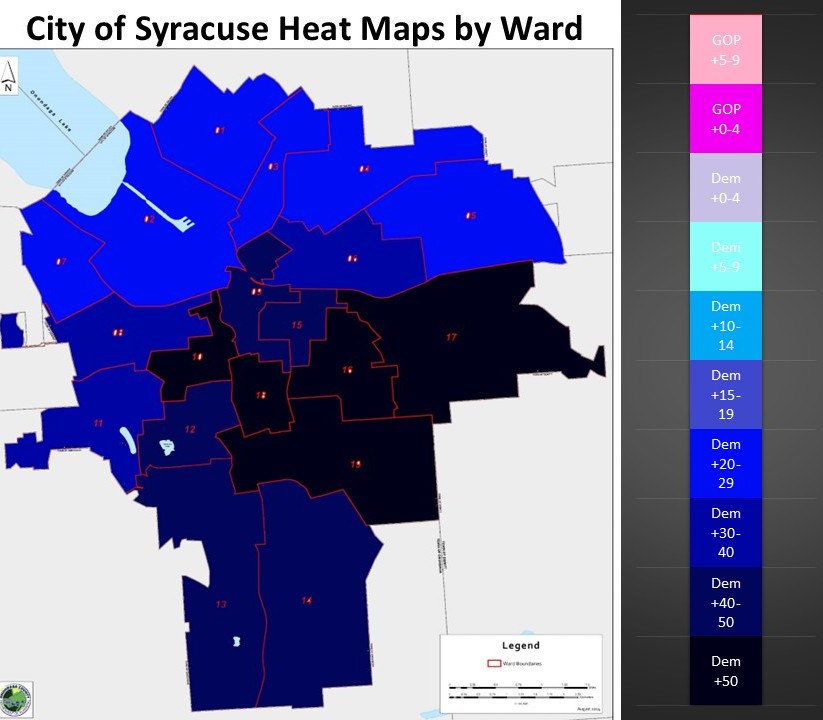
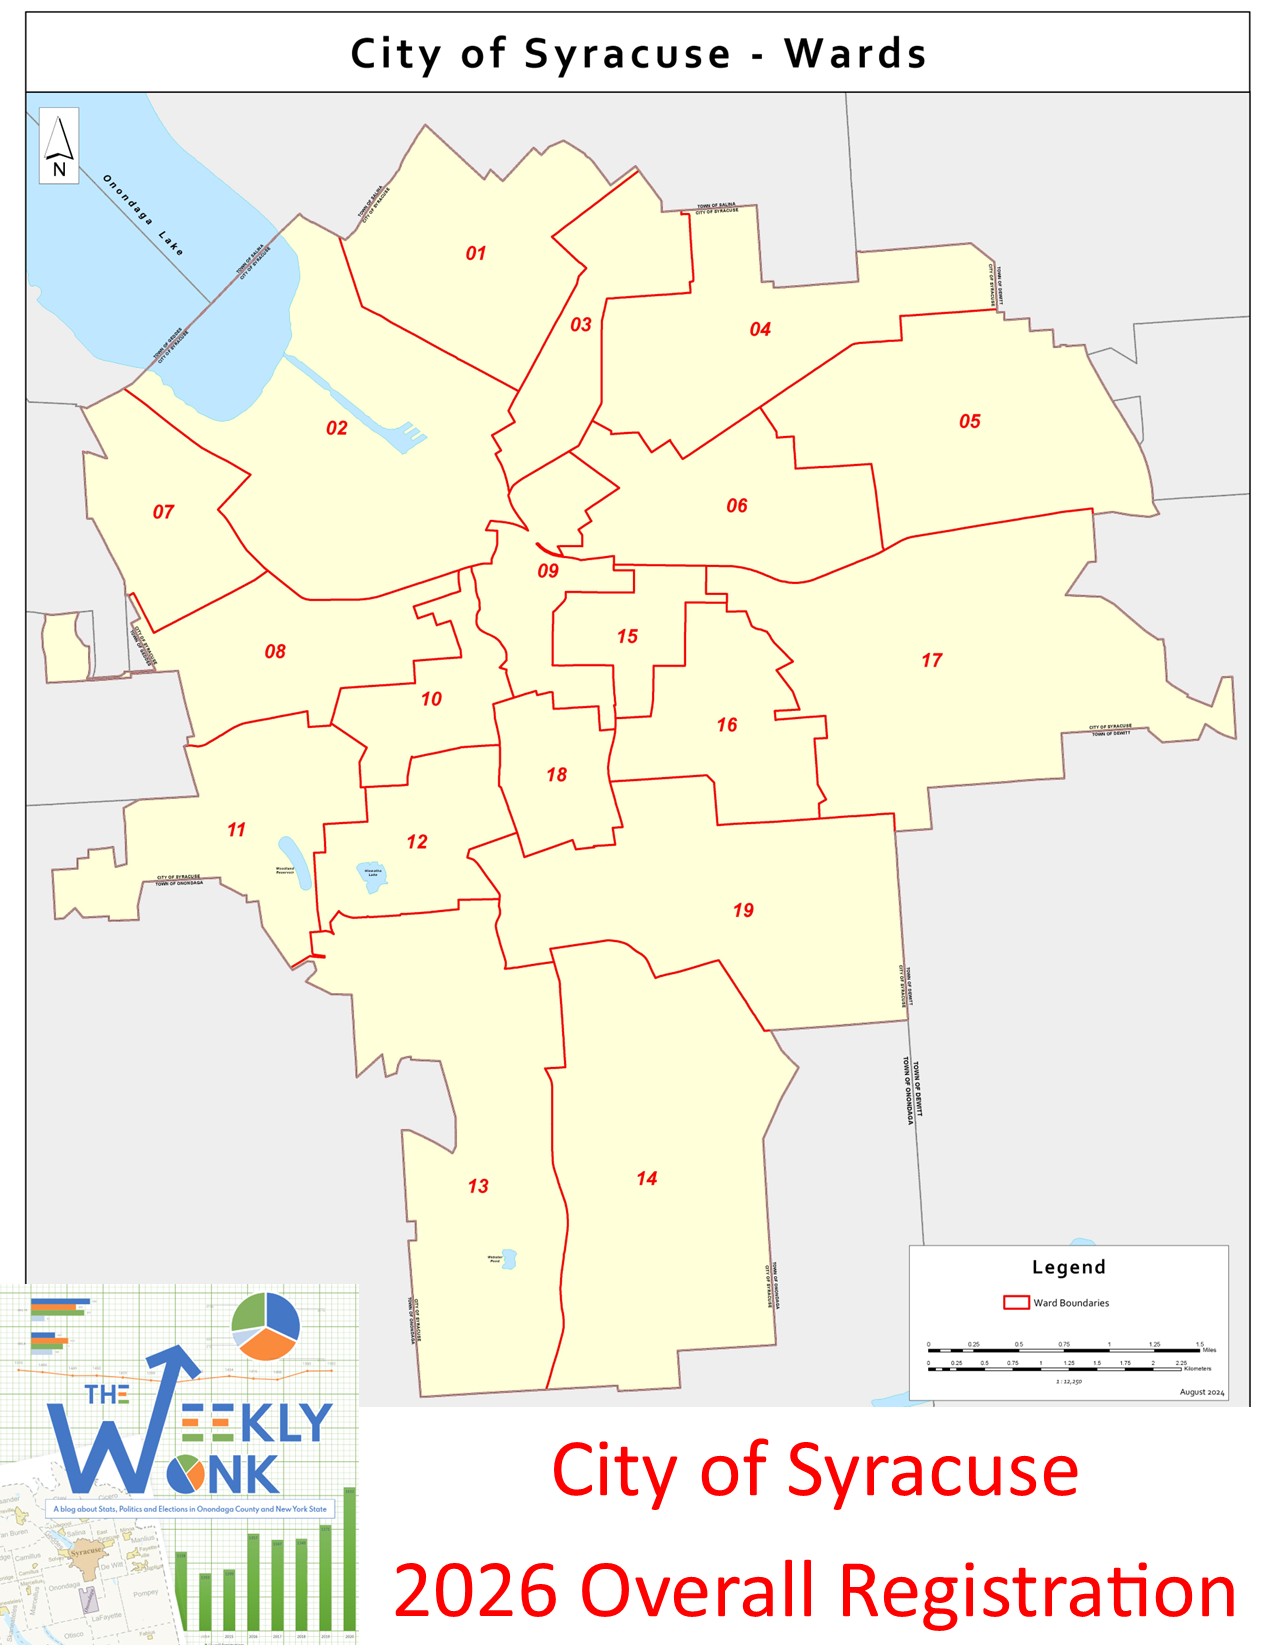
We can see this dominance by the Democrats reflected on the heat map. For this map I wanted to look at the individual words of the City of Syracuse. The sizes of these nineteen wards differ, as their boundaries were established when the city expanded and incorporated what were once farming communities. I had to amplify my normal heat map as there was not one word in the city that was not in the highest category I used to look at other parts of the county. Wards 1, 2, 3, 4, 5, & 7 are in the 2029% Democratic advantage range. Wards 6,8, & eleven are next in the 30-39% range. Wards 9, 12, 13, 14, & 15 are in the 4049% Democratic range. The most Democratic wards ate10, 16, 17, 18, & 19 in over 50% Democratic range.
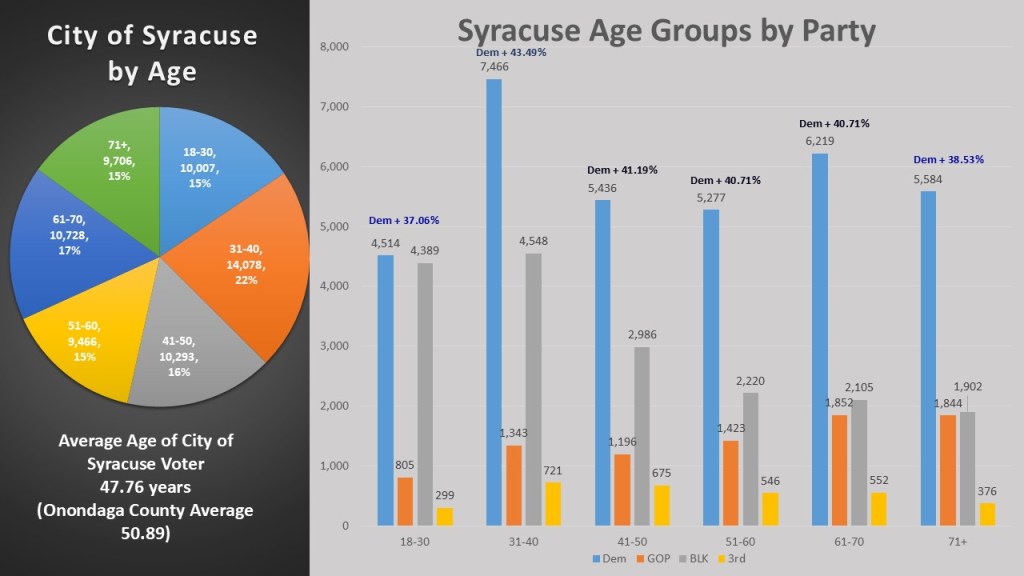
I decided this year to try and do some analysis of age when it comes to voting Demographics. The average age of the City of Syracuse voters is 47.76 years. This is significantly down from Onondaga County Average of 50.89 years. When we look at the age block the age range of 31-40 is significantly larger (14,078 22%) than the rest of the age groups, so it is not just university students bringing down the average age. Not only is it younger it is way more Democratic in every age group. Across the county as a whole and in the suburbs, non-enrolled individuals make up the largest group among the youngest age brackets. However, within the city, Democrats have the highest numbers in all age groups—including those aged 18 to 30. We also see the non-enrolled outnumber the GOP in every age group whereas the Gop performed better in the 51+ in the suburbs and county.

All this registration data eventually leads us to the performance of the city, which has been predominately and overwhelmingly Democratic. The City of Syracuse had a city-wide election I could compare to in 2025, the Syracuse mayoral race. Here we saw Sharon Owens have one of the more lopsided victories any Democrat has ever had in the city with an over 55% victory over her Gop opponent. In our comparative races it is consistent that a Democrat will get between 72 and 77% of the vote coming out of the city. John Mannion in 2024 Congressional race got the largest share in our comparisons with 76.93% of the vote. Emily Bersani in the county clerk race in 2023 got the lowest share of 72.50% but also had one of the closest races in Onondaga County history. Her overperformance in the city from her county wide totals of +22.36% led to her victory in that low turnout year.
That is, it is for this week’s edition of the #weeklywonk. Nest week I wrap up my four-part series looking at Onondaga County heading into 2026 with an overview of the County Legislature which will hold election in even years for the first time in NY State history. Then after that I will start looking individually at the towns in Onondaga County. As always you can subscribe to dustinczarny.com for all content and election news updates.

2 thoughts on “The Weekly Wonk: The City of Syracuse 2026”