Welcome back to the #weeklywonk. This is my weekly article on electoral and registration data that I host on dustinczarny.com. This series is meant as an informational article for voters and candidates wanting to learn more about our home Onondaga county and the State of New York. Today I start my 6-part series focusing on the towns that will be filling potential Democratic candidates by designating petitions. Today we focus on the Town of Elbridge, a deep red town that I have not explored in this series since 2021. The town of Elbridge will have a single Town Justice seat up in 2025.
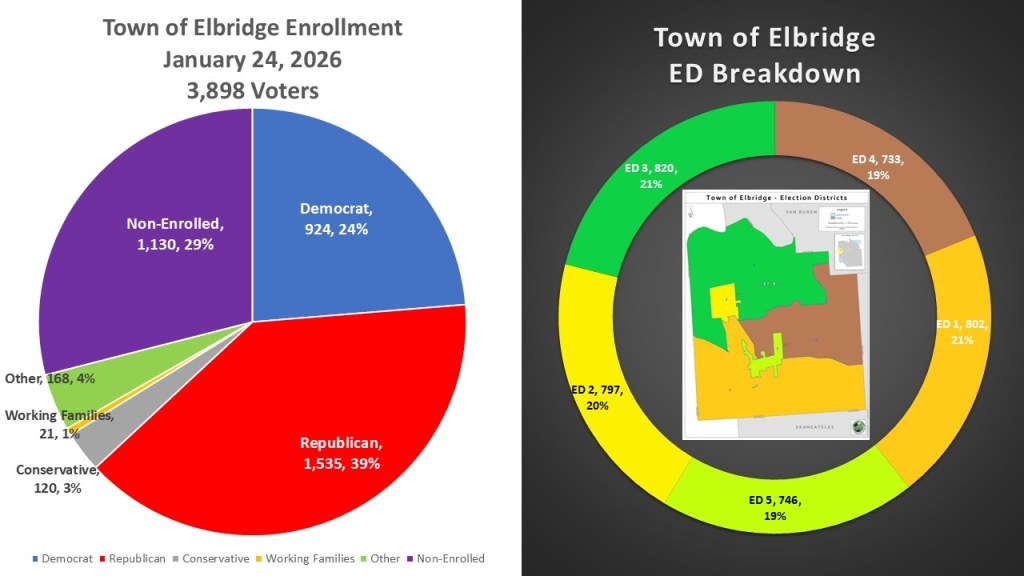
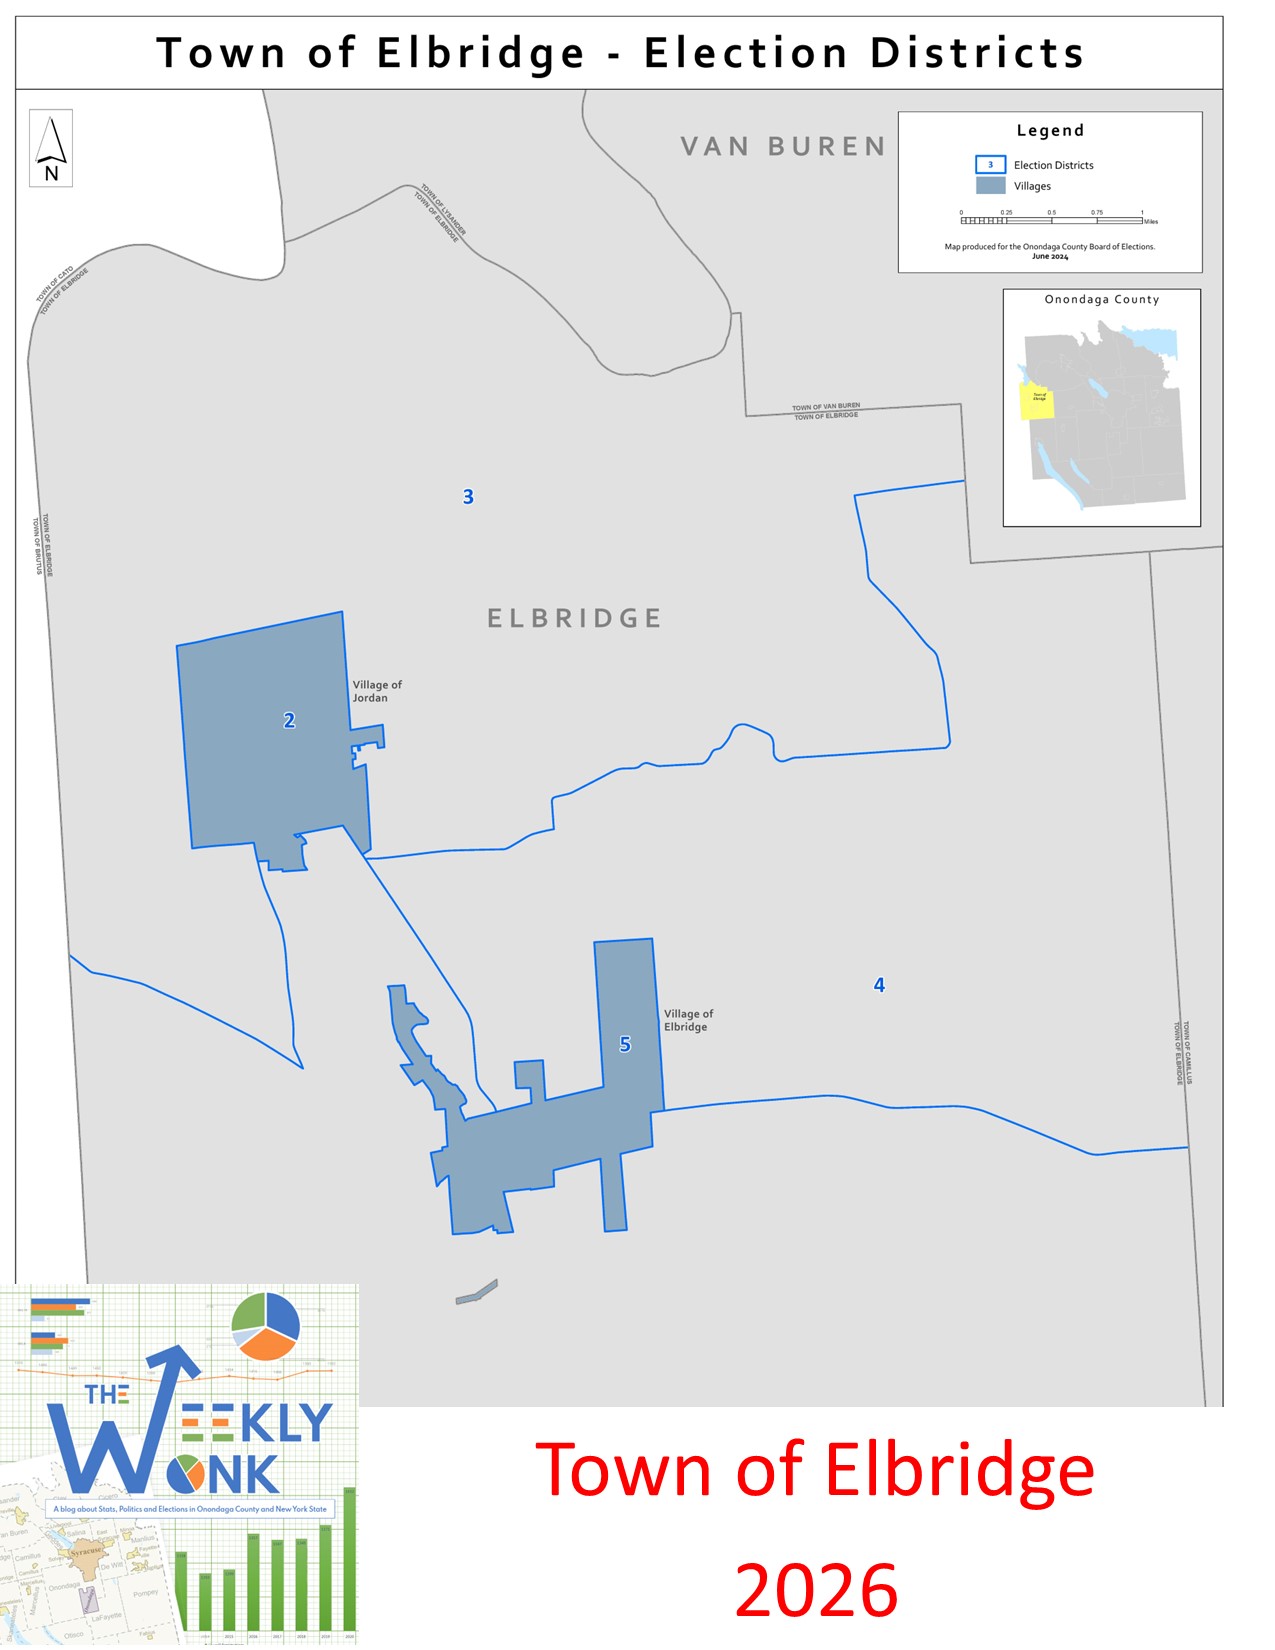
The Town of Elbridge is one of the smaller rural towns in the western part of Onondaga County. The Republicans have a solid plurality in this town at 1,535 voters (39%). The non-enrolled are second with 1,130 voters (29%). The Democrats are a distant third at 924 voters (24%), There are 168 voters (4%) enrolled in various other parties, 120 (3%) in the Conservative party, and 21 (1%) working family’s voters. There are five election districts in Elbridge, all equal in number of registered voters. Two election districts represent the two villages in Elbridge, the village of Jordan (ED 2) and the village of Elbridge (ED 5).
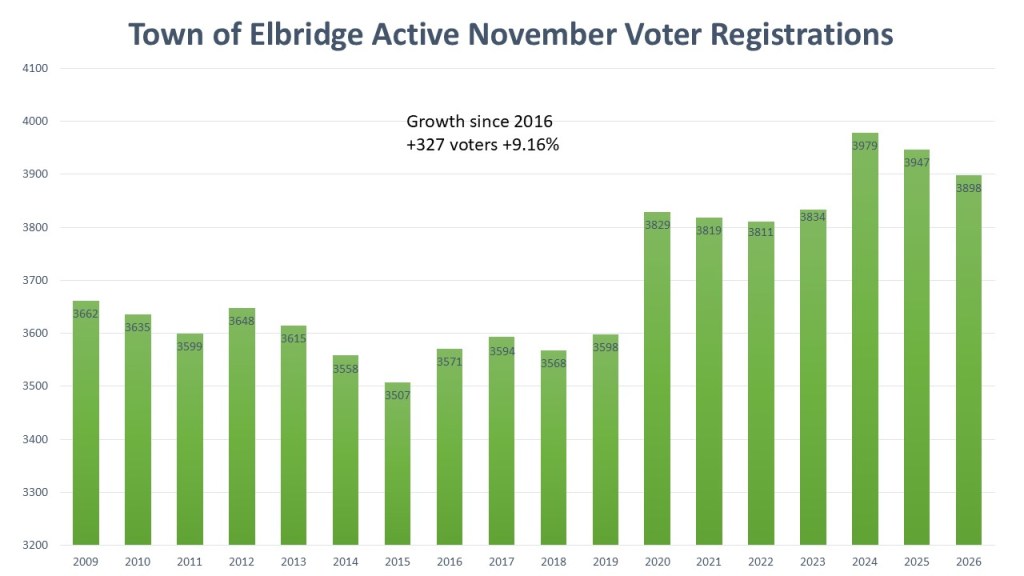
The voter population in the Town of Elbridge has experienced an increase. Like the county overall, the growth is substantial after the Democratic takeover of New York State government in 2018. Online Voter registration, DMV online registration, a statewide voter registration database, and 10-day constitutional minimum have combined to allow more people to get on and stay on the voter rolls. Thise year I am going back to the 12016 election which is a sea change in modern elections and ten years ago for comparisons. During this time Elbridge added 327 voters, a growth of 9.16%.
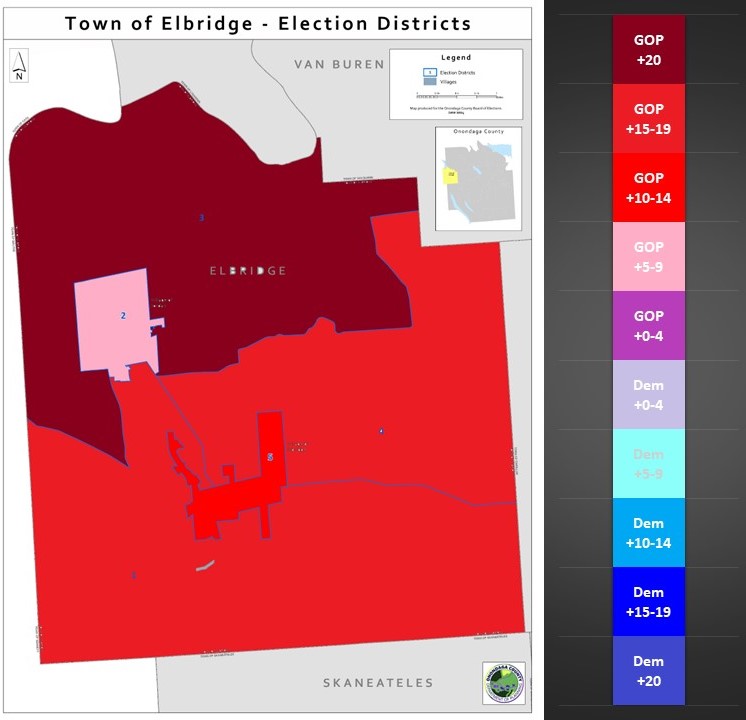
Looking at the heat map of the five election districts in the Town of Elbridge we see that all of them are well into the GOP range of the map. The Village of Jordan (ED 2) leans GOP (GOP +5-9%). The Village of Elbridge (ED 5) is a moderate GOP lean (10-14%). The southern eds one & four are strong GOP leans (+15-19%). Finally, ED 4 in the north is an overwhelming GOP lean (+20% or more).
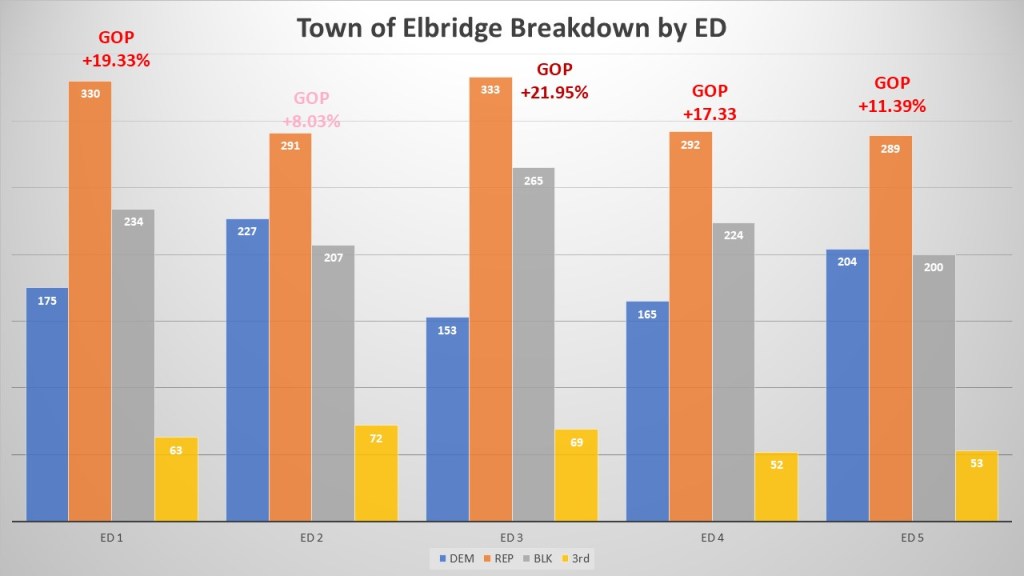
Diving into the ED themselves we see a bleak prospect for Democrats. Only the villages (Ed 2 Jordan and ED 5 Elbridge) are Democrats in second place outnumbering the non-enrolled, barely. All three other EDs fall into third place. A political party faces a significant disadvantage within a political subdivision when non-enrolled individuals outnumber its members. This highlights the Democrats only real hope of winning in Elbridge is to have heavy turnout in the villages as well as a large advantage in the non-enrolled population everywhere.
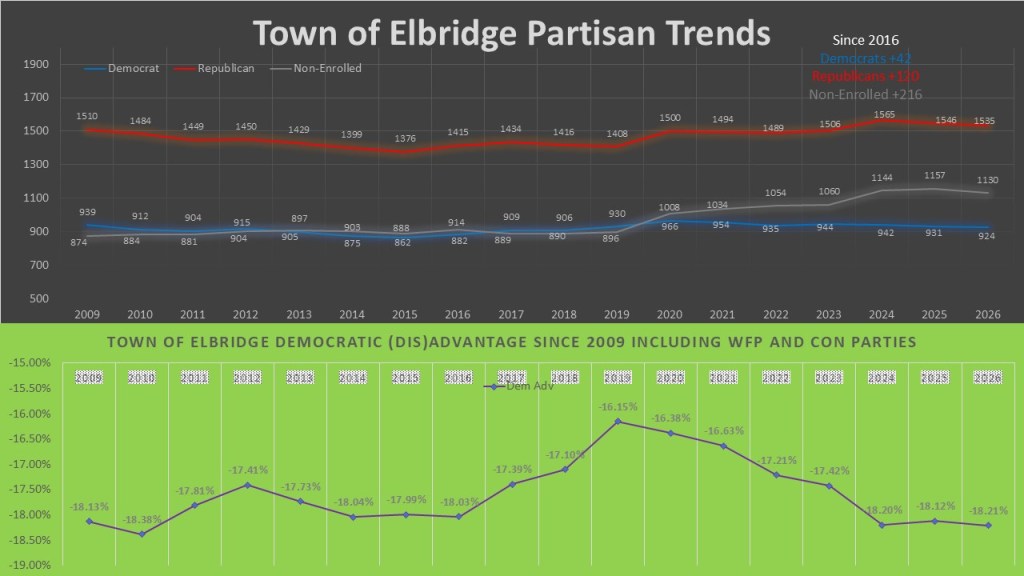
In these two charts we see the partisan trends in the Town of Elbridge. The top chart compares the three main modes of Registration: Democrats, Republicans, and Non-enrolled. As we can see the GOP has been leading consistently since 2009, and well before). Since 2016 things have gotten worse for the Democrats as they only gained forty-two voters while the GOP has gained 120 voters. However, the non-enrolled grew by more than both parties combined adding 216 voters. In the bottom chart we look at the impact of the conservative and working families’ parties and how it skews the electorate, to the right mostly. The lower the percentage the better for the right leaning ideologies (GOP and Conservative). Elbridge at -18.21% is at its lowest since 2010.
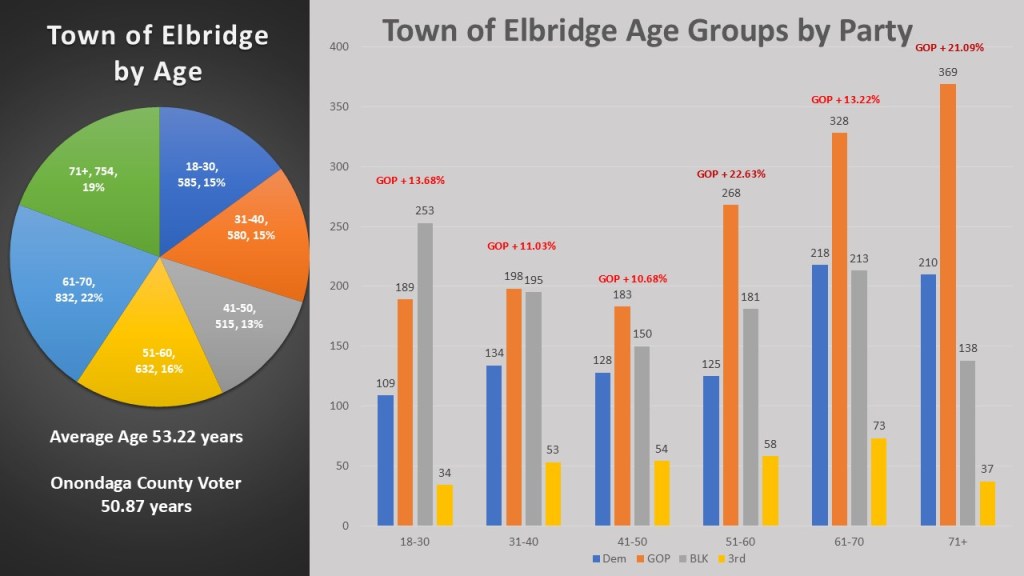
In 2026 my #weeklywonks are going to examine the effect of age on the political subdivisions we cover. The town of Elbridge is one of the oldest towns in Onondaga County. Forty-one percent of the voting population is over 60 years old. The average age of the voter in Elbridge is 53.22 years old. Compared with the average Onondaga County voting age of 50.87 years old, Elbridge is significantly older than the rest of the county. The age group ranges are also more GOP than anything else. Though in the youngest range the non-enrolled outnumber both parties, there is not a real statistical difference in the under fifty age ranges. As we get over 50 the GOP really dominate the 51-60 and 71+ groups, though less so the 61-70 group which is different than the pattern we have seen as the oldest and youngest groups being the best for Democrats.
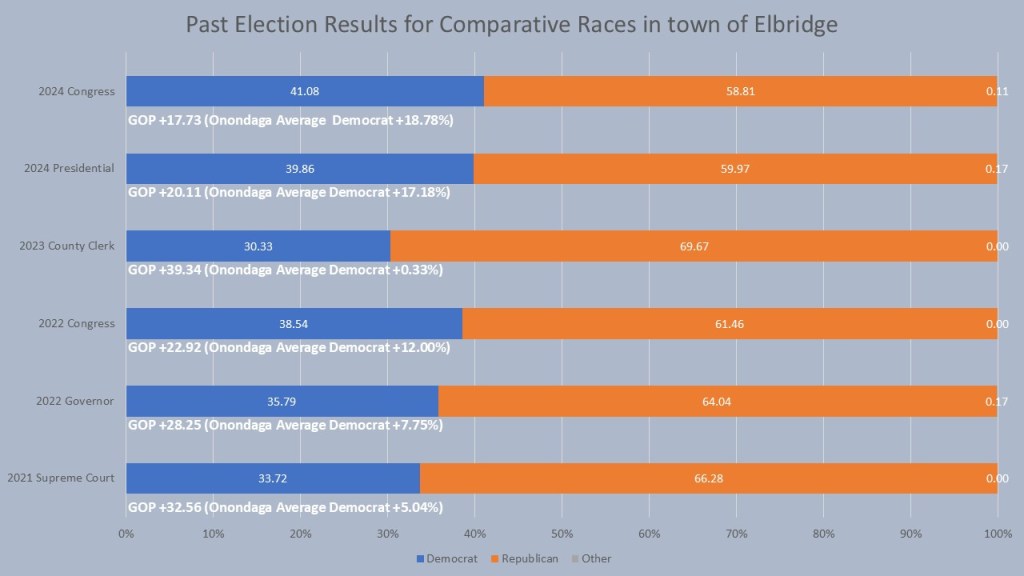
Finally, Elbridge acts in the way you suspect it might give the rightward lean of its registration in our comparative races. For the Town races we are going to look at 6 different comparative races. We can see on average in an even year Elbridge acts a little differently than in odd years, but still a major GOP stronghold. The worst race to run in Elbridge was the 2023 County Clerk race, almost 40% worse than the county average. The best Democrat to run in Elbridge was Congressman John Mannion who typically outperforms the other five comparative races. He still lost Elbridge by 17.74%. Elbridge is likely to have 35-40% more support for the GOP compared to other areas of the county.
That is, it is for this week’s edition of the #weeklywonk. Next week I continue to look at the Towns filling Democratic offices by petitions, holding elections in an even year for the first time. Part of this 6-part series will be the Democratic stronghold of Manlius. Coming soon will be Marcellus, Onondaga, Salina, & Spafford will be coming soon (skipping Lysander for 2026 as they have no offices up.). As always you can subscribe to dustinczarny.com for all content and election updates.
