Welcome back to the #weeklywonk. This is my weekly statistical based column I host on my website, dustinczarny.com. Each week I examine an aspect of either Onondaga County or New York state. I focus on electoral or registration data to give a glimpse behind the forces that drive politics and elections. This week I am continuing my 6-part series on the towns that nominate Democratic candidates by petitions starting February 24th. In part 3 I focus on the Town of Marcellus, a normally GOP town that took a dramatic blue swing in 2025.
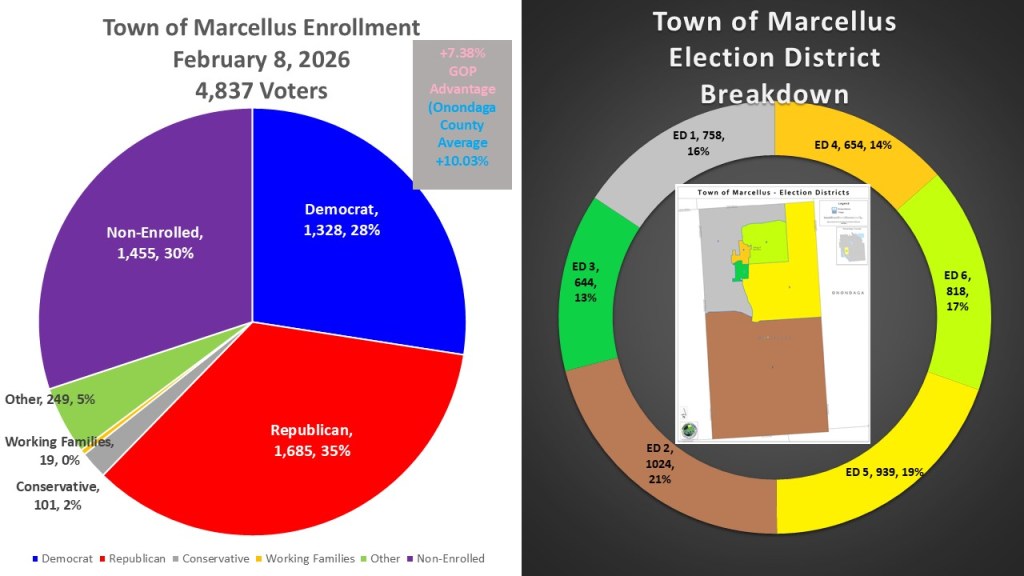
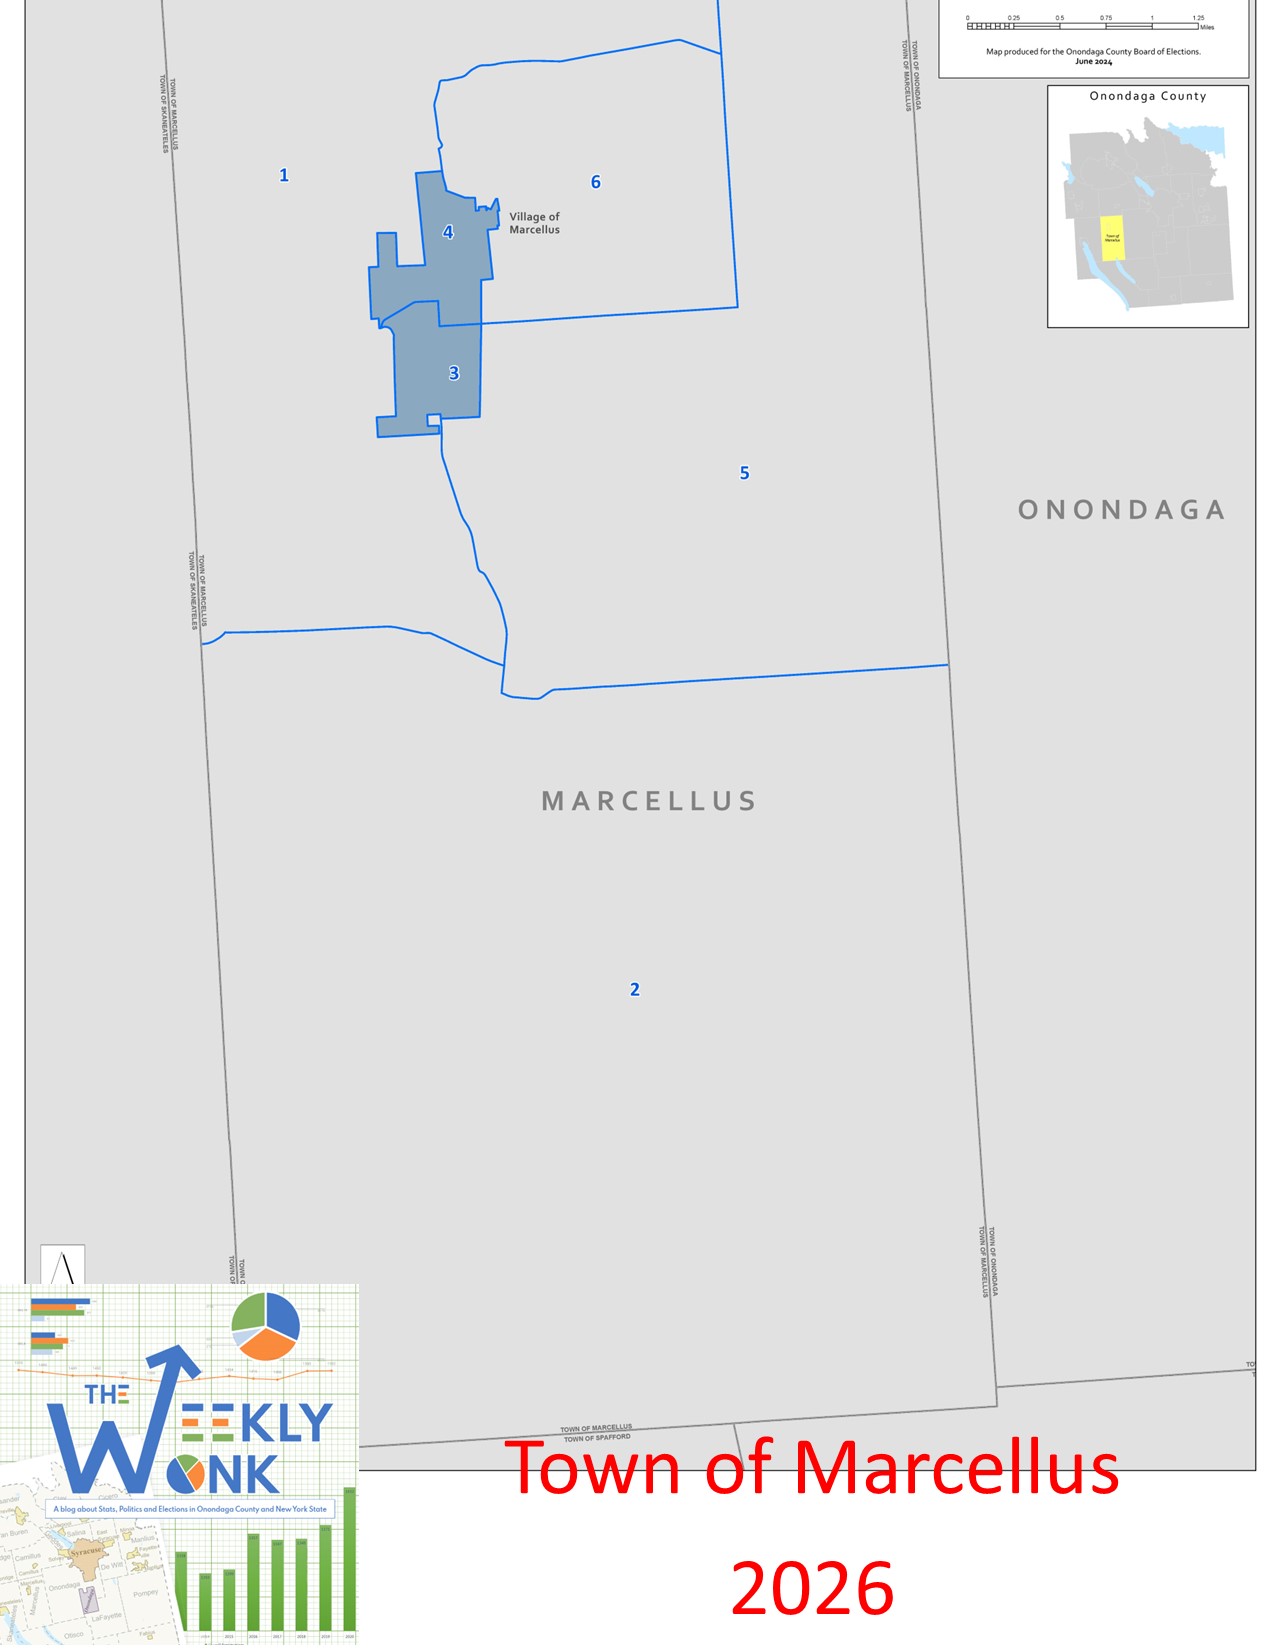
As of February 8, 2026, the Town of Marcellus has 4,837 registered voters. Republicans have the plurality with 1.685 voters (35%). Non-Enrolled comes in second with 1,455 voters (30%). Democrats come in third with just 1,328 voters (28%). The Town of Marcellus is small enough to fit inside one whole Legislative district so we will look at each of 6 Election Districts that make up the town. Marcellus village lies within the town, comprising election districts three and four, and covers approximately 27% of the town’s total area. The remaining four election districts are situated in rural areas, where voter registration is similar across each district.
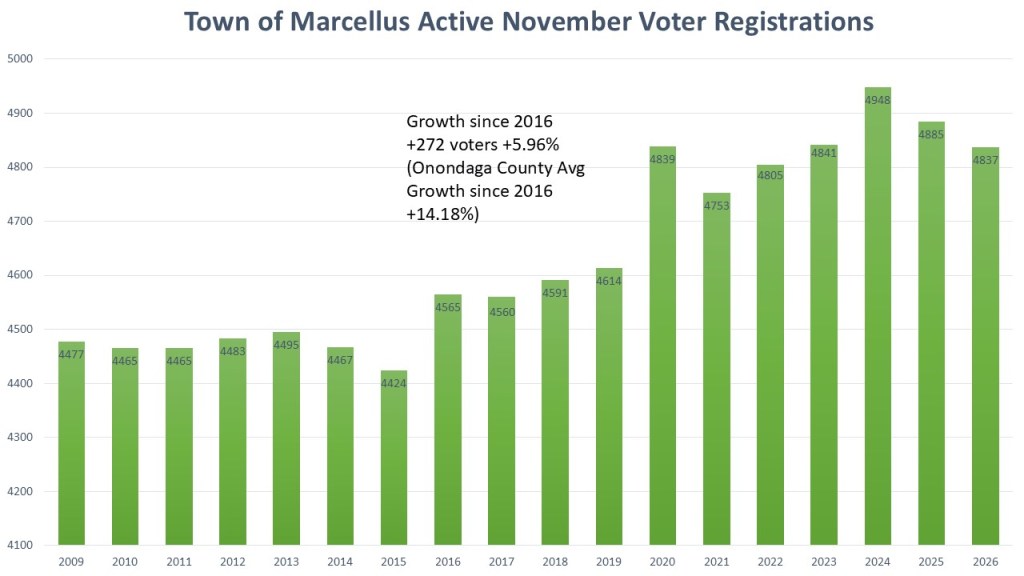
The Town of Marcellus has grown significantly since data was readily available in 20029. During this year’s # weekly, I am focusing on 2016 as a point of comparison. The town of Marcellus grew by 272 voters since November 2016. That represents a growth of just 5.96%. The bulk of that growth does come after the voter registration changes in 2019.
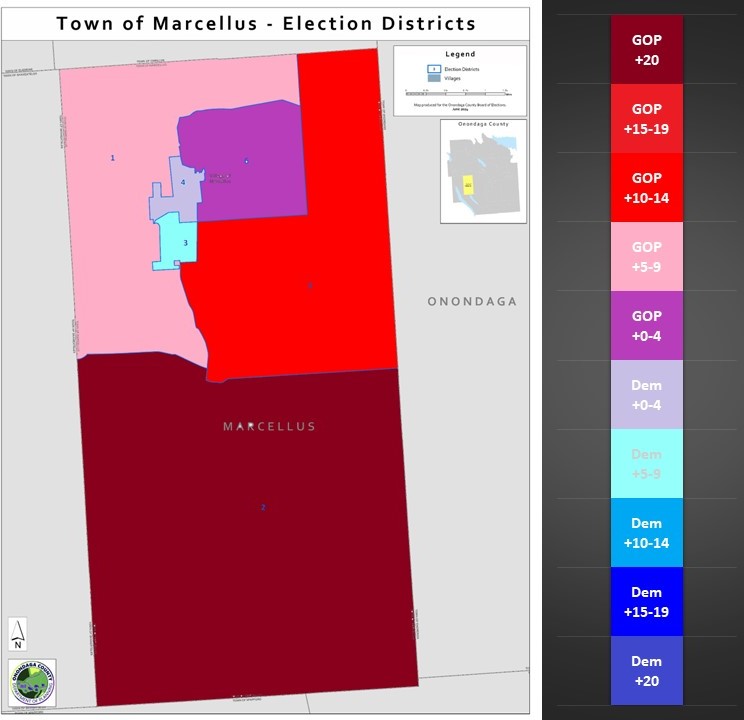
From this map we see the extreme diversity of the town of Marcellus. ED 3 and 4 serve as the representatives for the Village of Marcellus. They are the only two eds with Democrats in the plurality. ED 3 is a lean Democratic district in the +5-10% range. Ed 4 is borderline Democratic (+0-5% DEM). ED 6 just outside village and a little more suburban is borderline GOP (+0-5% GOP). ED 1 in the northwest corner is slight GOP (+5-10% GOP). ED 5 in the northeast is a strong GOP lean (+11-15% GOP). ED 6, the large southern rural ed is overwhelming GOP (>+20% GOP).
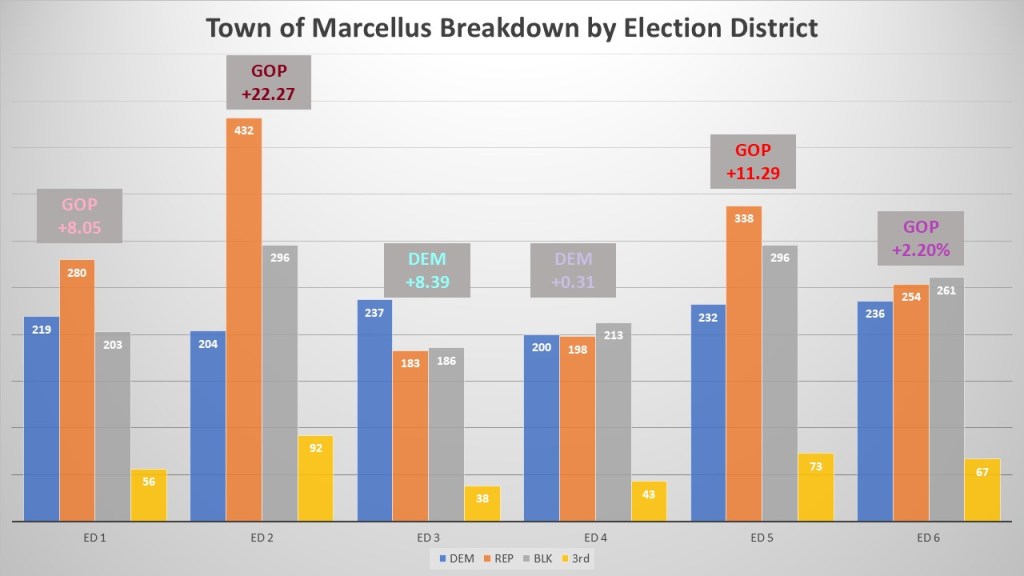
Here we investigate the six election districts in more detail. ED 3 represents the most Democratic lean with a +8.39% ranking and we even see the non-enrolled slightly outnumbering the GOP. The Borderline Democratic ED 4 is a rare ed where the Dems barely outpoll the GOP but the non-enrolled outpolls both. We see that in the borderline GOP ED 6 as well with the GOP barely beating the DEM and the non-enrolled beating them both. The Lean GOP ED 1 has your standard GOP plurality with Democrat 2nd and non-enrolled third. Buth of the other GOP of ED 2 & 5 show the GOP well ahead of the Democrat and the non-enrolled in second place.
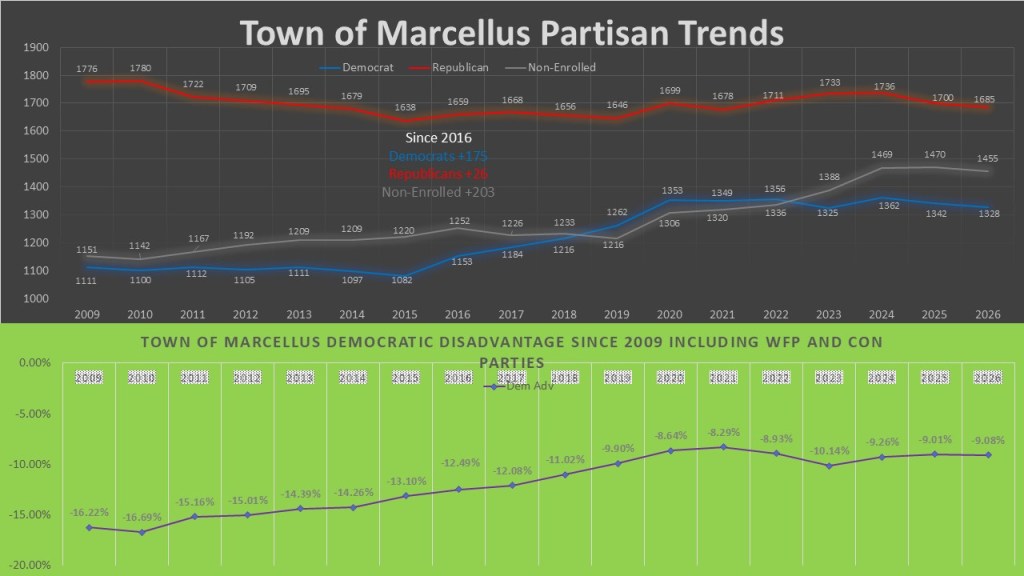
These two charts show the Partisan trends of the enrolled voters over time. We once again focus on the common comparison point of 2016. Since then, the GOP has been stagnant, adding just twenty-six voters. The Democrats in the meantime have added 175 voters. The non-enrolled though as is often the case is the largest growth at +203 voters. When we look at the ideological lean from 2009 in the bottom graph, we see that there is a strong steady move to the middle. This graph shows the dominance of the GOP and conservative party shrinking from a 16.22% difference over the Democratic and WFP parties to just 9.08%. this with the growth of the non-enrolled Is why Marcellus is shedding its Gop dominance to become a swing town.
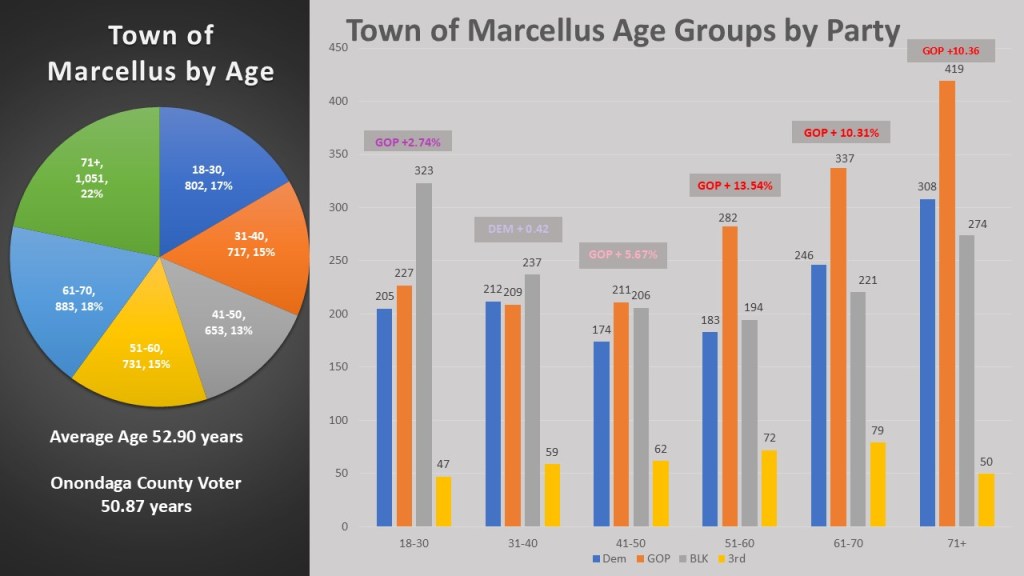
In 2026 I am rolling out an analysis for age of the average voter/ Marcellus, like most towns have an older average voter. The average Marcellus voter is 52.910 years, significantly higher than Onondaga County average of 50.87 years. The 71+ age group makes up the largest proportion, accounting for 22% of the total. When we look at the age group’s partisan leans, we see that the GOP leads in five of the six age groups with Democrats only outnumbering GOP in the 31-40 group. However, we also see the non-enrolled beating both parties with the two groups under forty and beating the Democrats in the two groups 41-60. The GOP tends to dominate the over fifty range while just barely are ahead in the under fifty range.
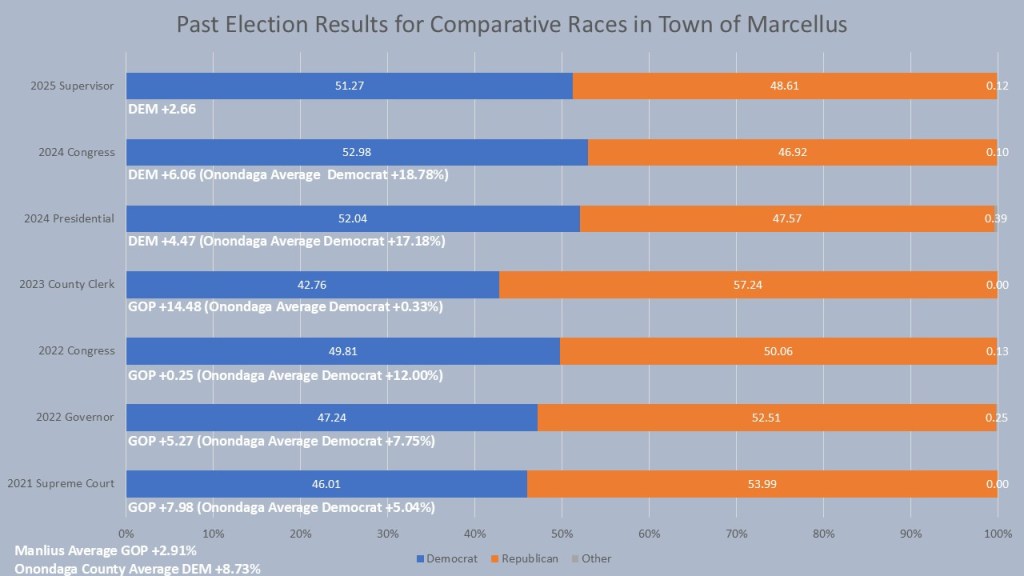
When we look at the Comparison races, we see that despite the GOP numerical advantages, Marcellus Democrats have had their share of success in this town. In Presidential years Democrats can expect about a 5%-point victory with John Mannion (+6.06%)), Kamala Harris (+4.47%) both winning the town in 2024. In Gubernatorial years, the GOP tended to have the edge with Brandon Williams (0.25%) barely winning the congressional race and Lee Zeldin (+5.27%) winning the Governor race in this town. In local years Democrats tend to not do as well with the GOP Lisa Dell winning the County Clerk race by +14.4% and Daniel Fogel winning her 2021 Supreme Court race in Marcellus by last year by 7.98%. However, in 2025 the Democrat Jane Carmody won the Marcellus Supervisor race by 2.65%. This continued the shift towards Democrats we saw in 2024. On average in the comparison race Marcellus has a +2.91% GOP lean when compared to +8.73% Democrat in Onondaga County as a whole.
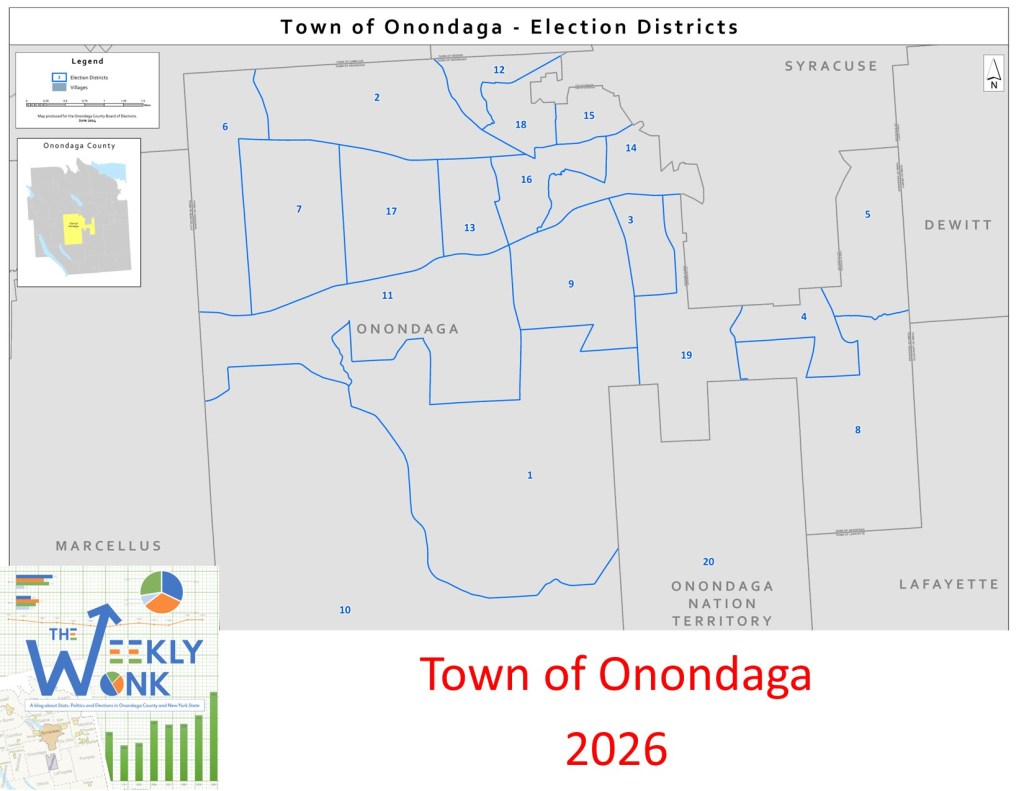
That is, it is for this week’s edition of the #weeklywonk. Next week I continue my 6-part series of investigating the towns that Democrats designate candidates via petition. Part 4, the Town of Onondaga, will look at this exceptionally large town that is becoming a true swing town and on the verge of local success. As always you can subscribe to dustincarny.com to get an email notification of all content and election news updates. Enjoy.
