Welcome back to the #weeklywonk. This is my weekly data article that I host on dustinczarny.com. Each week I dive into the electoral and registration data that affect races in Onondaga County and New York State. I am in the middle of my 6-part series looking at towns who nominate Democratic candidates by petitions starting February 24, 2026. This week is part 4 of this series looking at the Town of Onondaga. This is one of the battleground towns this year with Town Supervisor and County leg seats up in an even town.
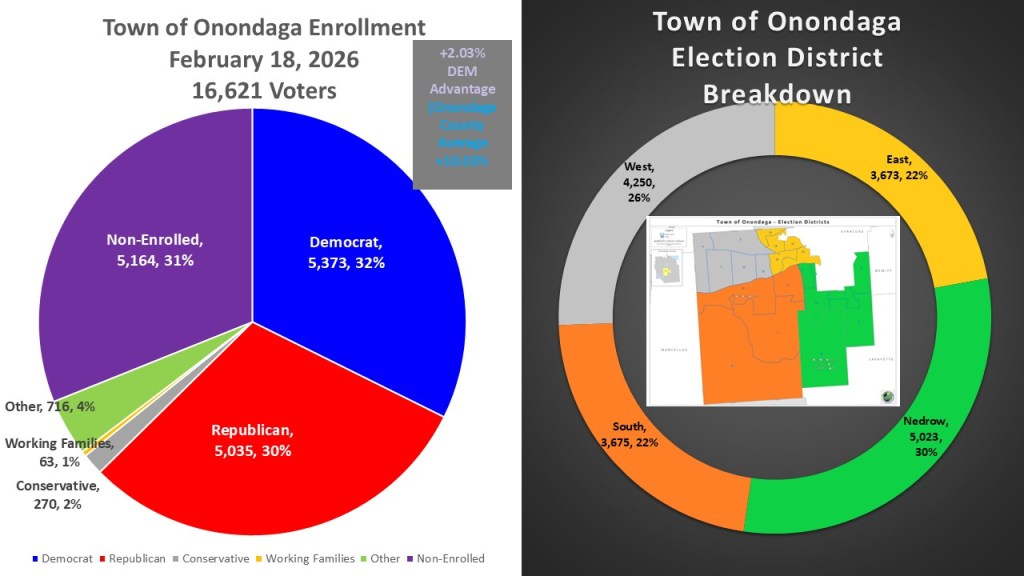
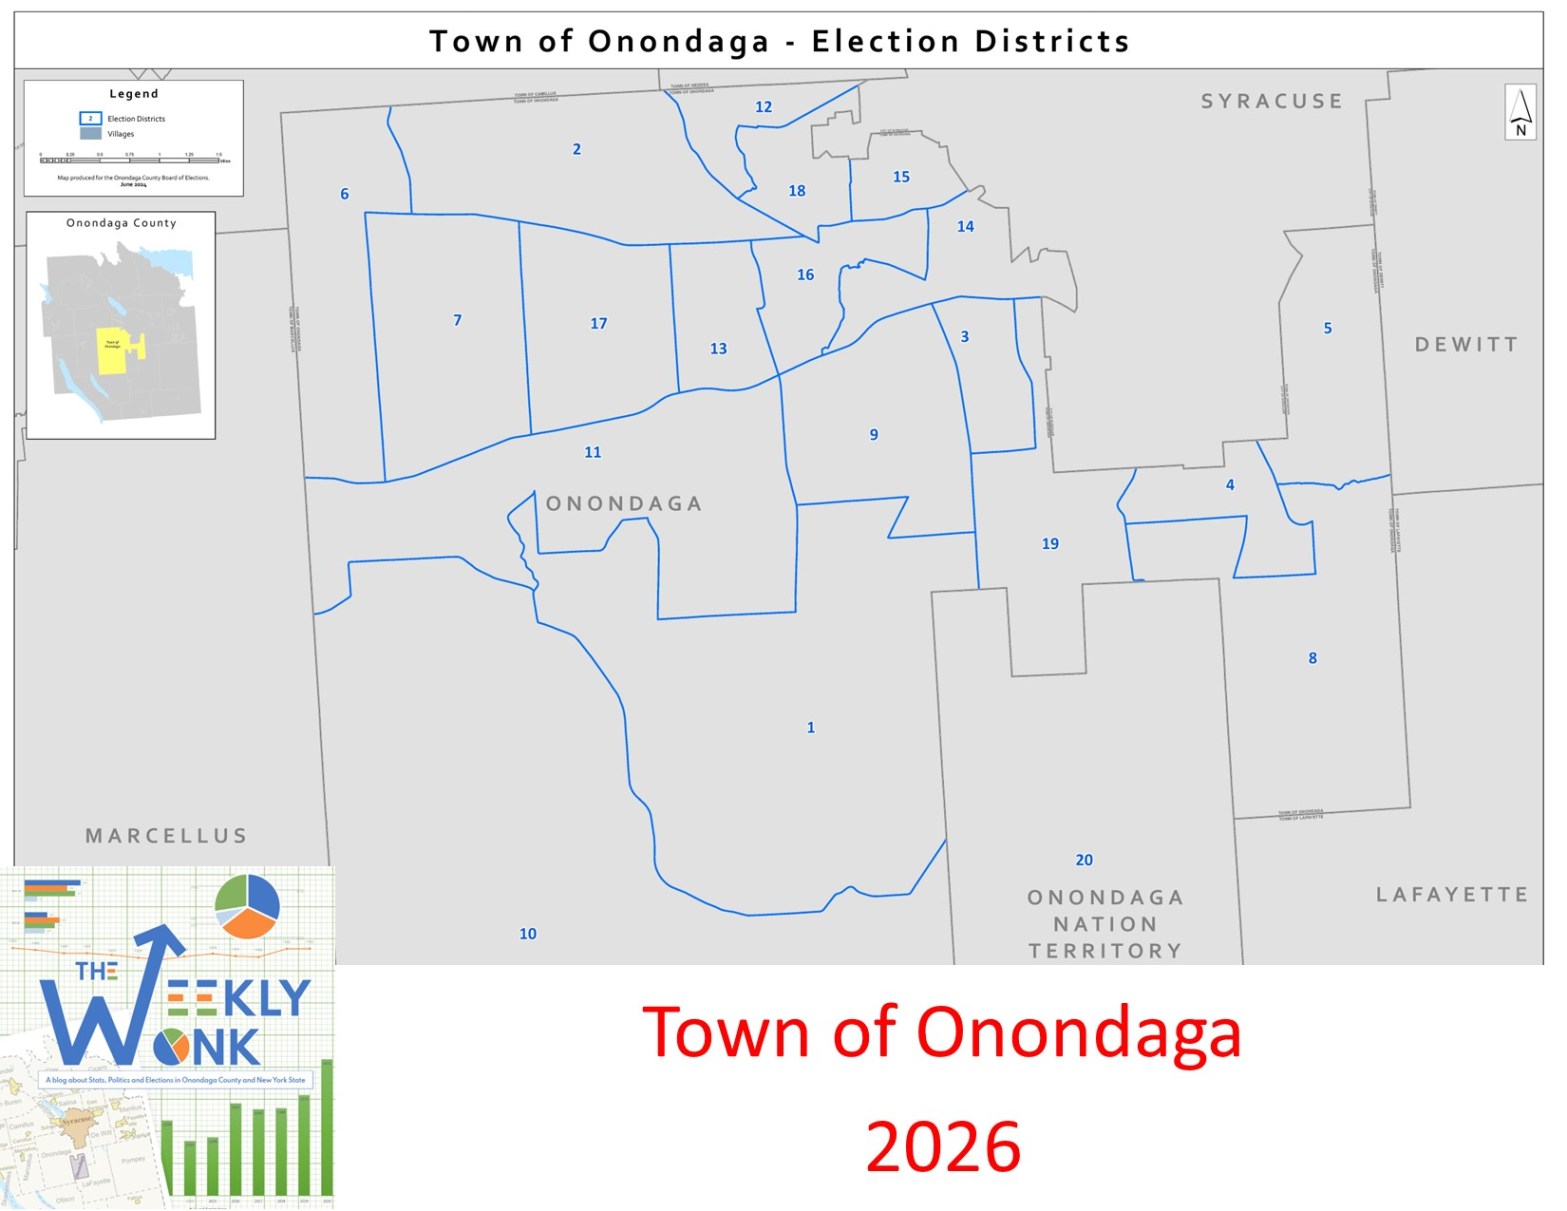
How even is the town of Onondaga Registration? Democrats have the plurality with 5,373 voters (32%). Non-Enrolled are in second place with 5,164 (31%). The Republicans are in third place with 5,035 voters (30%). Other (716 voters, 4%) Conservatives (270, 2%, and Working Families (63, 1%) make up the rest of the 16,621 voters. Democrats only have a +2.03% borderline registration advantage which makes Onondaga one of the closest towns in our County. Despite its size it is in mostly one county legislative district, OCL 11, except for the Onondaga Nation which is in OCL 12. There are no separate villages in the town. Onondaga elects all town officials in town-wide elections. Thus, to look at the town in a regional sense I have broken it by ED into four distinct sections. The western section (4,250 voters 26%) that borders Camillus and Geddes. South Onondaga (3,675 22%) is the more agrarian portion of the town. The East portion (3,673, 22%) which is densely packed suburban style bordering the valley of Syracuse. Finally, the Nedrow section (5,023, 30% wrapping around the south valley of Syracuse including the Onondaga Nation territory). These are not perfect regional breaks but will allow us to look at this large Town in segments.
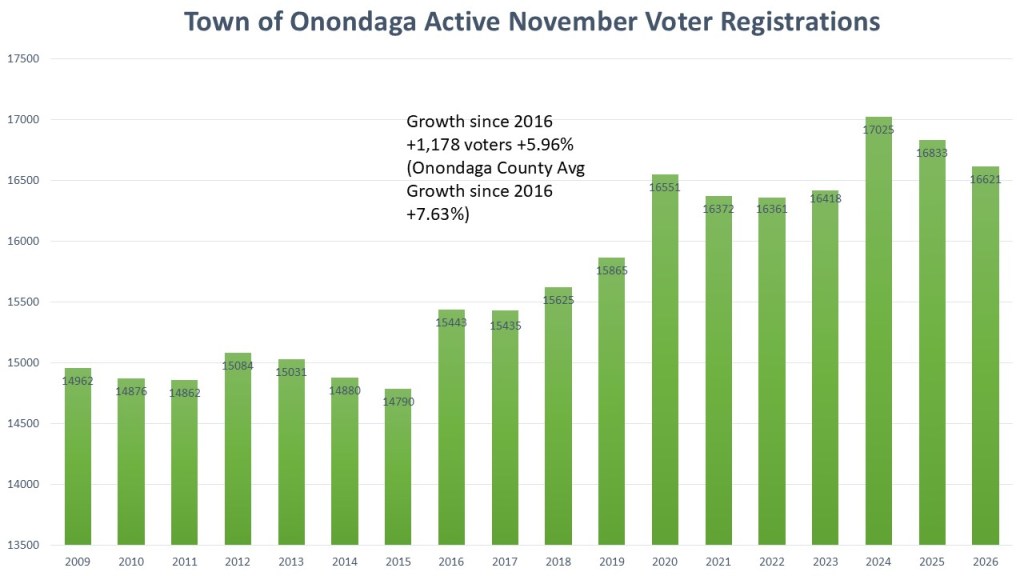
The growth of Onondaga has mirrored the growth of Onondaga as a whole. The growth of voters started in 2016 but dramatically increased in 2020 after the registration changes by the New York State Legislature took effect. The high-water mark was the 2024 election, and we are seeing the normal retreat that happens in the following months of a Presidential election. 2016 is the standard area of reference for us when it comes to growth and we can see that the Town of Onondaga grew by 1,178 voters during that time (+5.96%). This is like the growth rate in Onondaga County of +7.63% since 2016.
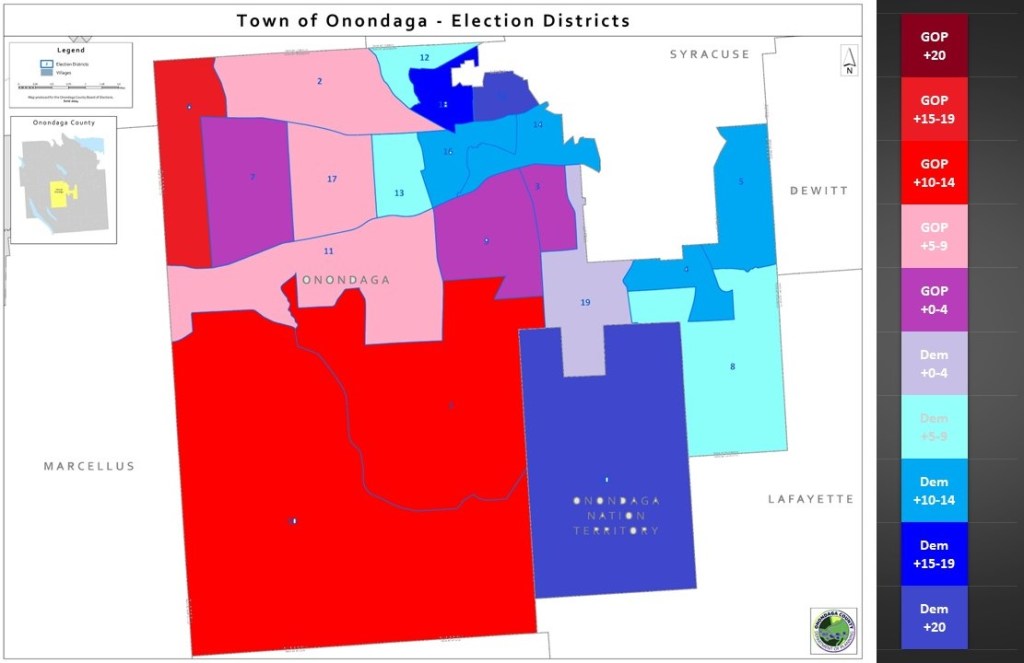
Looking at the heat map of the individual election districts of the Town of Onondaga, a pattern emerges. The closer the election districts that border the City of Syracuse, the more dominant Democrats are in the district. Likewise, the farther away, the more agrarian, the more dominant GOP is. The Town of Onondaga contains both highly concentrated Democratic districts and areas with a strong Republican presence. Even though this is an even town, it is a wildly diverse town in terms of partisan strength. Adding these parts all together gets a town as closely partisan as it is now.
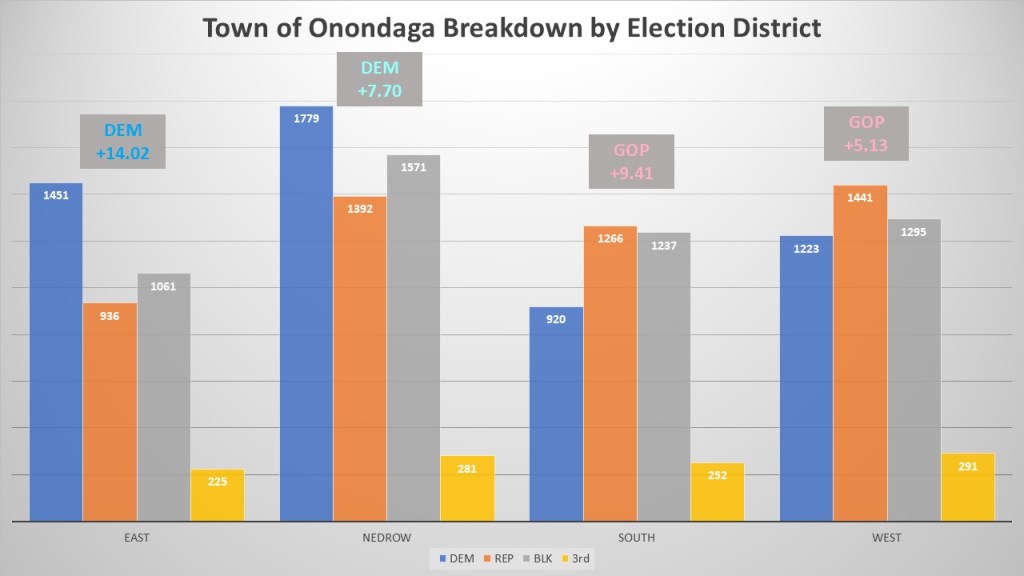
Looking at the general regions of Onondaga, we see the same diversity of the individual election districts. There are two Democratic regions (East & Nedrow) where the non-enrolled outnumber the GOP. There are also two GOP regions (South and West) where the non-enroll outnumber the Democrats. The East dense suburban ED is the most Democratic with a +14.92% Democratic enrollment edge. Next is the Nedrow region, which has the highest number of Democrats and leans Democratic by +7.70%. The Western portion is a traditional lean GOP area with the Republicans have a +5.13% partisan advantage. The South is the most GOP dominant advantage with +9.41% but the non-enrolled are remarkably close to eclipsing both the GOP and Dem individual totals.
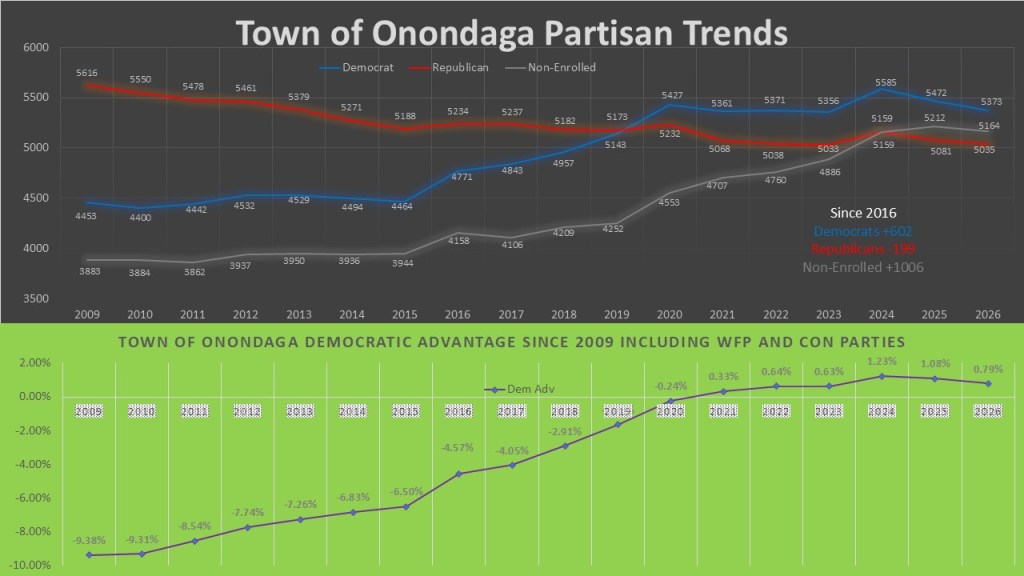
These two graphs show the partisan advantage since 2009. Again, the town of Onondaga is a microcosm for the how the suburbs of Onondaga County have transformed over the last 10 years. Democrats overtook the GOP in this town in 2020 and non-enrolled overtook the GOP in 2025. Democrats since 2016 have added fifty-one voters. The GOP since 2016 has lost 199 voters. The non-enrolled were again the highest gainers, adding one thousand voters since 2016. Even when you add in the working families and conservative to determine the ideological advantage the pattern is clear. In 2009 the Town of Onondaga was a solid 9.38% advantage for the GOP and now is a as close as possible with a .79% advantage for the Democrats.
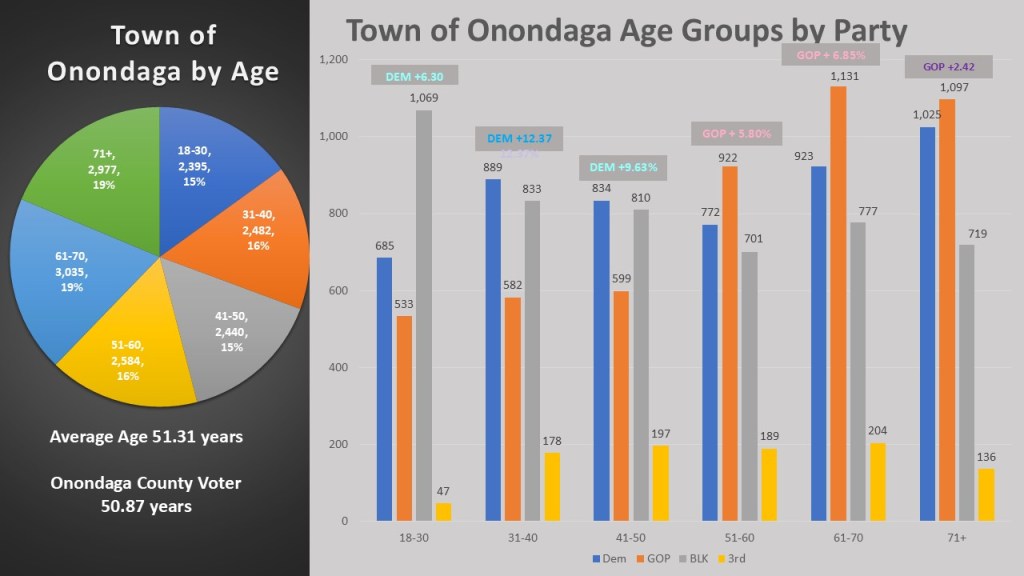
This year I am looking at age to examine these political subdivisions, The Town of Onondaga is a normal town averaging 51.31 years, just slightly over the Onondaga average of 50.87 years. The largest age group is 61-70 years old, but all the age groups are close in size. When looking at the partisan breakdown of the age group the theme of a divided town of Onondaga continues. Democrats are solidly dominating the under fifty age groups. 31-40 Democrats have a +12.37%, 41-50 Democrats have a +9.63% advantage, and the youngest group Democrats only have a +6.30% because of the domination of the non-enrolled in that age group. Republicans have slight edges in the more populous older age groups. 51-60 the GOP has +5.80%, the 61-70 GOP has +6.85%, and the oldest group the GOP has a borderline advantage of 2.42%.
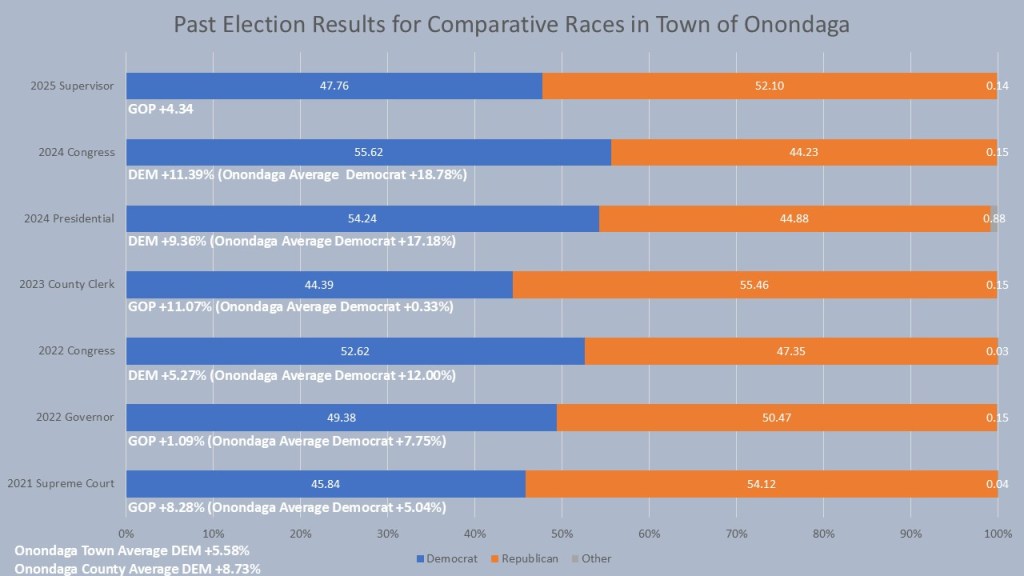
When we look at the comparative races, we see a Town that truly acts differently in higher turnout presidential years, mid turnout gubernatorial years, and low turnout odd years. In 2024 the Town of Onondaga showed up for Democrats in a huge way, giving a +11.39% for John Mannion for Congress and a +9.36% for Kamala Harris for President. In the Gubernatorial year we saw a split. Onondaga supported Francis Conole by 5.27% for Congress but Lee Zeldin edged out a +1.09% advantage (though under a majority). In Odd years Democrats have not fared so well. Emily Essi for county clerk won countywide by .33% but lost the Town of Onondaga by 11.07% in 2023. Likewise, Anthony Brindisi of Supreme Court won the county by 5.04% but lost the Town of Onondaga by 8.28%. In 2025 Khalid Bey improved on both of those results but still lost the Town Supervisor race by 4.34%. Again, the Town of Onondaga is close to the County of Onondaga average of the six comparative races where Democrats win the town on average by 5.58% and Onondaga County on Average by 8.73%.
That is, it is for this week’s #weeklywonk. Next week we turn our eyes to the northern suburb of Syracuse, the town of Salina. Home of the Salina sweep in 2025! We will look at why this town flipped so drastically and the implications that it will have in 2026. As always you can subscribe to dustinczarny.com and get an email notification for all content and election news updates.
