Welcome back to the #weeklywonk. This is my weekly data article that I host on dustinczarny.com. Each week I dive into the electoral and registration data that affect races in Onondaga County and New York State. I am in the middle of my 6-part series looking at towns who nominate Democratic candidates by petitions that started last Tuesday. This week is part 5 of this series investigating the Town of Salina. Home last year to the Salina Sweep that saw Democrats take over the town government and both county legislature seats that cross into this town. This town has become the bell weather town for politics in Onondaga County.
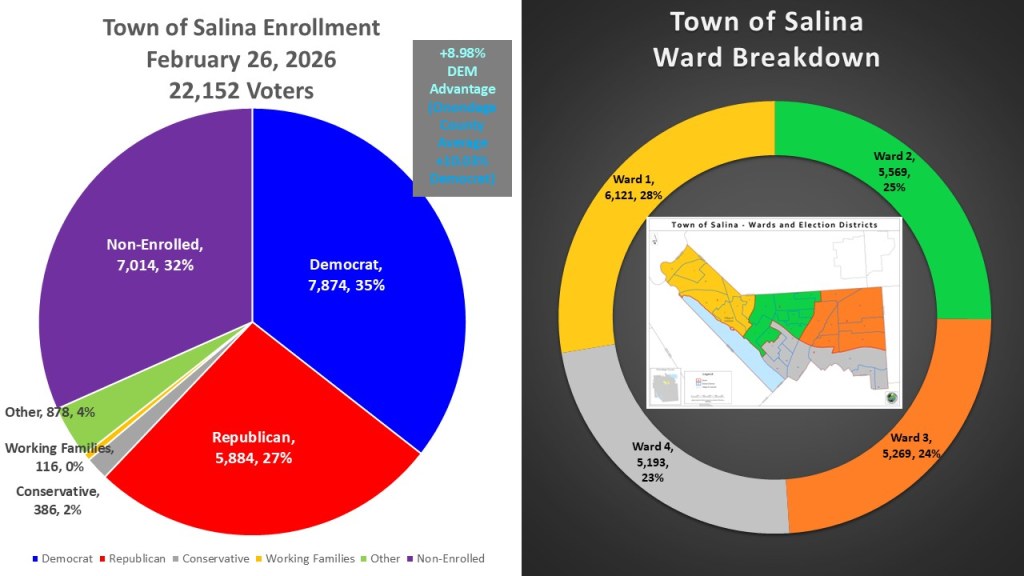
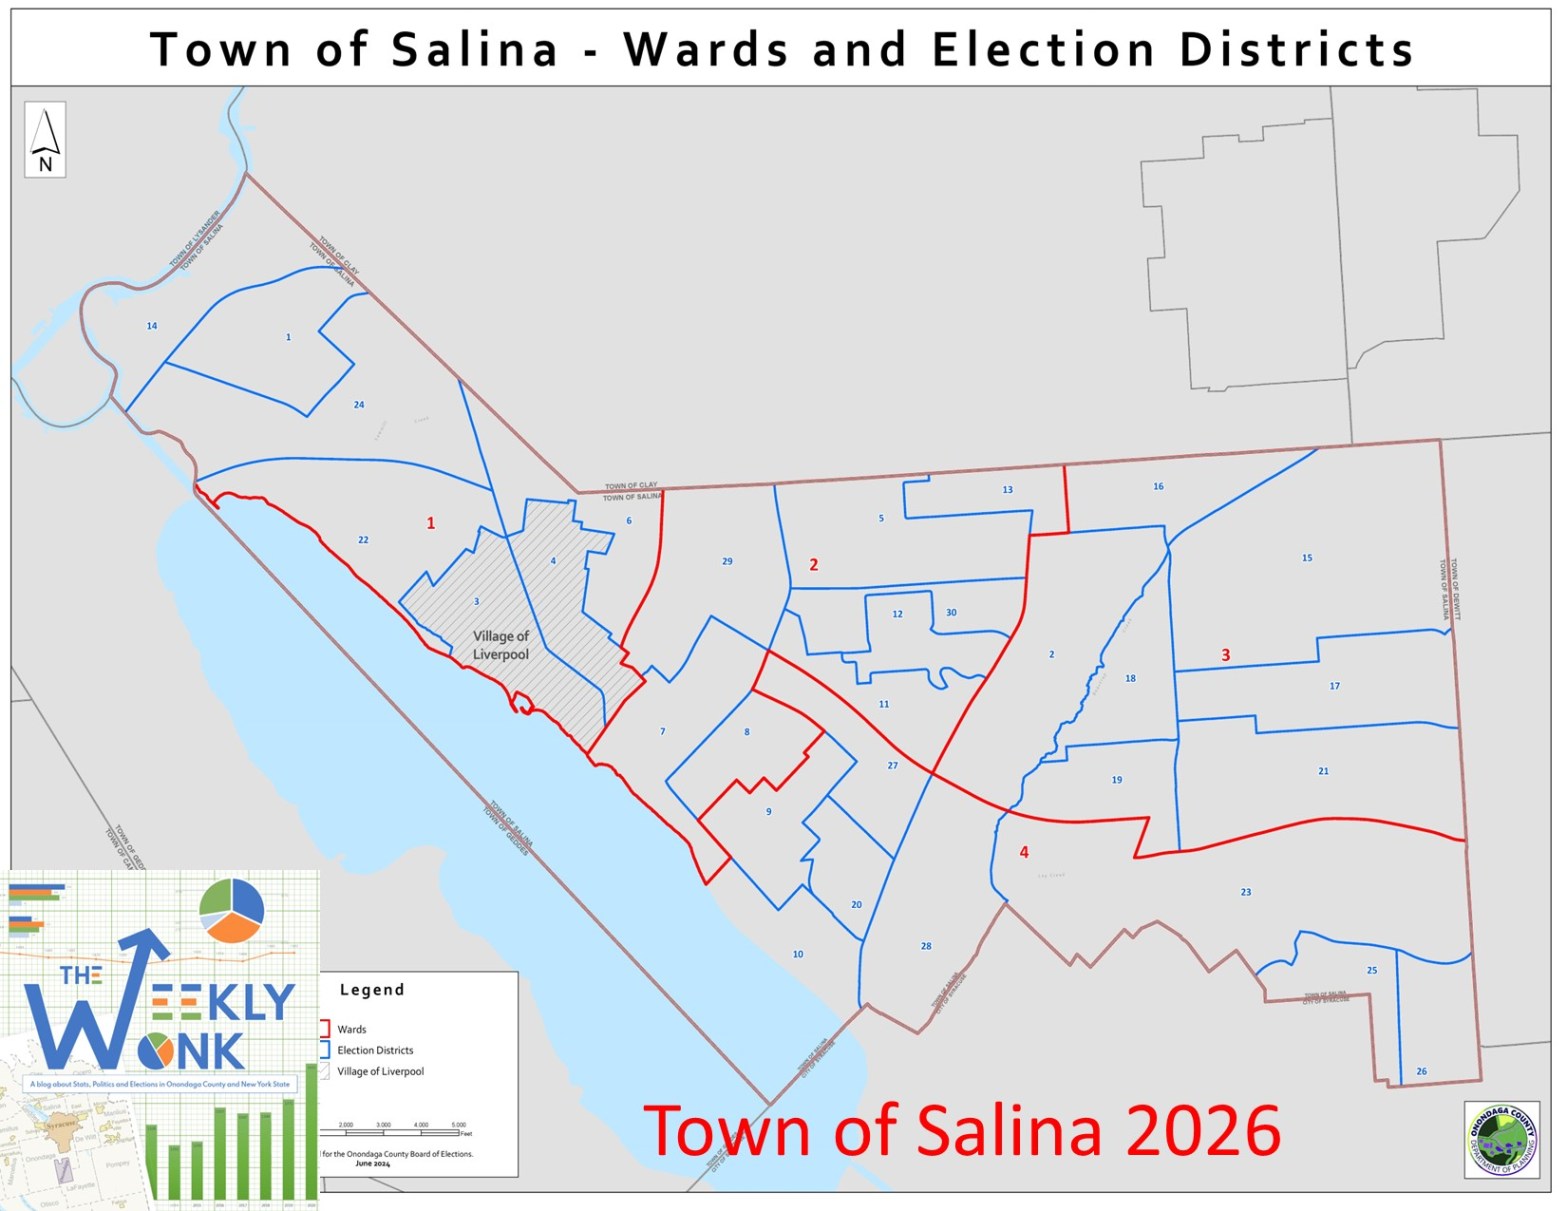
One of the reasons I consider Salina to be the bell weather town of Onondaga County is how similar the makeup is to the County as a whole. As of February 26, 2026, Salina had 22,152 voters. 7,874 voters are Democrat (35%). In second place are the non-enrolled voter block of 7,014 voters (32%). The 5,884 Republicans (27%) are in third place. Voters enrolled in various other parties (878, 4%), Conservative (386, 2%) Working Families (116, <1%) make up the rest of the town. The Democrats have a +8.98% partisan difference which is like Onondaga County as a whole (Dem +10.03%). Salina is one of only two towns in Onondaga County that let their Town Boards in districts (called wards) as opposed to town wide. The four town wards are of varied sizes because Salina did not redistrict in 2021 keeping the same maps even though the spread was only slightly below the legal rate of 5% population. It is highly likely that redistricting will be necessary in 2031.
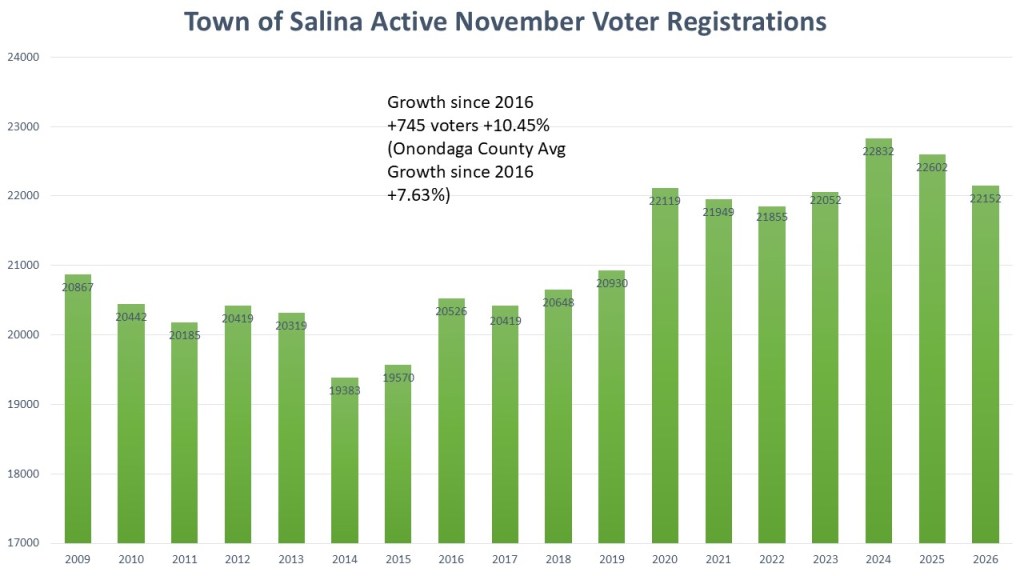
Salina has grown a little faster than Onondaga County as a whole. Since 2016 Salina has added 745 voters. That is a growth rate of 1045%. This is slightly ahead of the pace of Onondaga County of 7.63%. Like most areas of our county, we saw major growth happen between 2020 and 2024. This is due to the simpler registration procedures established by laws enacted from 2019 to 2023. After the high point of the 2024 presidential election, participation typically drops.
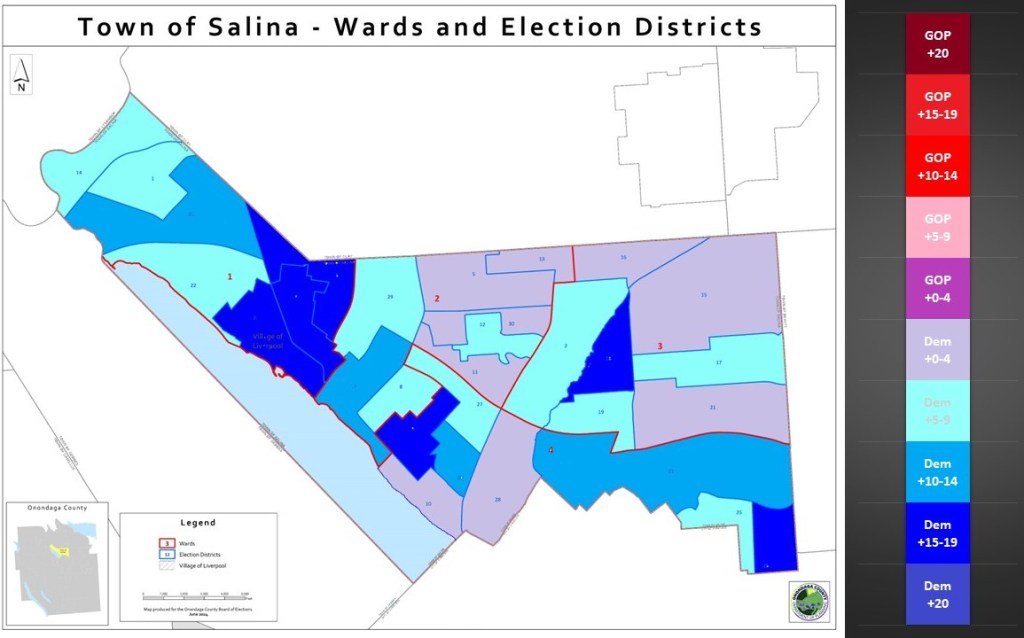
When looking at the heat map of Salina we can see there are no election districts where the GOP even have borderline registration advantage. We do, however, see a pattern with Salina. In the northwestern region of Liverpool, Democratic candidates are significantly preferred, with certain precincts demonstrating a 15-19% advantage. The village of Liverpool serves as an example of this. There are pockets of heavier democratic leans in the middle and eastern portion of the town. However, the farther west we go the more likely the election districts have a borderline Democratic lean.
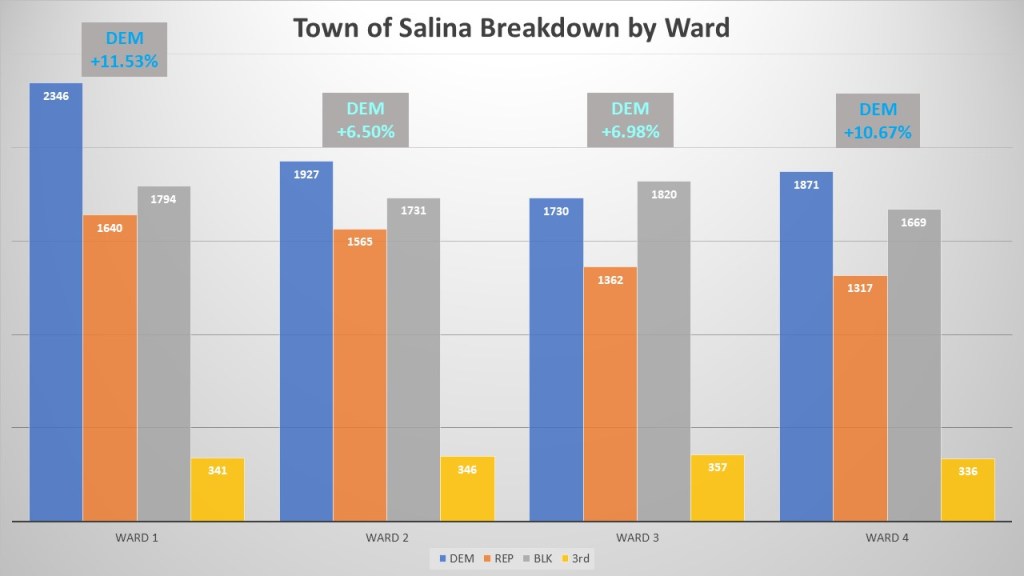
Focusing in on the four wards of Salina there are few differences between them All four wards have Democratic leans with Ward 1 having a +11.53% partisan advantage, followed by Ward 4 (+10.67%) then ward 3 (+6.98%) and last ward 2 (+6.50%). All four wards the GOP are in third place of the registered voters, however ward three has the rare instance where the non-enrolled outnumber both the Democrats and the GOP individually. Each district now has a Democratic officeholder whose views match the area’s voter registration patterns, something that has not happened in years.
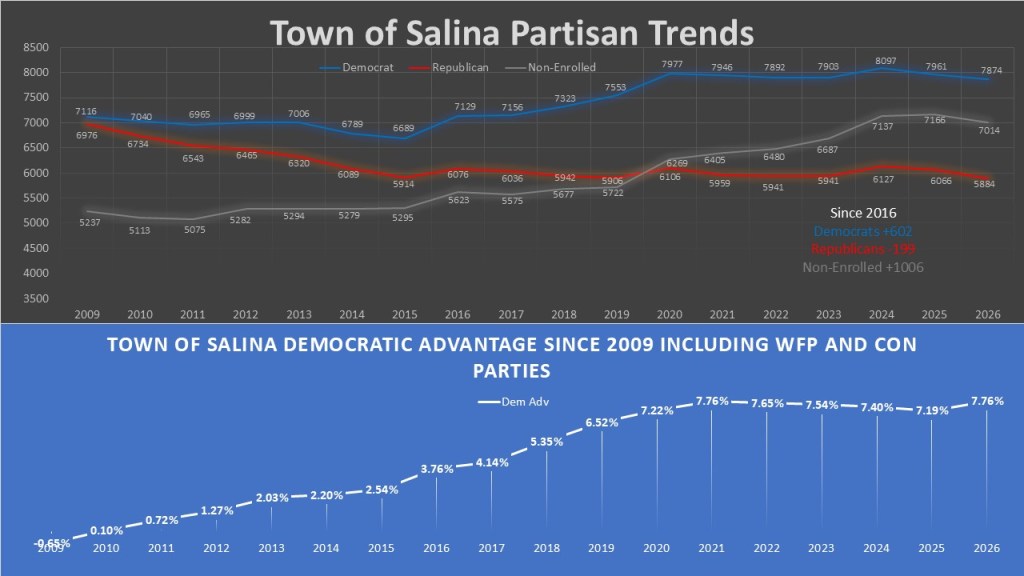
Salina has always been a borderline town, despite the GOP dominance in its office holders. In 2009, both Democrats and Republicans held equal representation in political affiliation within the town. This was steadily changing into 2016. Since 2016 though Democrats added 602 voters. The republicans have lost 199 voters since 2016. The non-enrolled is the biggest gainer during that period with +1006 voters. When looking at the ideological trend we see that the left (Democrats and WFP) has steadily grown in dominance when compared to the right (GOP and Conservatives). The current advantage of 7.76% is the highest on record, though tied with 2021.
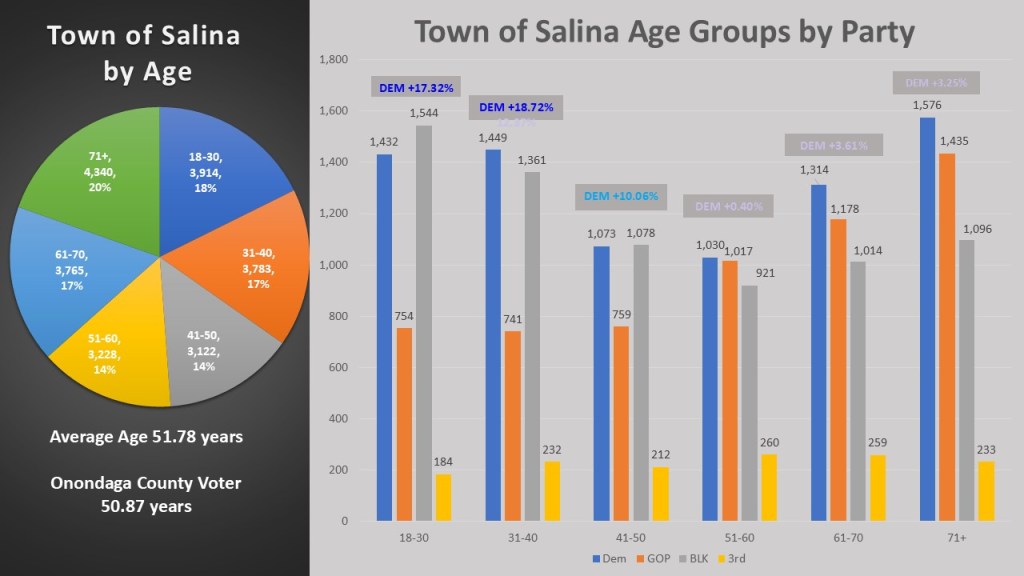
This year I am adding age to the metrics I am using to analyze political subdivisions this year. The average age of Salina voters is 51.78 years old, which is slightly higher that Onondaga County average of 50.87 years. The interesting part of Salina is the oldest age group of 71+ (20%) is the most populous but closely followed by the youngest age group of 18-30 (18%). We also see the dominance of the non-enrolled in the younger age groups. The non-enrolled outnumber the GOP in all three age groups below 50 but also outnumber the Democrats in the 18-30 and 41-50 age groups. Still Democrats dominate all three younger groups in enrollment advantage. The three age groups over fifty-one are borderline Democratic groups with the traditional order of Democrats leading followed by GOP in second place and the non-enrolled in third.
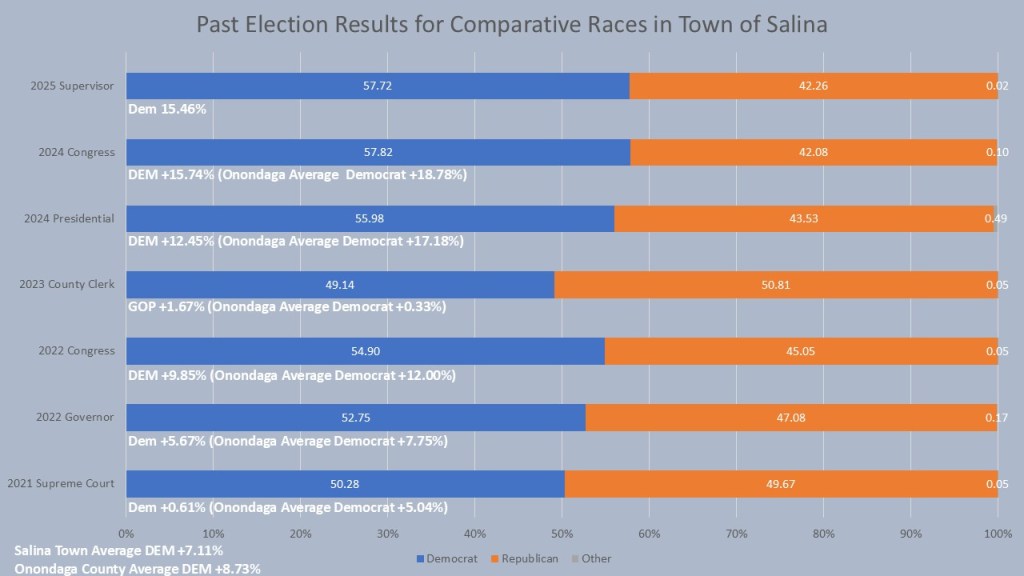
Another piece of evidence for Salina being the bell weather town for Onondaga County is the performance in the six comparative races we are using this year. The only GOP to win these six races was the impossibly close 2023 County Clerk race, and only by 1.67% (as opposed to the county overall result of Democrat +0.33%). Every race Salina ran just 2-3% to the right of Onondaga County, one of the closest we have analyzed so far. In Salina, the six comparative races had an average margin of Democrat +7.11%, which is statistically similar to Onondaga County’s average of Democrat +8.73%. This is why the Supervisor race in Salina was such a surprise with Raul Huerta winning by 15.46% as part of the Salina sweep.
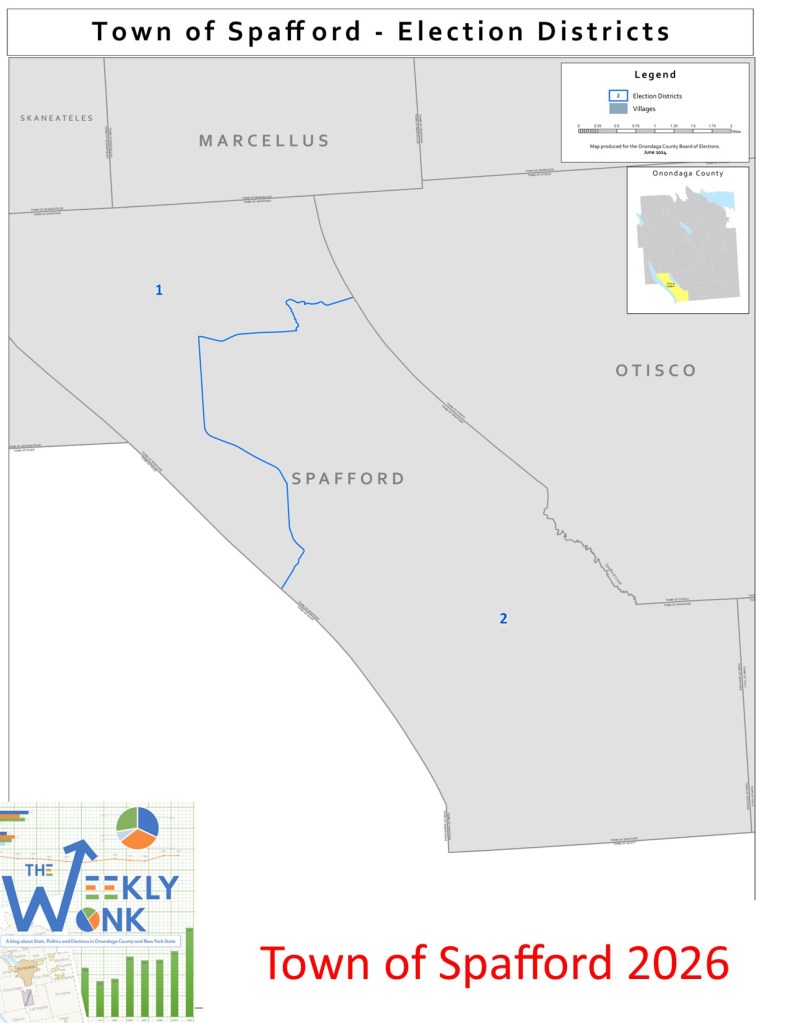
That is, it is for this week’s edition of the #weeklywonk. Next week I finish my 6-part series looking at towns that nominate democratic candidates by petition. I will look at the small town of Spafford that has shown a large history of bucking their republican enrollment to elect Democratic representatives. Next, I will look at the big races this fall as the NYSBOE has released their enrollments for multi county districts so we can now look at NY State, Congress, State Senate and assembly and Supreme Court races on the ballot this fall. As always you can subscribe to dustinczarny.com for all content and election news updates.
