Welcome back to the #wweeklywonk. This is my weekly column on dustinczarny.com on data relevant to Onondaga County and the State of New York, each week I dive into the electoral, registration, and performance data surrounding a political subdivision or election event relevant to our home here in Central New York. 2026 is a gubernatorial year and that means we have statewide elected offices running. Today I am looking at New York State as a whole. This is the first part of my 9-part series looking at New York State offices on the ballot this year in Onondaga County. So, join me as I look at the Empire State as we head into 2026 and how it relates to Onondaga County.
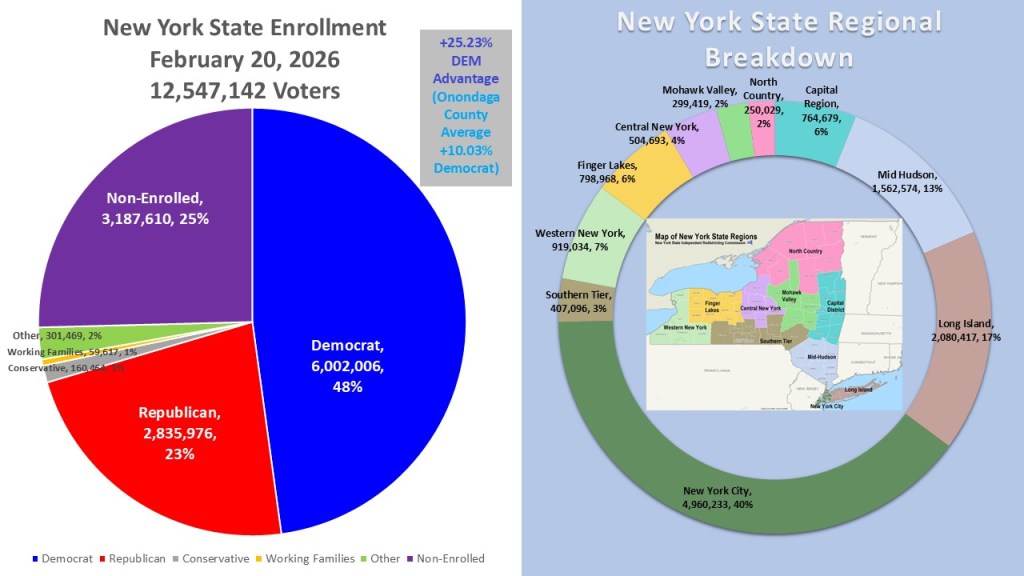
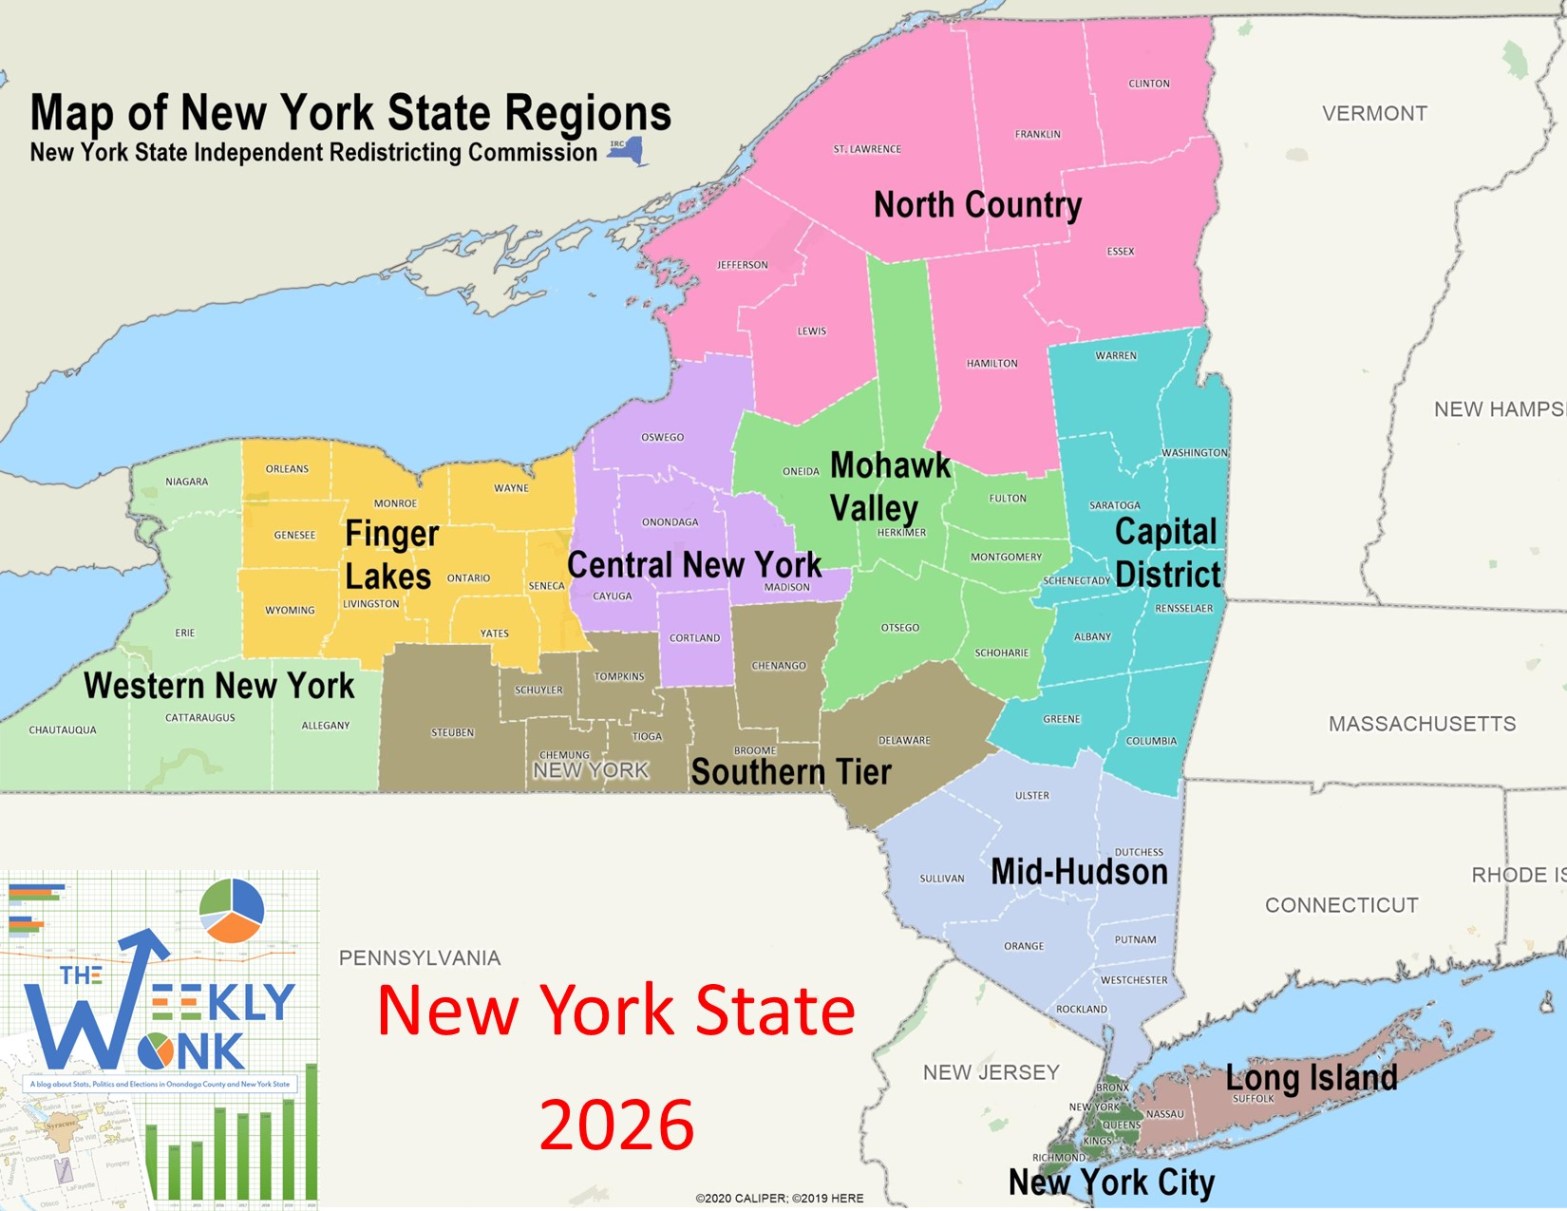
On February 20, 2026, the NYS Board of Elections pulled registration data from every County board of Elections. This gives us a good opportunity to look at how New York Stands currently with up-to-date data. As of February 20, 2026, New York has 12,547,142 active voters. Democrats are the dominant plurality of 6,002,006 voters (48%). Non-enrolled are second in New York with 3,187,610 voters (25%). Republicans have fallen to third in New York with just 2,835,976 (23%). Rounding out the population are the other category (301,469 2%), Conservative (160,464 1%), And Working Families (59,617 1%). This gives Democrats a +25.23% Democratic enrollment advantage statewide. One of the most controversial topics in New York is breaking it up into regions. To avoid this, I am using the regions as designated by the New York “Independent” redistricting commission. It is evident that New York City accounts for 40% of the state’s active voters, highlighting its dominant influence within New York. Long Island (17%) and the Mid-Hudson Valley (13%) follow this. The rest of the regions across upstate New York range from 2-7% each.
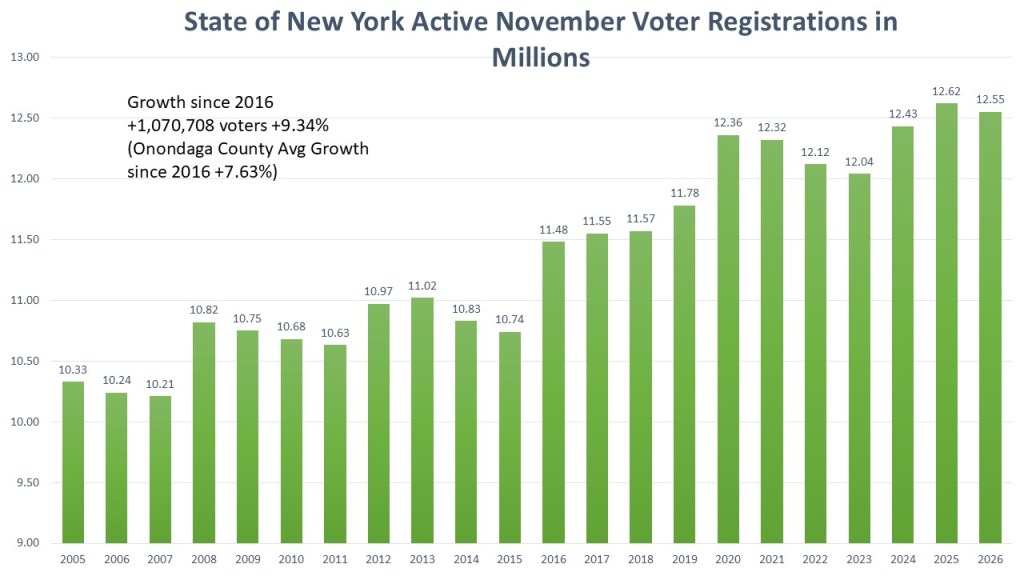
This chart shows the number of active registered voters in the State of New York in the millions. Currently New York has the second highest total of active registered voters going back to 2005. The season I cut this off in 2005 is the tracking of active and inactive voters started at that point so data before that date is not really comparing apples to apples. The changes in registration options clearly show the growth in registered voters in New York. Online voter registration began at the NYS DMV in 2016. After Democrats gained control of the NYS legislature in 2019, they passed measures like statewide transfers and a constitutional 10-day registration deadline, making it easier for voters to register and update their status. This year New York is finally launching Automatic Voter Registration with the DMV that will increase voter registration further. Since 2016 New York has added 1,070,708 voters which is a growth rate of 9.34%. Onondaga County trails the state average during that period with a growth rate of only +7.63% during this time.
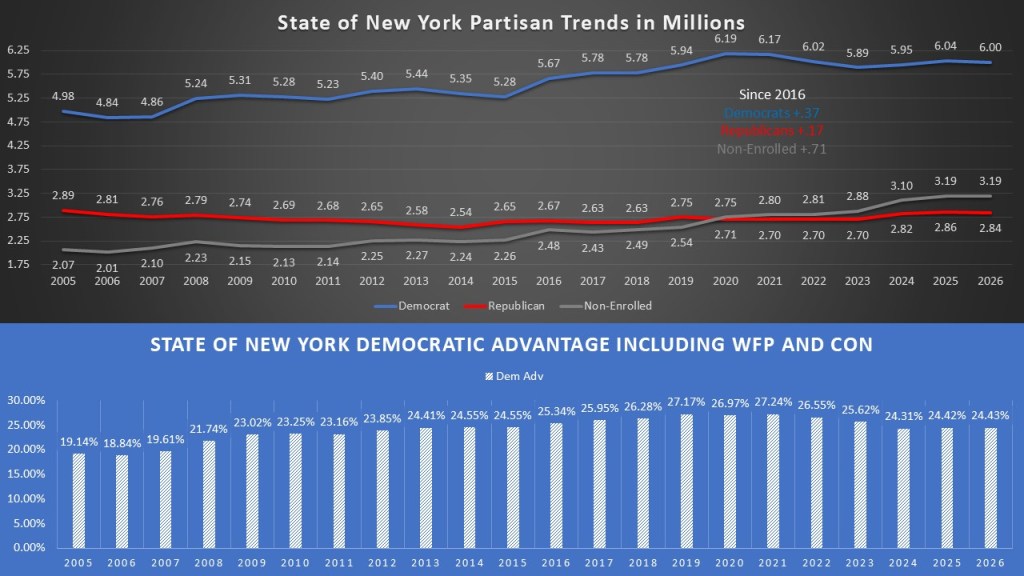
In terms of partisan trends, we see a similar trend line that we saw in Onondaga County. Democrats since 2005 have grown and Republicans have remained stagnate. The big growth category though is the non-enrolled. In 2020 the non-enrolled overtook the republican category to become second place in New York. When we dial in on the last ten years since 2016, we see this trend hold. Democrats added approximately 370k voters. Republicans have added 170k voters reversing a trend of losing voters from 2005. However, the non-enrolled grew the most again, adding over 710k voters. When we factor in the Working Families and Conservative enrollment Democrats still have a 24.43% advantage over the GOP. We do see that Democratic advantage peaked in 2021 after the end of the first Trump administration at +47.24%. There had been a steady decline until 2024. We are now starting to see another levelling off and signs of increase in the second trump term.
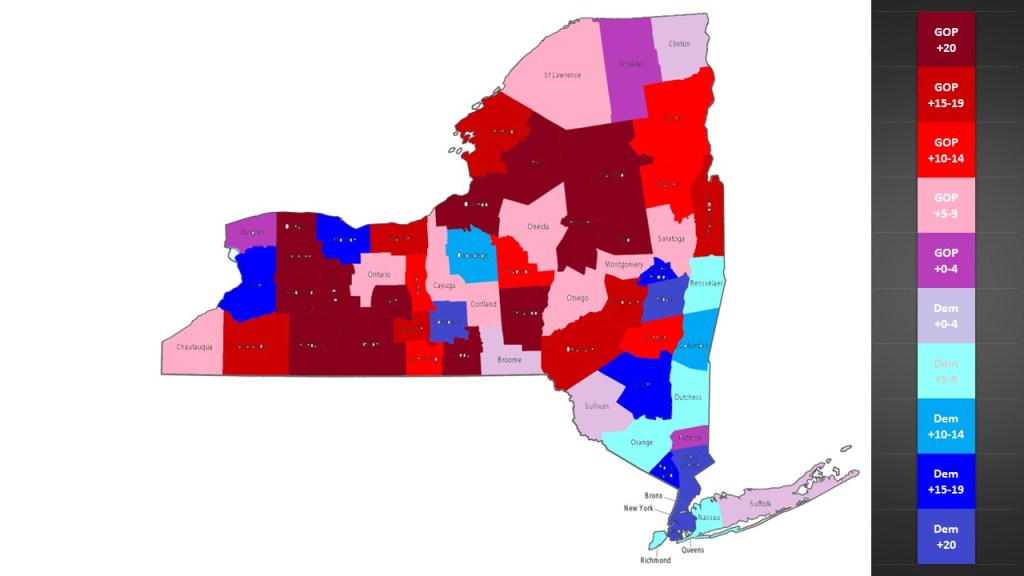
People often fail to recognize the rich diversity found throughout New York State. Here is the heat map of New York counties in terms of partisan advantage. Obviously, we see a great deal of blue in NYC and the counties downstate. But even in the upstate regions we see a great deal of counties with large clue leanings, in counties hosting large upstate cities like Buffalo (Erie), Rochester (Monroe), Syracuse (Onondaga), & Albany (Albany). Schenectady, Rensselaer, and Columbia counties make up the capital region. Tompkins County is distinctive due to Ithaca’s influence on its development. No matter what region of New York we look at there is at least one county in the region that at least is borderline Democrat with the lone exception of the Mohawk Valley.
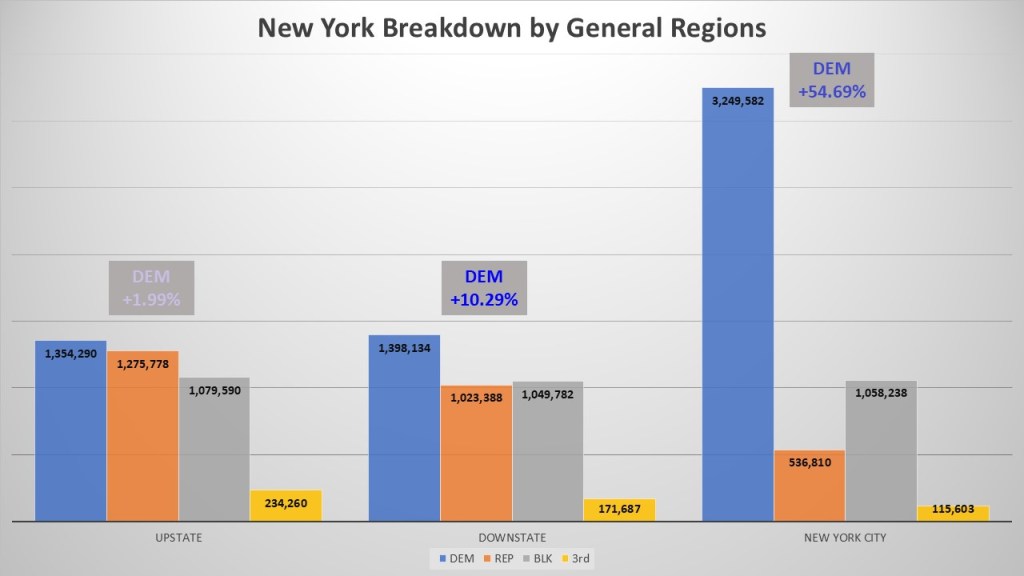
When people talk about New York State, they break it into three different macro regions: New York City, Downstate, and Upstate. For terms of this discussion, I will wade into the discussion of where upstate New York starts. Upstate New York starts Above the mid-Hudson line. I combined all regions north of mid-Hudson into the upstate region (Capital Region, Central New York, Finger Lakes, Mohawk Valley, North Country, & Western New York). Downstate are the regions directly bordering NYC (Mid-Hudson & Long Island). Democrats do well in downstate with a solid +10.29% advantage and non-enrolled are starting to overtake the GOP. Of course, in NYC the Democrats are dominant with a +54.69%. There are more Democrats alone in NYC as registered voters in the other two macro-regions individually.
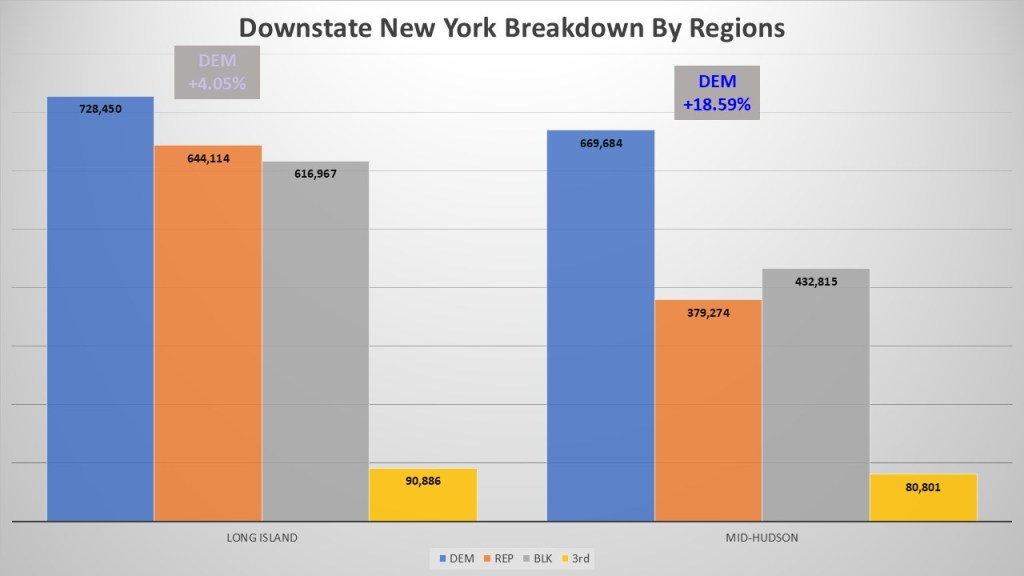
When we investigate the two regions in the downstate macro-region (mid-Hudson and Long Island) we do see a definite diversity. Long Island, which consists of Nassau and Suffolk Counties, is just barely Democratic with a margin of +4.05%. This political leaning is evident in the composition of their county governments, as well as their congressional and state representatives. Counties in the Mid-Hudson Valley, located outside New York City, show strong backing for the Democratic Party. Westchester, Ulster, and Rockland counties contribute to a notable regional shift toward the Democratic Party, reflected in a strong advantage of +18.59%. In Mid-Hudson we see the telltale sign of non-enrolled significantly outnumbering the GOP.
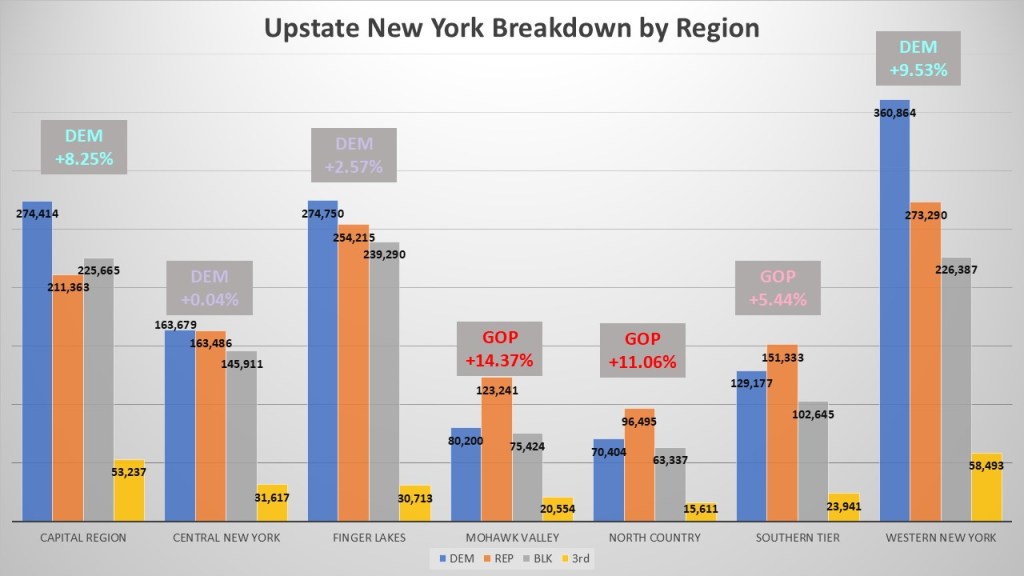
Since I defined upstate into one macro-region I wanted to show the individual regional breakdown as well. There are seven regions inside upstate, three have Democratic leans, two have GOP leans, and one, our home of Central New York, is almost dead even. Western New York is the most Democratic upstate region with +9.53%. The Capital region is second at +8.25% but is the only region where non-enrolled outnumbers the GOP. The Finger Lakes has a borderline Democratic advantage of +2.57%. Central New York is smack in the middle with less than two hundred voters separating Democrats and Republicans only a +.04% for Democrats. The GOP in the southern tier only just leans GOP +5.44% thanks to the heavy Democrat lean of Tompkins County. The North Country region is a solid republican lean (+11.06% GOP). The Mohawk valley, the only region without a blue leaning county, Has the biggest GOP advantage of +14.37%.
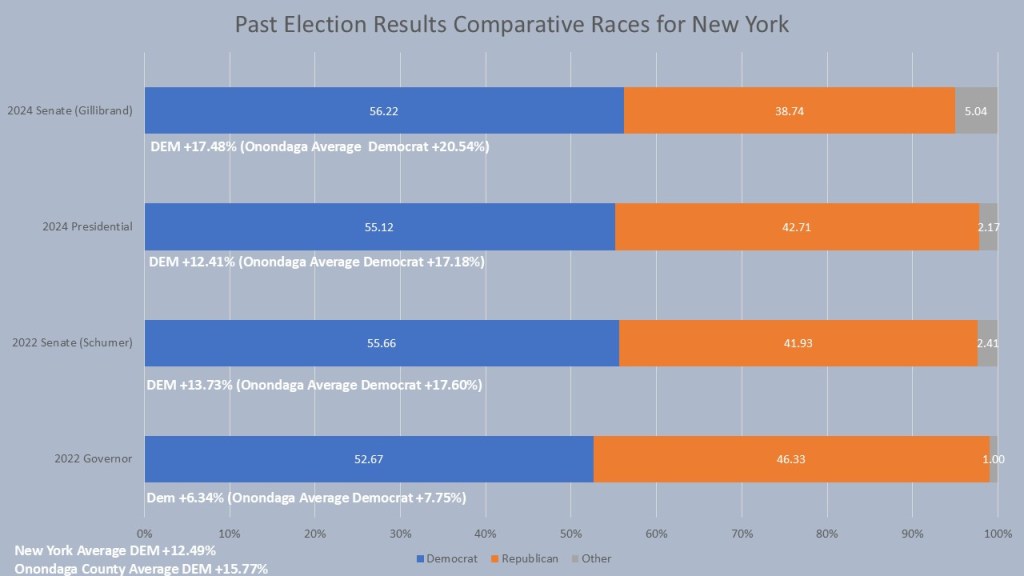
Lastly, we will look at four of the statewide races over the last two federal cycles and how Onondaga County relates to New York State as whole. In 2024 New York voted for Kristen Gillibrand for Senate by +17.48% while Onondaga County voted just to the left at +20.54%. In 2024 New York voted for Kamala Harris for President by +12.41% while Onondaga County voted more to the left at +17.18%. In 2022 New York voted for Charles Schumer for President by +13.73% while Onondaga County voted solidly to the left at +17.60%. In 2024 New York voted for Kathy Hochul for Governor by +6.34% while Onondaga County voted just to the left at +7.75%. On average of these four races New York voted for the Democrat candidate +12.49% while Onondaga County was +15.77%. So, on average Onondaga County is remarkably similar to New York in these races with just 2-3 points to the left.
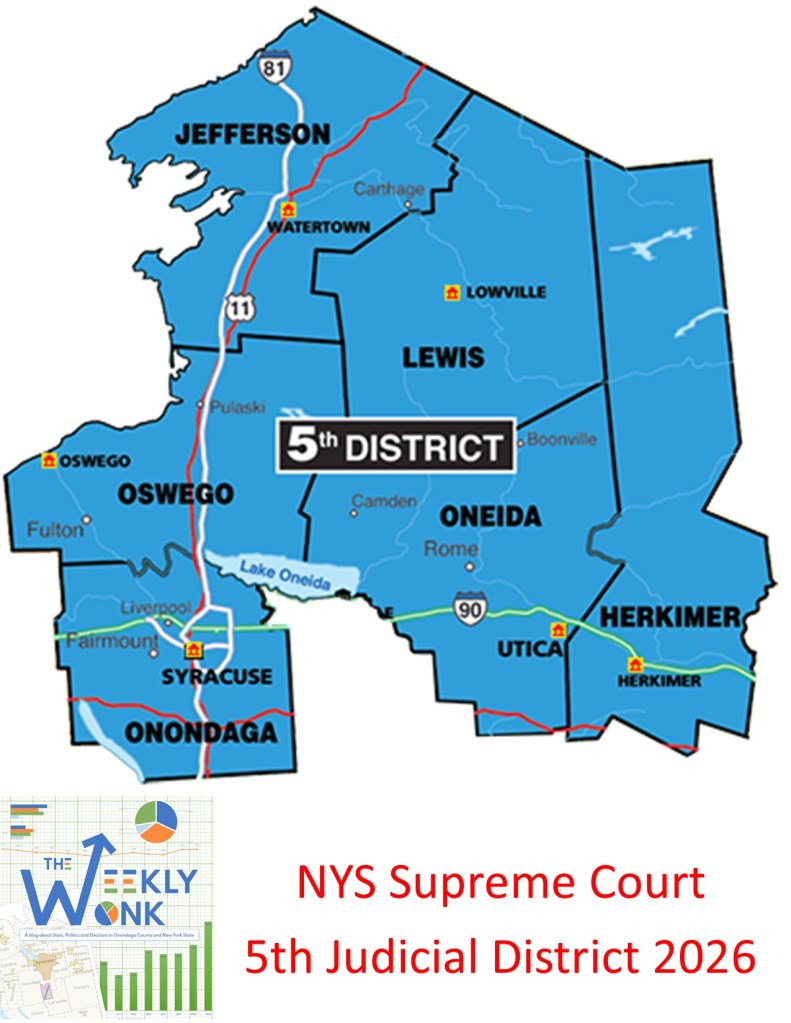
That is, it is for this week’s edition of the #weeklywonk. Next week I will look at the biggest political subdivision in New York, the Supreme Court district. Made up of six different counties, it is even larger than congressional district in terms of registered voters. This is part 2 of my 9-part series on New York races running in Onondaga County. As always you can subscribe to dustinczarny.com for all content and election news updates.
