Welcome back to #WeeklyWonk, my weekly column examining political data published on dustinczarny.com. Each week, I explore a political subdivision or election event in Central New York or across New York State, using voter registration data and election results to tell a broader story about our political landscape. This week, I turn to the race likely to generate the most attention in our region: New York’s 22nd Congressional District. In 2024, John Mannion flipped this district from red to blue after a decade of Republican control. If he wins reelection it will be the first time a Democratic Congressperson has won reelection since 1980. As he prepares to take a run at history, it’s worth taking a closer look at how the district is currently structured and what the numbers tell us.
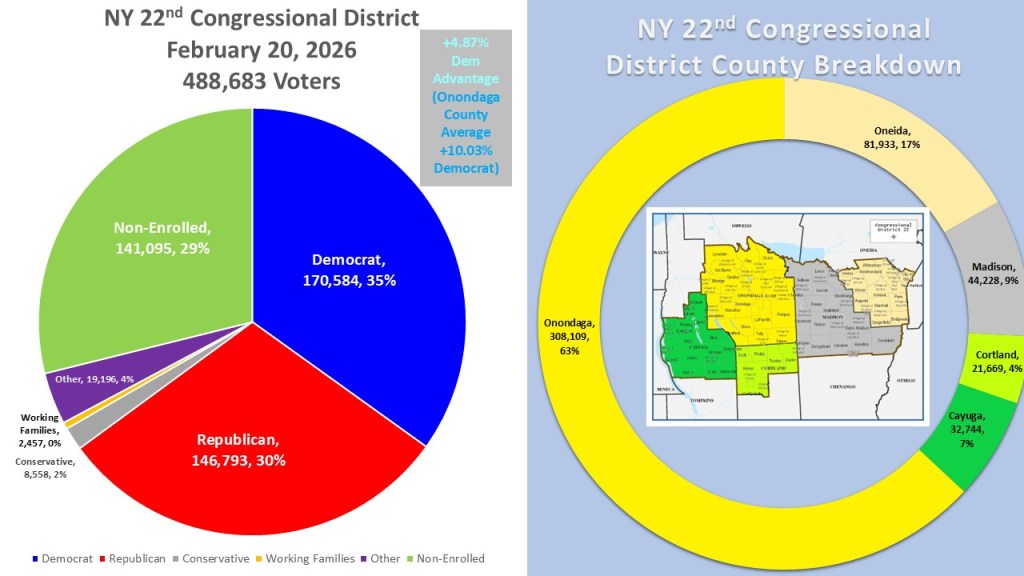
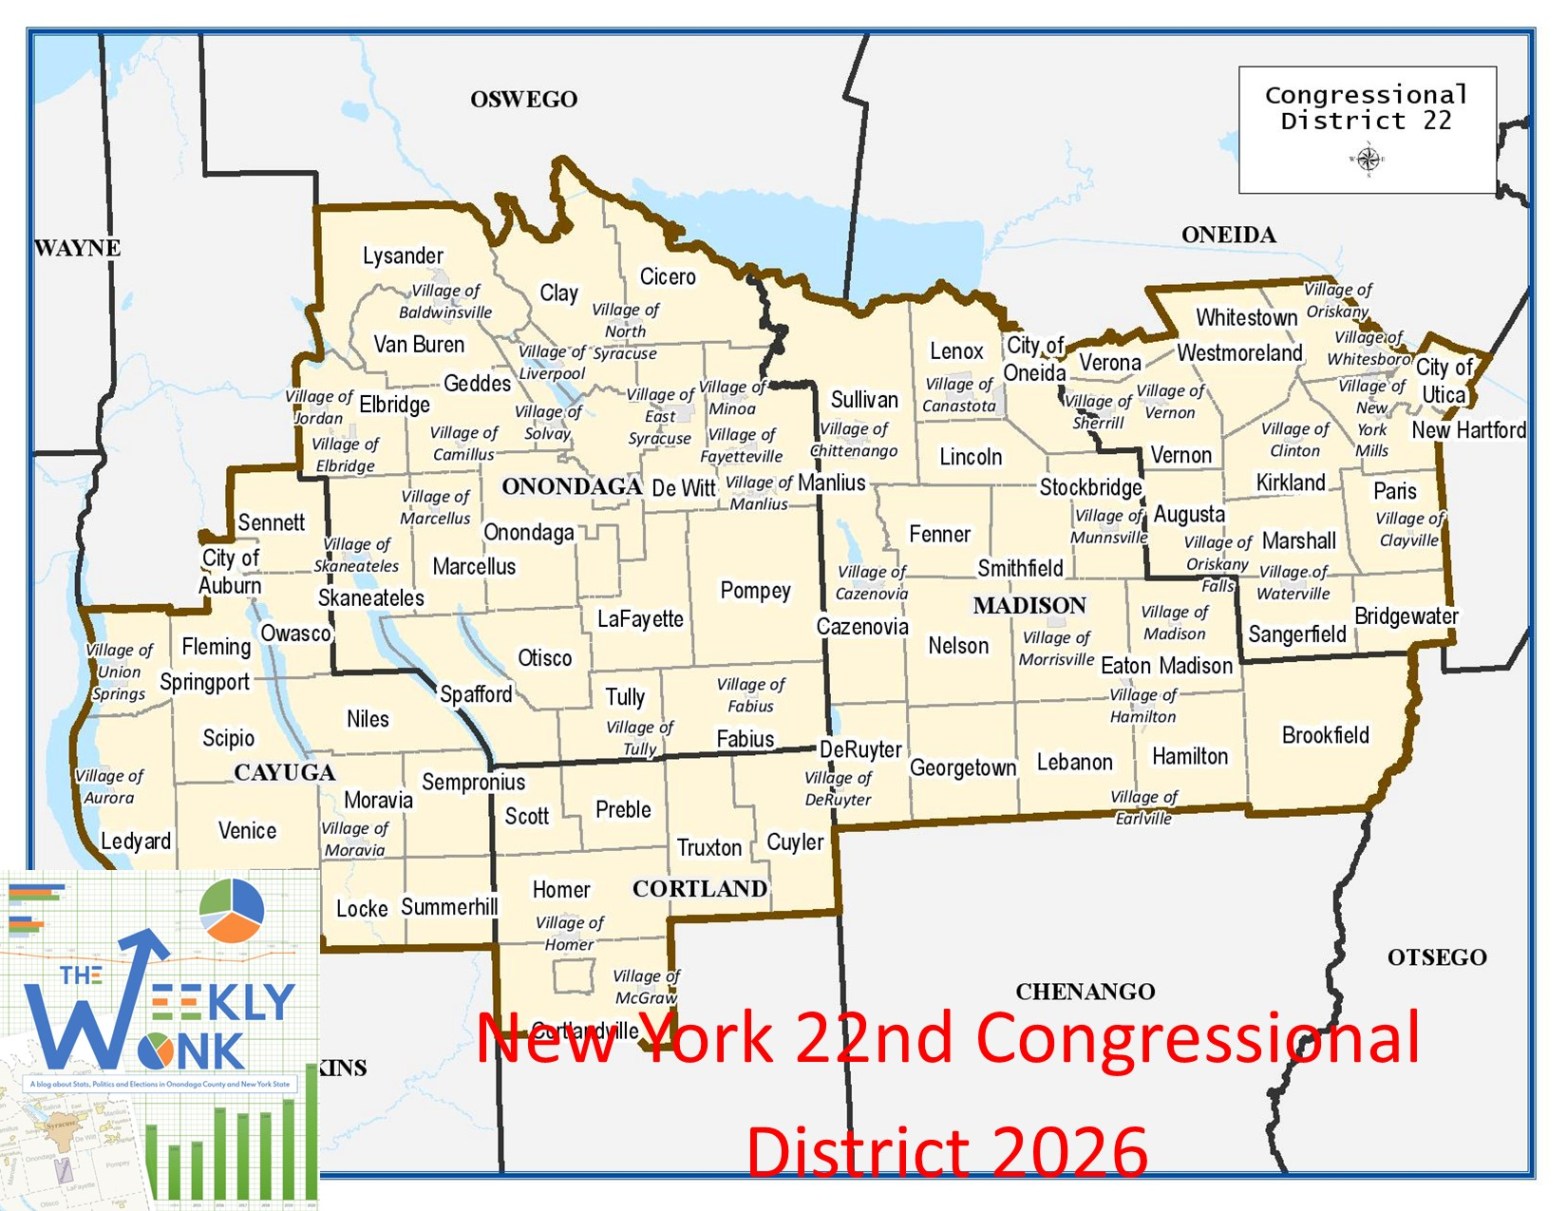
According to data from the New York State Board of Elections as of February 20, 2026, NY-22 has 488,683 registered voters. Democrats hold a plurality with 170,584 voters (35%). Republicans follow with 146,793 (30%), and non-enrolled voters are close behind at 141,095 (29%). Smaller parties make up the remainder: Other (19,196; 4%), Conservative (8,558; 2%), and Working Families (2,457; less than 1%). Geographically, NY-22 spans five counties: all of Onondaga and Madison counties, along with parts of Oneida, Cortland, and Cayuga. Onondaga County overwhelmingly dominates the district, accounting for 73% (308,109) of all voters. The Oneida portion contributes 17% (81,933), Madison 8% (44,228), Cayuga 7% (32,744), and Cortland 4% (21,669).
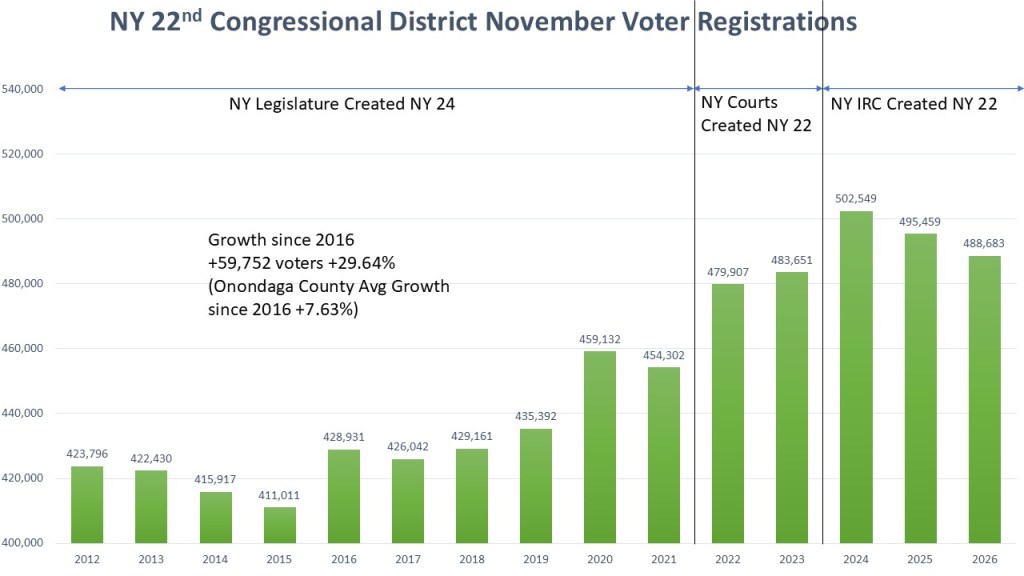
Any discussion of NY-22 must include redistricting. The Onondaga-based district has undergone three major configurations in recent years. The former NY-24 was created through a bipartisan legislative agreement in 2012. The contentious nature of that process led to the establishment of the New York Independent Redistricting Commission (IRC). However, in 2022, the IRC failed to produce a consensus map due to partisan divisions. The New York Supreme Court ultimately drew interim districts, and the Court of Appeals later directed the IRC to complete its work in time for the 2024 elections. Since 2016, the district has grown significantly, adding 59,752 voters—a 29.64% increase—due in part to redistricting changes and expanded voter registration access. By comparison, Onondaga County alone grew by just 7.63% during the same period.
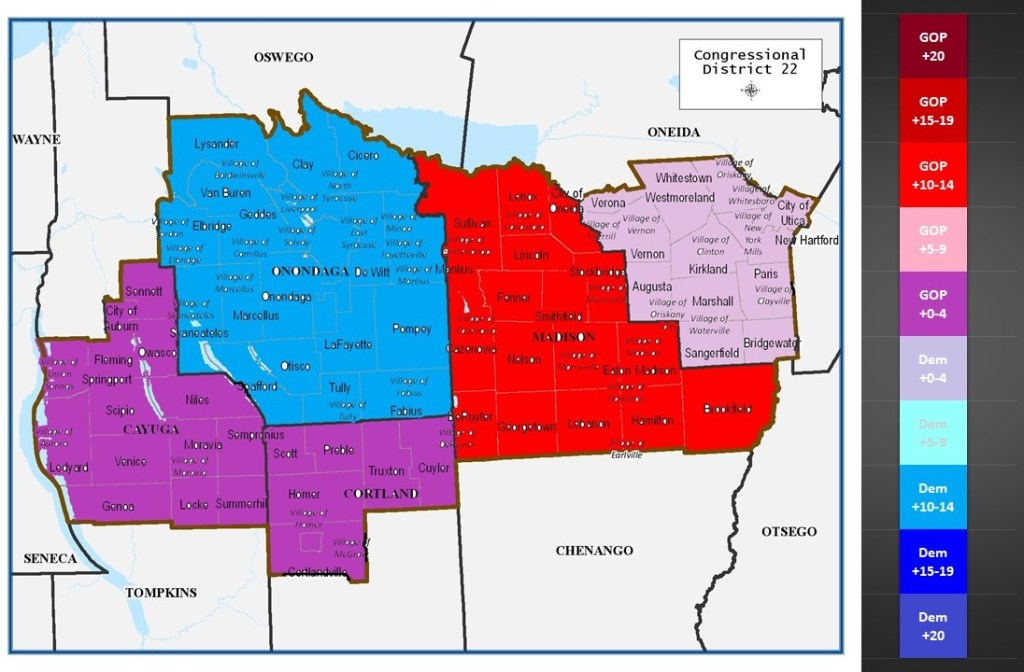
A geographic and partisan “heat map” of the district highlights its diversity. Onondaga County leans solidly Democratic by about 10–14%, while Madison County leans strongly Republican by a similar margin. The remaining counties are more competitive: the Cayuga and Cortland portions fall in the GOP +0–4% range, while the Oneida portion (including Utica) sits in the Democratic +0–4% range.
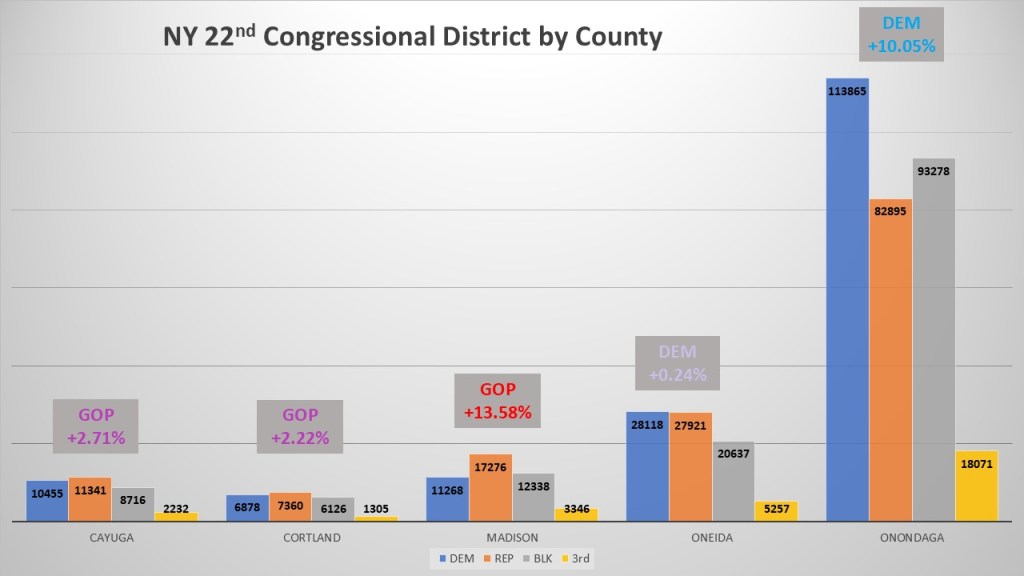
Looking at the county breakdown underscores just how dominant Onondaga County is. It contains more voters in each major category—Democrat, Republican, and non-enrolled—than any of the other counties individually. The smaller counties are relatively balanced and therefore exert limited influence on the overall partisan makeup. While Madison County shows a strong Republican lean (+13.58%), its size is not large enough to offset Onondaga’s Democratic advantage (+10.05%), which ultimately drives the district’s overall partisan tilt.
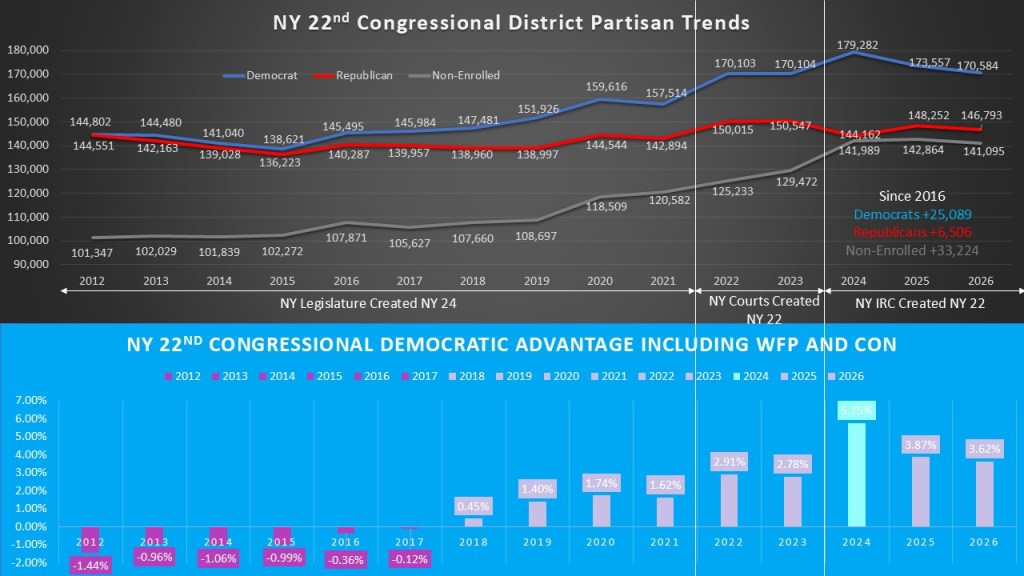
Over time, the Onondaga-based district has shown a clear trend toward Democrats. This shift began under the old NY-24 boundaries and continued through subsequent redistricting cycles. While the 2022 court-drawn map slightly favored Democrats, the 2024 IRC map provided the most advantageous configuration yet. Since 2016, Democratic registration has grown by 25,089 voters, compared to a Republican increase of 6,506. The largest growth, however, has been among non-enrolled voters, which increased by 33,224. Despite these gains, the district’s overall partisan lean has shifted more modestly. In 2021, Democrats (including Working Families and Conservative cross-endorsements) held a +1.62% advantage. By 2024, that margin had increased to +5.75%.
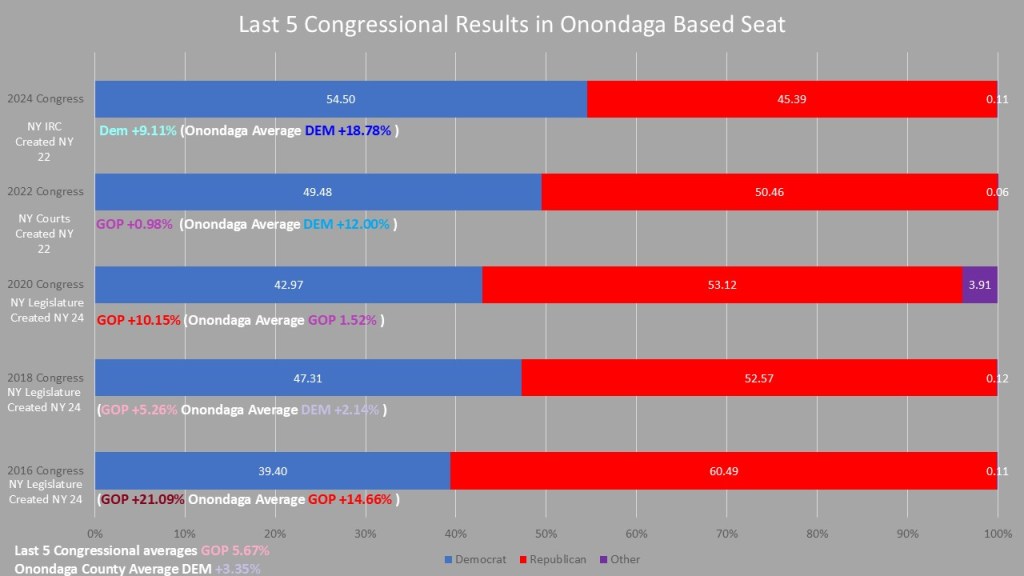
While I don’t currently have the tools to fully analyze comparable past races across changing district lines, we can still draw meaningful insights from recent elections—particularly within Onondaga County. Mannion’s decisive +9.11% victory in 2024 cannot be explained solely by the district’s modest Democratic lean. Instead, the key lies in Onondaga County’s performance. In 2018, Dana Balter won Onondaga County, and in 2020 she likely would have done so again if not for a split Working Families Party line caused by a paperwork issue. In 2022, Democrat Conole carried Onondaga by +12.00%, and in 2024, Mannion expanded that margin to an overwhelming +18.78%. Given Onondaga County’s size and influence, this trend has been central to the district’s Democratic resurgence.
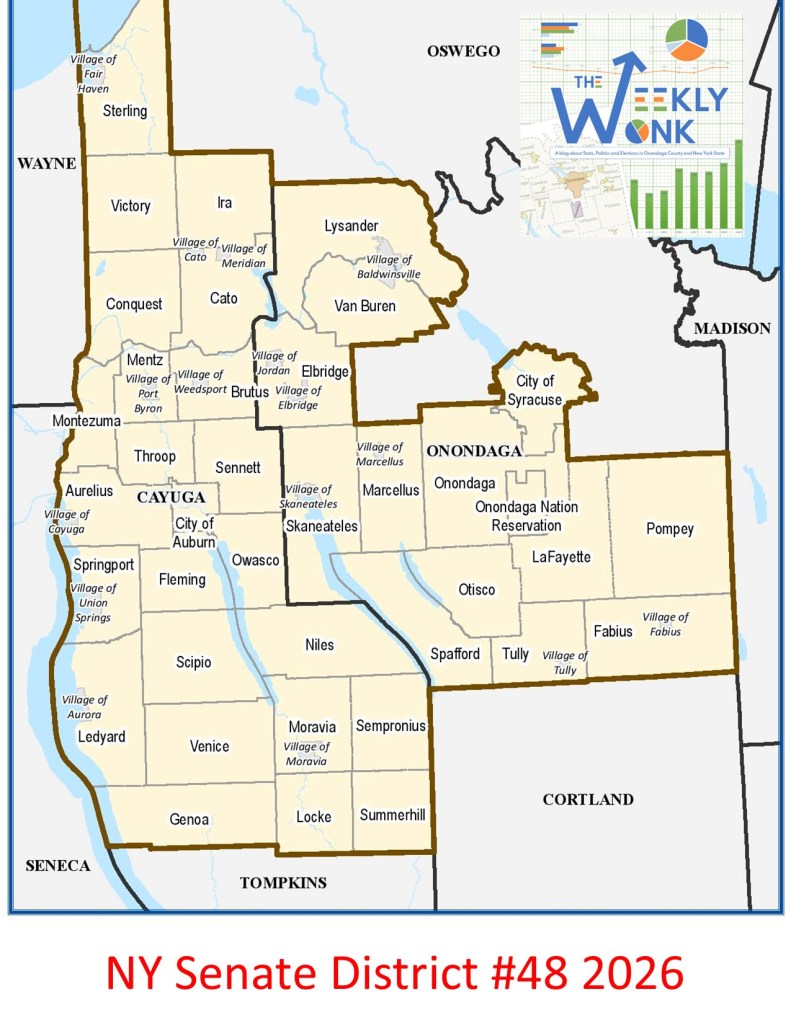
That’s it for this week’s #WeeklyWonk. Next week, I’ll continue my nine-part series on New York State offices, beginning with State Senate District 48, which includes parts of Syracuse and extends west into Cayuga County. As always, you can subscribe at dustinczarny.com for more updates and analysis.
