
Welcome back to #WonkyWednesday. Each week I do a deep dive into the election and registration data that makes up the electoral landscape of our home, Onondaga County. I have been on a two-month hiatus as the November general election required my undivided attention. However, I will be starting this series anew and the next few weeks we will look at the 2021 General Election and a facet of data so we can understand how Onondaga County voted this last year. The first data set we will look at is the most determinative factor of any election, turnout.
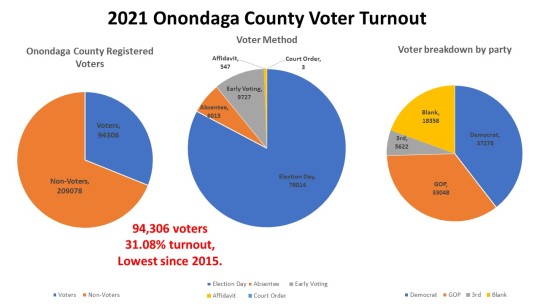
As we can see from the data, turnout was abysmal in Onondaga County in 2021. Just 94,306 voters turned out to vote in the General Election and a remarkable 209,078 voters stayed home. That is just 31.08% turnout and the lowest turnout in Onondaga County since 2015. Voters in Onondaga County continued to diversify the way they vote as well. While the overwhelming majority, 78,014, voted on Election Day, 9,727 voted Early and 6,015 voted by absentee, 547 voted by Affidavit, and 3 voted by court order. These are increases since the last local election in 2019 and in the coming weeks I will dive more into the alternate voting methods. Not surprisingly more Democrats, (37,278), voted in 2021 than GOP, (33,048), Blank/Non-enrolled (18,358), and 3rd Party voters (5,622). This order follows the enrollment order in Onondaga County, but the rates are much different.
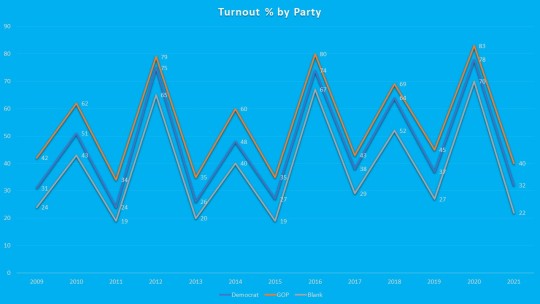
Republicans continue to turnout in higher percentage rates than all other parties in every election on record since 2009 (this is the date I have readily available data on record at the Onondaga County Board of Elections). In 2021 no part had stellar turnout percentages. The GOP did lead in voter turnout at 40%. Democrats, though outnumbering GOP enrollment and raw turnout, were only able to turnout 32% of its enrollment. This 8-point deficit from the GOP mimicked the same deficit we saw in the last local election, 2019. While Blank voters always trail the two major parties, the 10-point deficit from Democrats and 18-point deficit from the GOP is again basically the same as in 2019 though at lower rates. The lack of participation percentages by Democrats and Non enrolled in local elections is one of the reasons we see a blue county like Onondaga struggle to elect Democrats outside the City of Syracuse on a consistent basis.
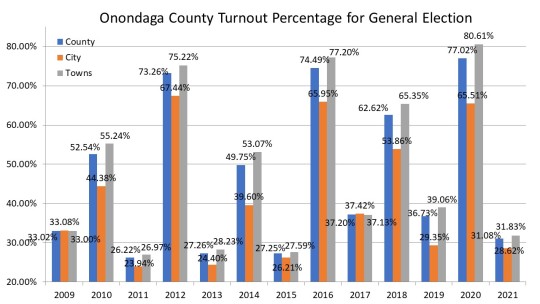
After a 4-year trend of rising turnout in comparative elections, culminating with the highest turnout in percentage and raw vote totals in Onondaga County history in 2020, turnout cratered overall in 2021. The County posted its lowest turnout rate since 2015, and the lowest turnout rate in a mayoral cycle since 2013. This is notable since the mayoral election was unchallenged in 2013 with Stephanie Miner running unopposed. In 2021 the City of Syracuse turnout rate of 28.62% lagging behind the Towns at 31.83%. In 2017 and 2009 with competitive mayoral races the city equaled the turnout rate of the County and surrounding towns. In 2013 without a mayoral race, it trailed towns by just over 3%. Despite a three-way race for mayor in 2021 the city turnout more reflected the 2013 race trailing again by 3%. This certainly accounts for some of the lack of turnout however the Towns still had a pathetic turnout rate as well, again their lowest on record since 2015.

The City of Syracuse gets a lot of media focus, specially during mayoral years. It is important to remember though that the city is only a little over 31.1% of the population of Onondaga County, and just 23.2% of the voter enrollment of Onondaga County. The lower enrollment rate along with historically lower voter turnout usually means an exceedingly small percentage of the actual cast votes. In 2021 that was on display with just 20,174 of the voters coming from the City of Syracuse representing only 21.4% of the votes cast.
This concludes my #wonkywednesday for this week. Over the next few weeks, I plan in-depth review of the 2021 Onondaga County General Election. My series will look at Early Voting, Absentee & Affidavit Voting, Democratic Gains and Losses, and Enrollment percentages of the adult population of Onondaga County. There may be a few redistricting articles thrown in as Onondaga County and the NY State Redistricting maps are approved and released over the next 3 months as the City of Syracuse is targeting September of 2022.
