
Welcome back to #wonkywednesday. Each week examine an aspect of electoral data and analyze it. I hope by doing so we get a better picture of our home in Onondaga County and beyond. This week I am investigating registration rates in Onondaga County. Every ten years we get reporting back on population numbers from the US Census. This gives us a rare opportunity to glance at registration rates of the 18+ population in our various towns and cities inside Onondaga County.
A quick note about the methodology of this #wonkywednesday. This should not be depended on as exact statistics but used to compare the different communities in our county. The Decennial US Census does not ask a citizenship question. This means a portion of their 18+ population are not eligible to register to vote but we are unable to determine the size. The America Community Survey has better data on this and will be released by the Census Bureau in 2024. However, for today I will use the data from the Decennial Census from 2010 and 2020. I will compare that data with registration data collected by Onondaga County and State Board of elections in October of each of those years. This will give us a snapshot of what our communities looked like regarding registration rates during those months.

In New York State the Census estimated a population of 20,201,249. Of that population it estimated that 20% were under the age of eighteen, meaning 16,088,135vitizens of New York are over the age of eighteen. NYS Board of Elections showed 12,363,072 registered voters in October of 2020 meaning an estimated 76.85% of the over eighteen population were registered to vote in New York. In Onondaga County we are ahead of where the rest of the state stands. Of our population of 476,436 the Census estimates 377,786 are eighteen and over. In October of 2020 Onondaga County had a record 308,338 registered voters equating to a registration rate of 81.62%.
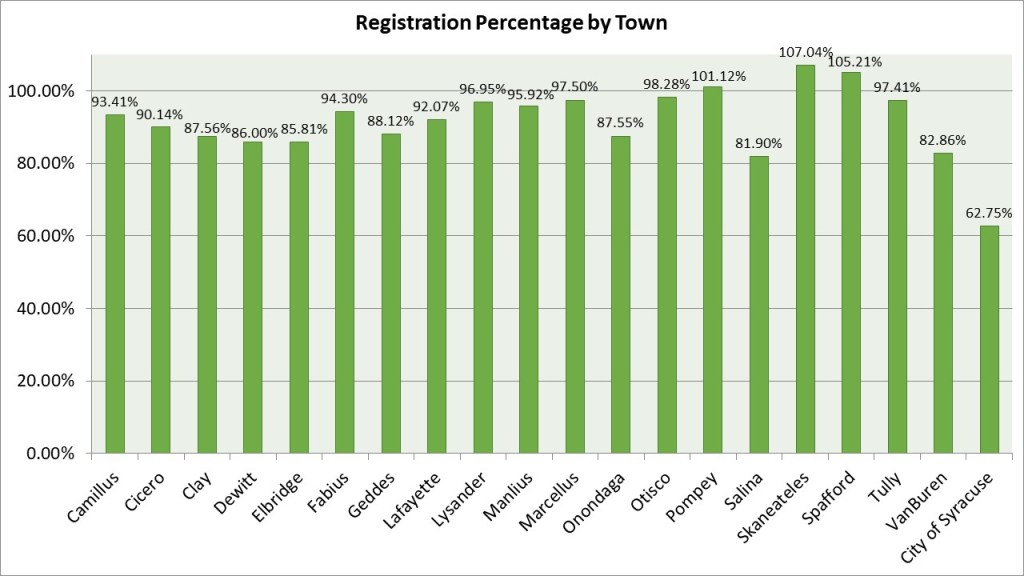
Breaking down the registration rates inside of the towns and cities of Onondaga shows us where we need to improve. The City of Syracuse is the least estimated registration rate for the County with just 62.75% estimated 18+ population registered to vote. The Towns are substantially registered. It is interesting that the two towns that are least registered could not be more different. The Town of Salina has a registration rate of 81.9% and is a large suburban town. The Town of van Buren is a smaller more agrarian town and is second least registered at 82.86%.
You may notice three towns have higher than 100% registration rates (Pompey, Skaneateles, & Spafford). That is an undercount of citizens in these smaller towns having an outsized effect as well as registration date comes later in the year. Registration numbers were culled from October of 2020 while self-response surveys were done in March and April of 2020 whereas door to Door surveys proceeded until mid-October. As we approached the 2020 election more citizens registered to vote than ever before which led to the highest turnout in generations.

As we look inside the City of Syracuse, we can see the different registration rates amongst the city wards. The lower rates in the wards 1-4 may be directly tied to our large immigrant communities in the northside of Syracuse. Eastwood (5) & Strathmore (11&12) are fairly highly registered. It is a little surprising that the valley has such a dichotomy with as it consists of the 13th and 14th ward with both doing drastically different. The university area in the 16th ward is one of the lowest and that is not surprising as students may count as population in Syracuse but remain registered to vote back home. This also stretches to 17th and 19th ward which has significant student rental housing. The hardest hit area of our city, the beleaguered 15th ward is also the lowest registration rate at just 22.64%. The shadow of eighty-one has not only produced abject poverty but first-year student housing which are traditionally two of the least registered populations.

The good news is it looks like New York and Onondaga County has made progress in the percentage of registered voters. When comparing from 2010 Census and registration data New York State grew by almost 6%. Onondaga County also saw growth in overall registered rate by a little over 4.65%. A substantial portion of those gains came in the suburbs which grew over 6.24% while the City of Syracuse grew just over 1%. Registration changes like online DMV registration is one of the main factors as its implementation in 2016 correlates with the increase in voter registration numbers. The implementation of portable registration in 2019 also has helped keep people properly registered. As online and voter registration come online it will be interesting to see if New York and Onondaga County see registration rate increases in the 2024 American Community surveys as well as the 2030 Census.
That is all for this week. Next week I have fresh data from the Annual Reports counties give to the State Board of Elections. We will compare some aspects in that report, namely staffing and Budget levels, as well as Commissioner compensation. See you next week.
Subscribe to get updates on all Election news and content
