
Welcome back to #WonkyWednesday. Each week I take a deep dive into the electoral and registration data that make up Onondaga County and New York State. Over the next few weeks I will be investigating the City of Syracuse. Usually I dedicate #wonkywednesday articles to races happening in the current year, however there are no races in Syracuse this year. I have decided to spend the next several weeks highlighting Syracuse because an important process is underway. The Syracuse Independent Redistricting Commission will be holding 5 public meetings over the next 7 weeks to develop their draft redistricting plan. This citizen led redistricting process depends on you to give input before they redistrict the five common council districts that make up our city. At the end of this article I will post the next meeting times so you can attend.
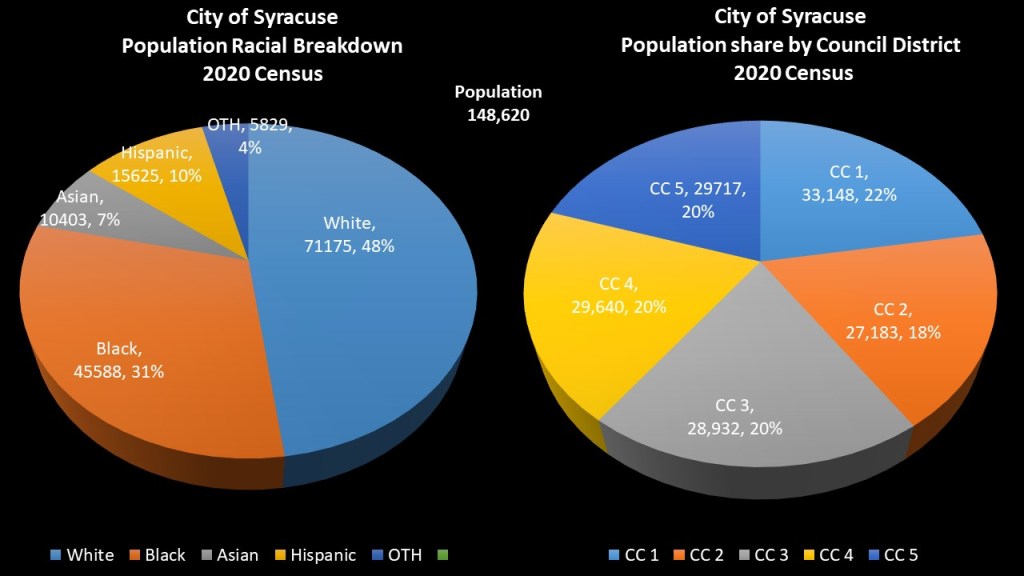
In the 2020 Census the City of Syracuse was reported to have 148,620 in the 2020 Census. The racial makeup of the City according to the census is 48% white, 31% Black, 10% Hispanic, 7% Asian and 4% other. The City of Syracuse has not undergone redistricting since 2002. The Council failed to enact redistricting after the 2010 census. Districts should average approximately 29,700 population. This has resulted in an imbalance in the 5 common council districts. Common Council district 1 is way over populated with 33k population. Common Council District 2 is very underpopulated with just 27,183 citizens. Common Council 3 is slightly under populated with 28,932 voters. Common Council 4 (29,640 citizens) and Common Council 5 (29,717 citizens) are near the average.
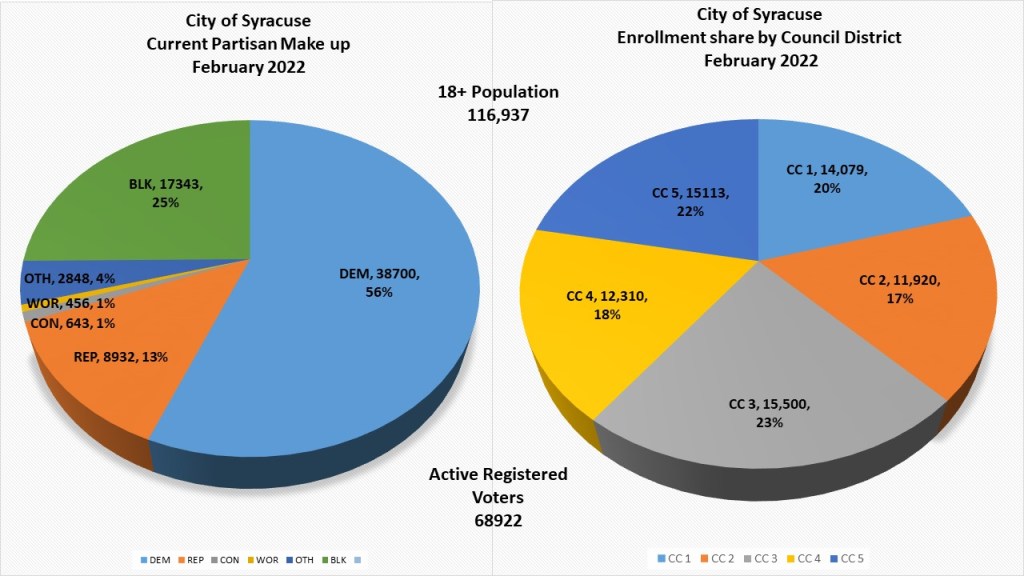
The City of Syracuse has definitive Democratic partisan lean. 56% of the City of Syracuse is Democrat followed by 25% of the City Blank or non-enrolled. The GOP actually comes in a distant 3rd with just 13% of the registered voters. As far as registered [population, the current registration only 58.9% of the 18 over population. Much of the unregistered in the city though may not be able to register with a high concentration of the non-citizen population. Also students at SU and Lemoyne who may be registered at their home address. When we look at the common council districts we see that population sometimes corresponds with registered voters. Average for 68,922 voters is 13,784. Though CC 1 is the most populous district, it is middle of the road in registered voters at 14,079. CC2 though is lagging in registered voters as it is in population at just 11,920 voters. CC 4 is of average population but under registered at 12,310 voters. CC 5 and CC3 are actually over the average for registered voters both topping 15k.
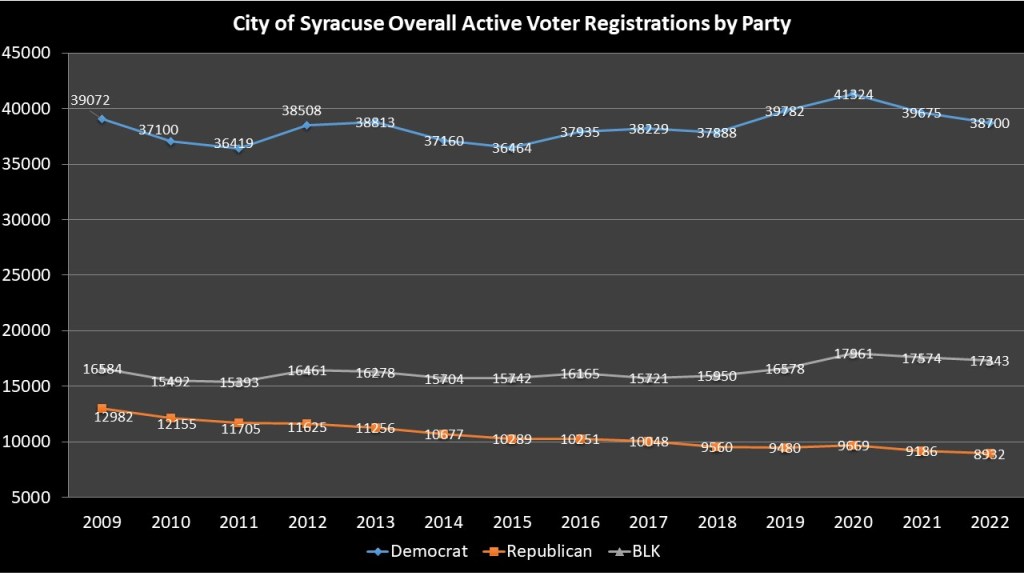
Democratic domination of the City of Syracuse in registered voters is not a new phenomenon and it is only getting worse over time. Democrats have stayed about even in raw registration numbers with a small loss of 372 voters since 2009. Republicans have lost 4050 voters since 2009. The story that seems to be told in the City of Syracuse may be the rise of non-enrolled voters. They have gained 759 voters since 2009 and well distanced themselves from the GOP cementing 2nd place. While the Non-enrolled are gaining on the Democrats it will still be a long time, if ever, they will catch up as they are less than half the current enrolled Democrat number.
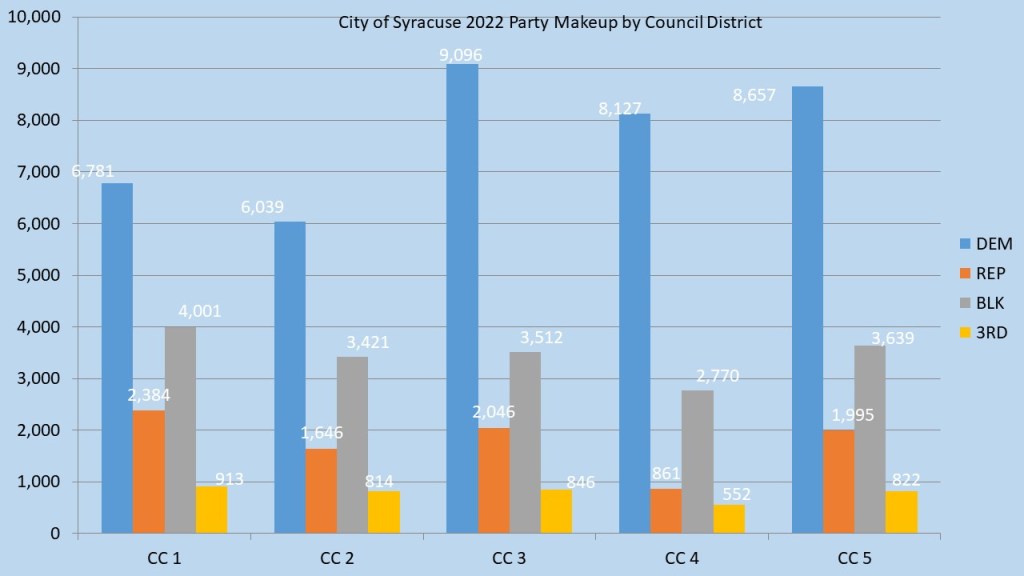
As we can see the district breakdowns reflect the city as a whole. Last year for only the second time in City history, Democrats won every district seat on the Syracuse common council. The districts vary in Democratic advantage but all are solidly blue. Even the last district that was in GOP hands, District 1, has a 3 to 1 advantage for the Democrats. In every district the non-enrolled outpace the GOP by a wide margin.
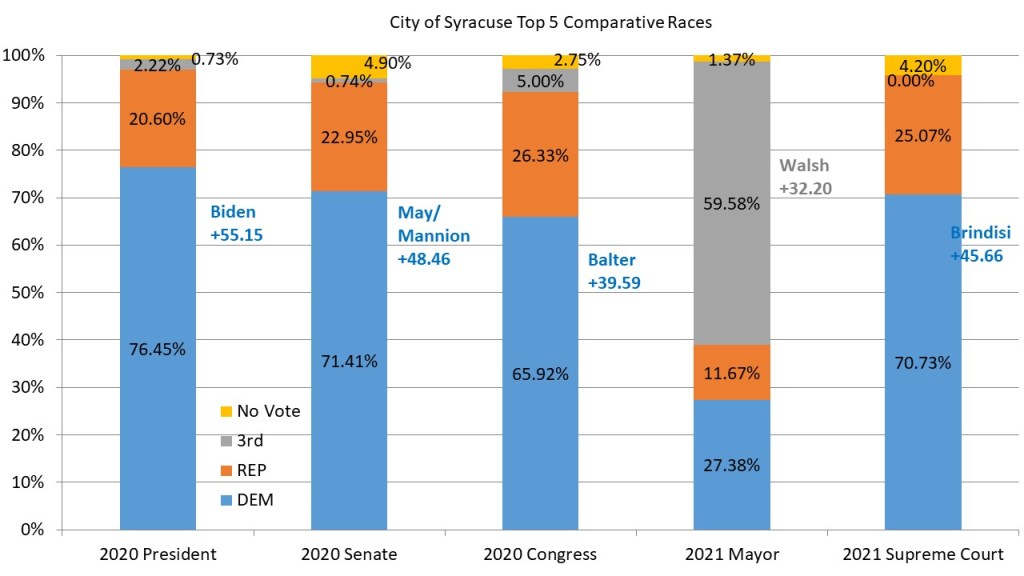
For our #wonkywednesday articles this year we will be using 5 races to compare how the subjects of our articles perform. We will be using the Presidential, State Senate, and Congressional races to see how our subject performs in a high turnout federal year. We will also use last year’s Supreme Court Race for a base on how the voters in the district react in a low turnout year. For the City of Syracuse I am including last year’s mayoral race as well. The City of Syracuse performs for the most part how you would expect the registration to perform. Biden won by over 55% in 2020 in the City of Syracuse. The NYS Senate races also did very well combining for an over 48 point margin in 2020. Dana Balter had nearly a 40 point margin out of the city, though 5 more points were wasted on the WFP line. Anthony Brindisi in a GOP friendly year still managed a 45 point victory out of the city. Given all that it makes Walsh’s victory in 2021 even more impressive. His 3rd party run had a 32 point victory in 2021 winning with well over a majority of the vote.
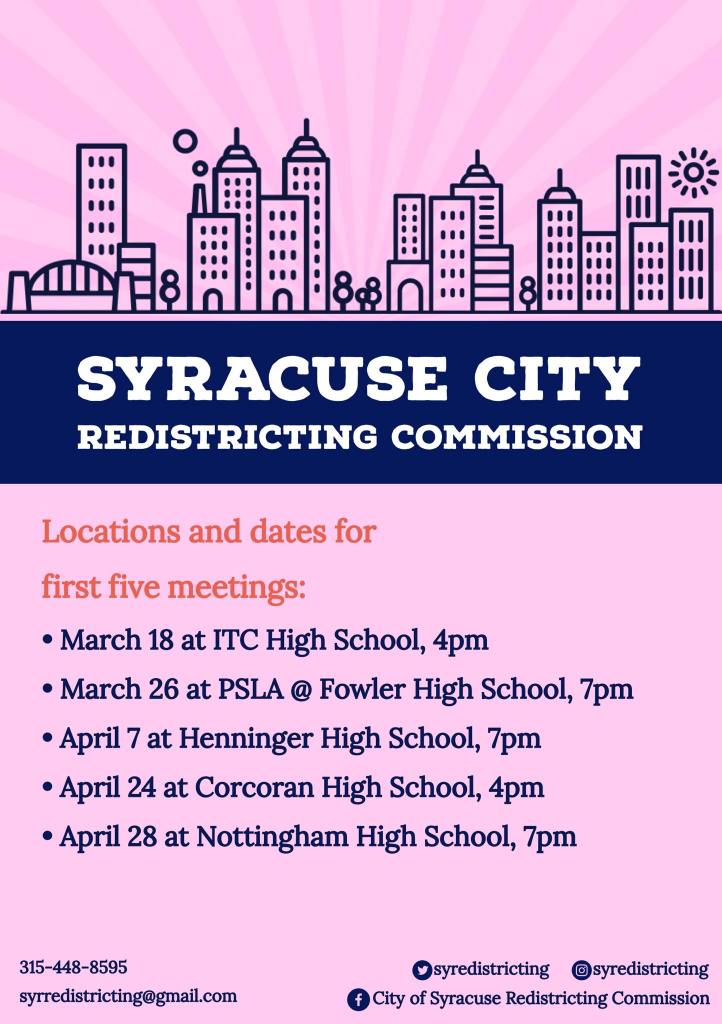
The City of Syracuse Independent Redistricting Commission will meet 5 times over the next seven weeks to hear from the public on what they want from their new districts. They will be holding hearings at each of the city high schools. The first redistricting hearing will be at 4pm Friday March 18th at ITC High School at 4pm. The next four meetings will be March 26 PSLA at Fowler High School 7pm, April 7 at Henniger High School at 7pm, April 24th at Corcoran High School at 4pm, and April 28th at Nottingham High School at 7pm. You can give testimony about what you would like to see in your city for the next ten years.
Over the next few weeks we will delve into each of the 5 current districts starting with Common Council district 1 next week.
Subscribe to dustinczarny.com for election information and content updates.

3 thoughts on “Wonky Wednesday: The City of Syracuse”