
Welcome back to #WonkyWednesday. Each week I take a deep dive into the electoral and registration data that make up Onondaga County and New York State. Over the next few weeks, I will be investigating the City of Syracuse. Usually I dedicate #wonkywednesday articles to races happening in the current year, however there are no races in Syracuse this year. I am continuing my run of Syracuse articles to highlight the Syracuse Independent Redistricting Commission will be holding three more public meetings over the next 3 weeks to develop their draft redistricting plan. This citizen led redistricting process depends on you to give input before they redistrict the five common council districts that make up our city. At the end of this article, I will post the next meeting times so you can attend. This week I am focusing on the most diverse Common Council District, Common Council #4.

In the 2020 Census the 4th Common Council district had 29,640 residents. This means the 4th Common Council district sits directly in the middle in terms of population of all five districts and near the ideal average of 29,724. The racial makeup of the Common Council 4 according to the census is 41% white, 39% Black, 10% Hispanic, 8% Asian and 2% other. This makes it the most diverse district of all five in the City of Syracuse. However even with this diversity it is still a White plurality district. Voter registration wise it is 66% Democratic, 7% GOP, 23% Blank or non-enrolled. This is the most Democratic of all five districts but with just 12,324 registered voters it contains the least number of registered voters of all five districts.
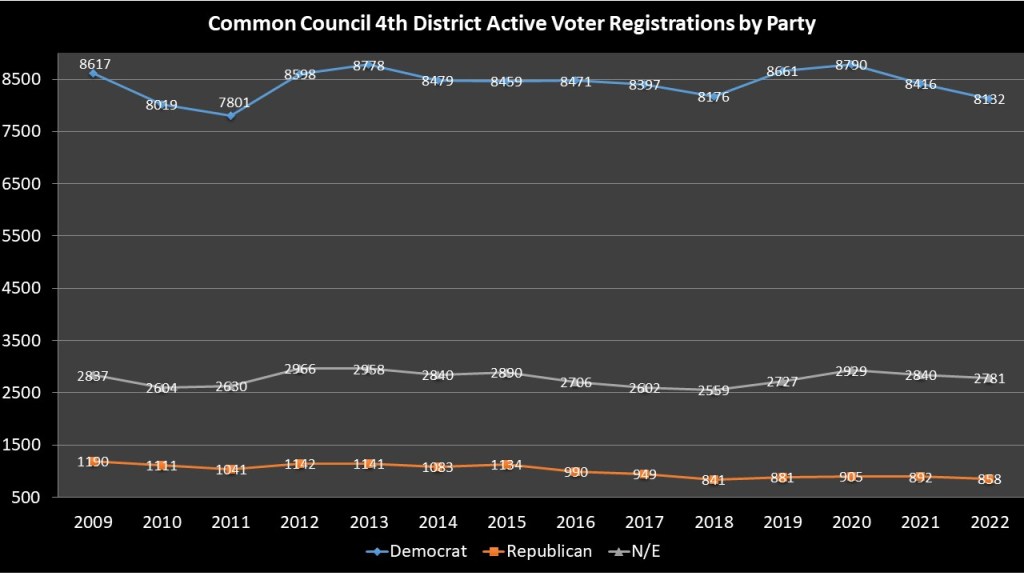
This district has always been a tremendously Democratic district. Since 2009 Democrats have lost 485 voters. Once again though the change is in GOP enrollment decline. The GOP has lost 332 voters since 2009 and is solidly in third place. The N/E has also lost voters since 2009, losing fifty-six registrants. More than any other district the voter registration declines and gains are based on the year and rolls with Presidential elections. Syracuse University makes up a large part of this district and urban cores also suffer from registration lapses in between Presidential years.
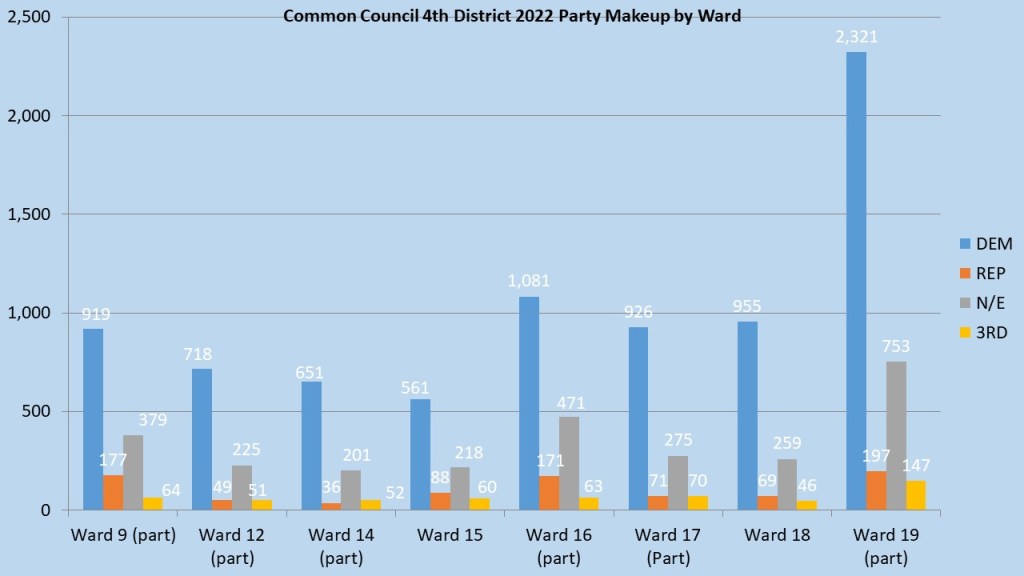
The third Common Council district stretches over five different wards inside the city. It has parts of the 9th, 12th, 14th, 16th, 17th, 19th wards and all of Wards 15 & 18 wards. Though two inner city wards are encompassed in the fourth district, the district is dominated by the 19th ward portions. This award is made up of two distinct portions of urban low-income residents west of I81 and university populations east of 81. Also, the main campus of Syracuse University (16) and Westcott neighborhood (17) acts a balance to this district setting up two halves in terms of diversity and population. No matter the portion of the district though the Democrats dominate every portion with the non-enrolled dwarfing the GOP.
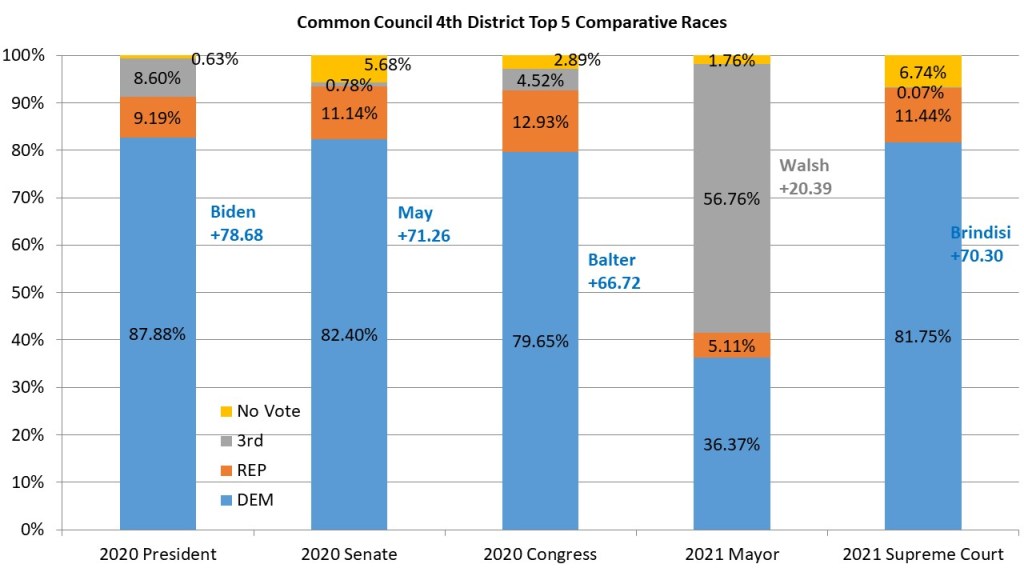
For our #wonkywednesday articles this year we will be using five races to compare how the subjects of our articles perform. We will be using the Presidential, State Senate, and Congressional races to see how our subject performs in a high turnout federal year. We will also use last year’s Supreme Court Race for a base on how the voters in the district react in a low turnout year. For the City of Syracuse, I am including last year’s mayoral race as well. The 4th Common Council District predictably is the most reliable Democratic performing district in Syracuse. In 2020 Biden won this district by 78.68 points, Rachel May won this district by 71.26 points, and Dana Balter won by 66.72 points. In 2021 Anthony Brindisi performed well here winning by 70.30 points. Despite this being the most diverse district Mayor Walsh still won this district by 20.39 points. However, we should note this is the most competitive district for the Democratic candidate Khalid Bey and it is likely the diversity of this district played a role.
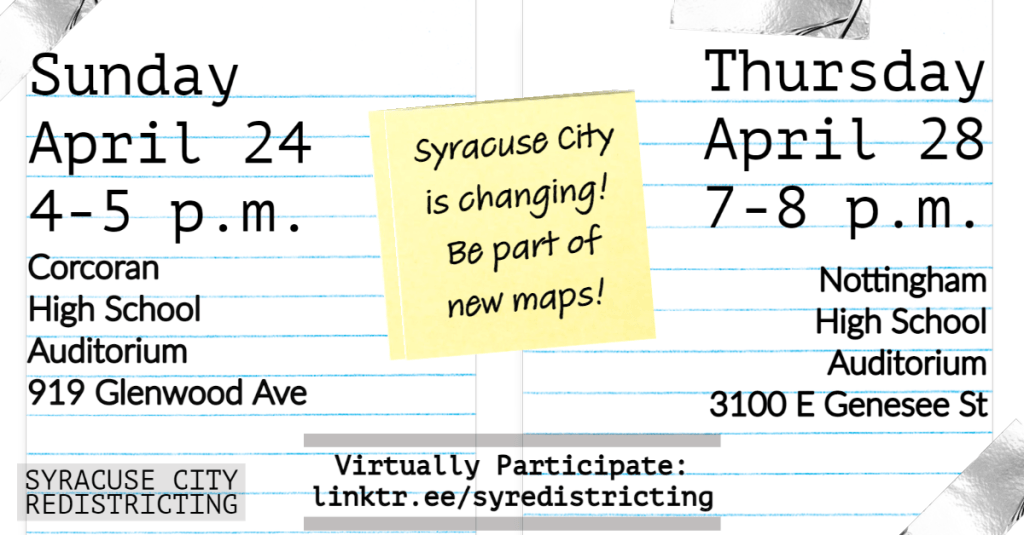
The City of Syracuse Independent redistricting Commission will meet four more times over the next six weeks to hear from the public on what they want from their new districts. They will be holding hearings at each of the city high schools. The first redistricting was on Friday March 18th at ITC High School, and the second at Fowler PSA on March 26th, and third hearing was at Henninger High School at 7pm. You can watch the live streams from Fairmaps CNY here. The final two pre-draft meetings will be April 24th at Corcoran High School at 4pm and April 28th at Nottingham High School at 7pm. You can give testimony about what you would like to see in your city for the next ten years. In May they will release draft maps and another round of hearings will begin.
Subscribe to dustinczarny.com for election news and content updates
