
Welcome back to #wonkywednesday. Each week I take a deep dive into the electoral and voter registration data that makes up our home here in Onondaga County and across New York State. Once again I revisit how redistricting is impacting our county. This time we take a look at the final maps ordered by the court for Congress and State Senate. After a long drawn out process we finally have the maps that determine the districts which our candidates will run to represent us this fall. I take a quick look at the changes from the old maps, the legislative maps ruled unconstitutional, and the final maps imposed by the courts.

The court has drawn Onondaga County into the #NY22 congressional district. This district contains all of Onondaga, Oneida, and Madison County. Curiously it also contains a portion of the village of Cleveland on the north shore of Oneida Lake in Oswego County as well. For the purpose of this article I can’t really include those 340+ lost souls in the data yet. This district is a radical change from the old #Ny24 which went North and west encompassing Cayuga, Wayne and a Portion of Oswego County. The Legislative maps ruled unconstitutional had Onondaga County in the center pf a district going southwest encompassing Cayuga and portions of Geneva, Cortland and all of Tompkins county as well as goring east through Madison and into Utica. According to Dave’s Redistricting App released by the special master the new #NY22 is a D+5.1 and deemed a competitive district.

Compiling registration data from the three main counties in the district #NY22 is dominated by Onondaga County which makes up 63% of the district. Madison country is 9% and Oneida County is 28%. Enrollment wise Democrats have a plurality at 35%, Republicans at 31%, and Non-Enrolled at 26%. While Democrats have the edge on paper we have to look into the performance of the district to see exactly how this new district might perform.
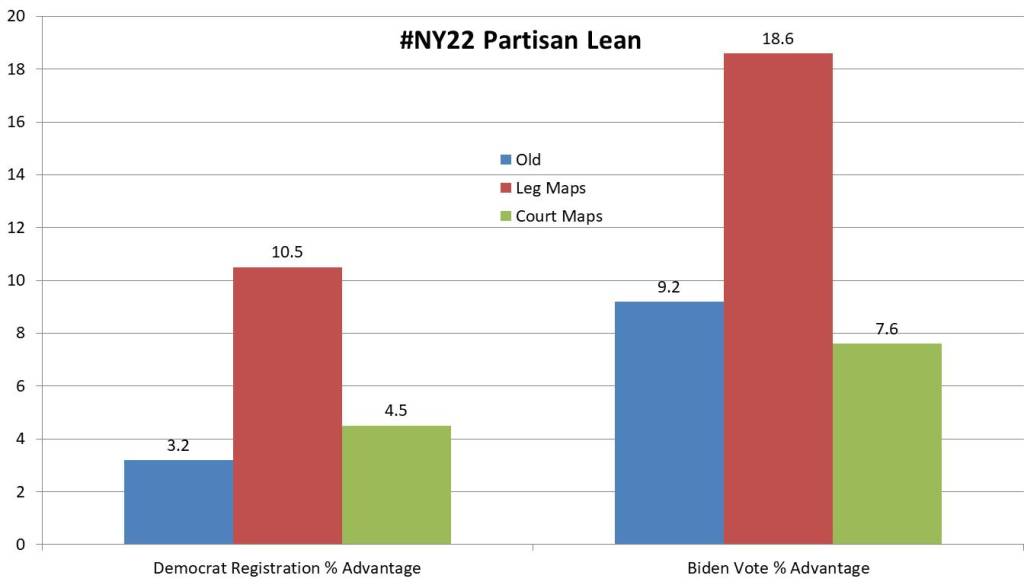
It is helpful to see how this district evolved over the three variations we have had since the beginning of redistricting in January. The old #NY24 had a Democratic enrollment edge of +3.2% and the district voted for Biden in 2020 by +9.2%. The district the NY Legislature sought to create grew the registration advantage to +10.5% and that new district would have voted for Biden by a commanding +18.6%. The final district has a +4.5% enrollment advantage for Democrats and the district voted for Biden at a rate of +7.6%. So Democrats make up a higher percentage of the enrollment population from the old district, in performance it did not support Biden as much. One possibility here is the non-enrolled portion of the new #NY22 is more conservative than the old #NY24.
The new #SD48 may be the district that has gone under the most dramatic change throughout the entire legislative process. The original district encompassed most of the City of Syracuse and went north through Salina and Cicero, south through Fabius, Pompey, Lafayette and Tully into Madison County and had a tiny portion of Oneida. The legislative maps took out Salina and Cicero and added portions of Cortland and even more of Oneida County to add Utica. The final maps by the special master flip the switch, after first having a draft that had #sd48 in the north of Syracuse, the final map has the City of Syracuse wholly inside it with Lysander, Van Buren, Elbridge, Marcellus, Onondaga, Onondaga Nation, Lafayette, Pompey, Spafford, Otisco, Tully, Fabius as well as going west to capture all of the county of Cayuga. Dave’s Redistricting App rates this as A D+16.8 and seen as a safe Democratic seat.

Onondaga County once again dominates this district making up 75% of the voter enrollment with Cayuga County making up just 25%. The enrollment of the district is definitely leaning clue. Democrats makeup the plurality of the district at 39%. The GOP is just 28% of the district with the non-enrolled right behind at 26%. 3rd parties makeup the rest of the 7% of the district. The cities of Syracuse and Auburn being wholly inside the district certainly lends to the blue tinge of the voter registration.

This is one of the rare districts that Democrats may have benefitted from the Special Master than their own legislative lines. The old district (#sd53) had a Democratic registration lean of +13.65 points. The NY legislative maps actually made the district a little more Red, dropping the registration advantage to 13.22, and the courts dropped it even further to 11.93. However in terms of performance this district is just as strong as the old district and stronger than the legislature maps for Democrats. The old district voted for Biden by 18.6 points, the legislature maps voted for Biden by 16.8 points, and the court final maps voted for Biden by 18.2 points. Even tough the district area has changed and even less Democrats in it, it seems the district performs the same as the old #SD53.
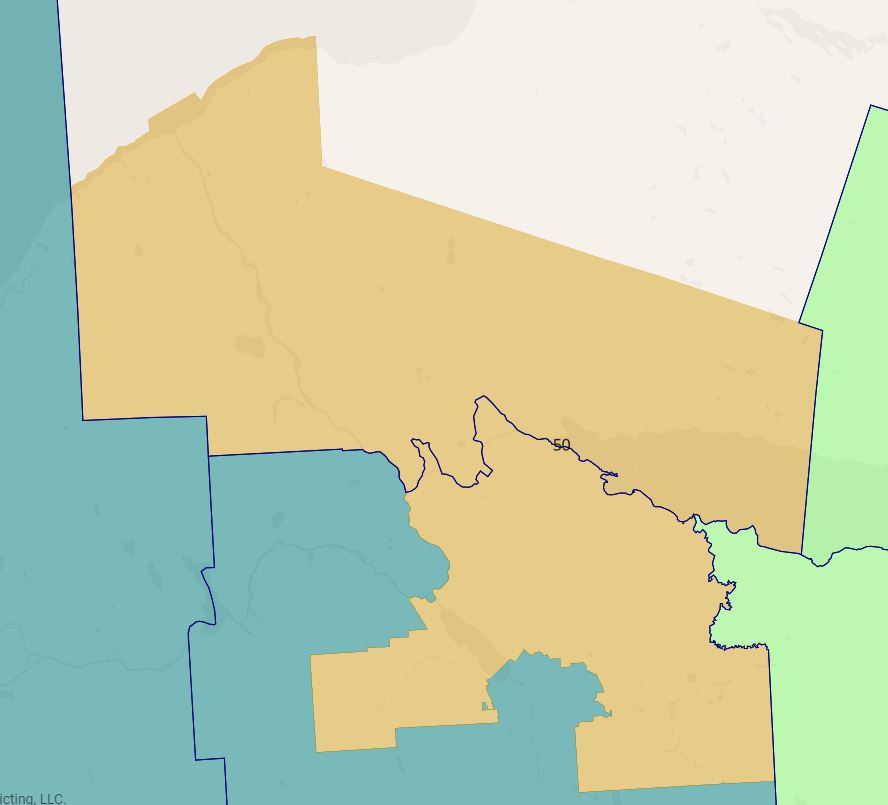
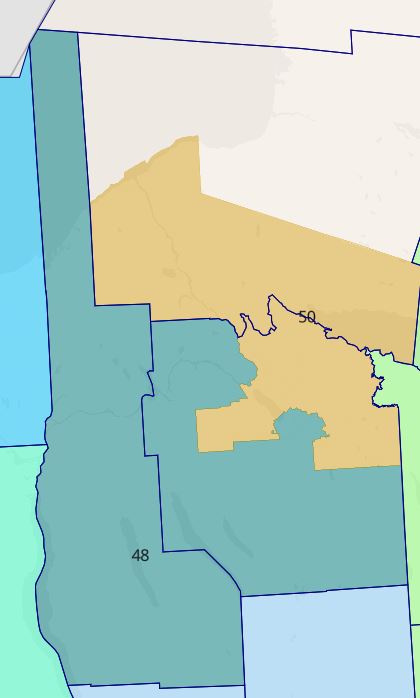
The final map we will look at today is the new #SD50. Much like its companion Senate district it has been a subject of much change. The original map had a sliver of the north side of Syracuse along with the towns circling counter clockwise around Syracuse from Clay all the way over to Onondaga and also included eastern towns of Dewitt and Manlius as well as a parts of Auburn and northern Cayuga County. The legislative map shifted the Cayuga County portion south encompassing all of Auburn, getting out of the southern portion of Onondaga County and picking up Salina and the northwestern third of Syracuse. The draft map for the courts altered the district having it go east to Utica before the final map shifted it north settling on the towns of Camillus, Geddes, Salina, Clay, Cicero, Dewitt, & Manlius with the cities of Fulton & Oswego as well as the southern half of Oswego County. Dave’s Redistricting App rates this as a Dem +3.9 district and rated very competitive.
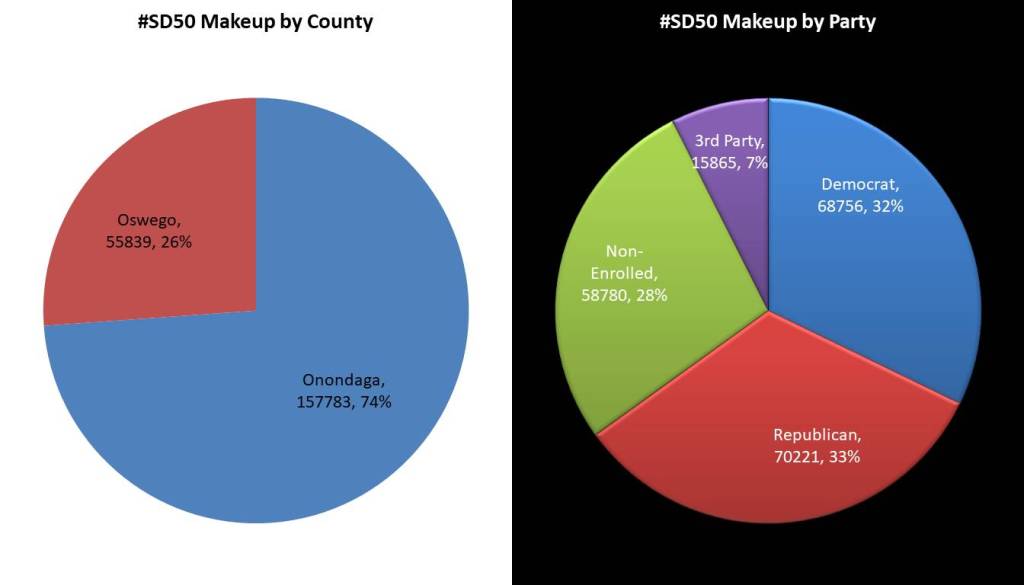
Onondaga once again makes up 74% of the voting population of the new #SD50 while Oswego County is at 26%. Despite the DAR rating there are actually more Republicans in the district with 33% of the voting population trailed just behind by the Democrats with 32%. Non-enrolled is 28% and 3rd party voters once again at 7%. The Oswego County portion of the district is heavily GOP while the Onondaga County is slightly Democratic, but more numerous making this about as even a district as possible.
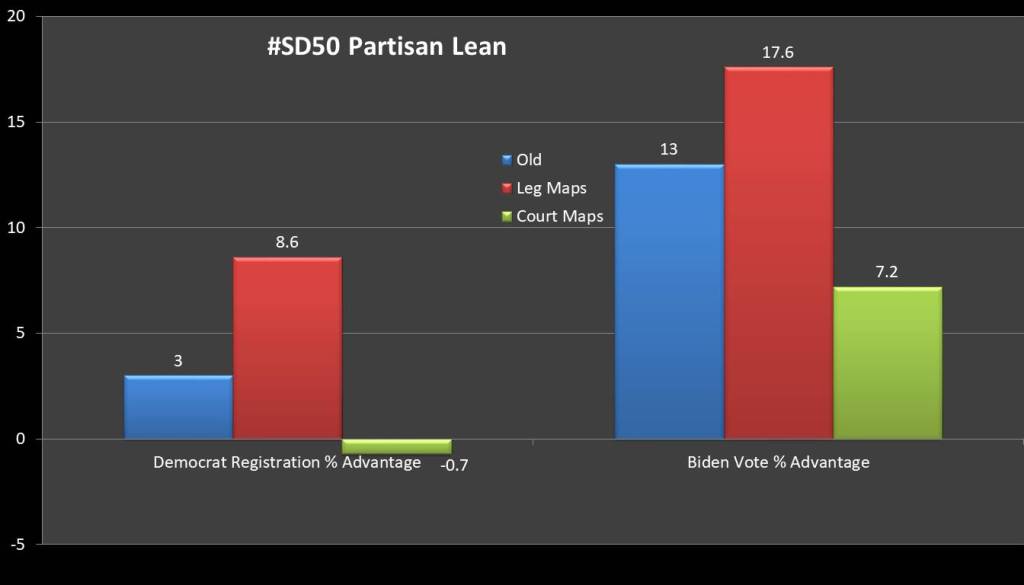
While both of the other Onondaga County Districts ended up near the metrics they started off with, this district has had a clear direction toward the GOP in the court ordered maps. The old district had a voter registration advantage for the GOP at 3.0, the legislative maps grew that by 8.6 points, the court ordered maps gave the GOP a .7% registration advantage. Performance wise the district took a hit as well. It went from a +13 Biden district, to +17.6 under the legislative plan, to just +7.2 Biden advantage in the final map. All of these metrics point to a very competitive seat that could flip either way in a normal election year.
Later this year I will do a deep dive into all three of these districts investigating the individual registrations of the various communities. Until then we have until June 10th this year before we know the full candidates field. Previous candidates have until May 31, 2022 to file a certificate and new candidates have until June 10, 2022 to turn in petitions. The primary for these seats will be August 23, 2022.
