
Welcome back to the #WeeklyWonk. Each weekend I release an article on a subject relating to elections in Onondaga County and New York State. Often these articles will have detailed stats to consume but sometimes they will be a recap of a prominent issue or on relevant election law. I previously broke down each election in four parts but since the 2022 General Election did not get certified until December 21, 2022, I am a little behind. So, for the 2022 General I am breaking my lookbacks into two parts. Last week I did Part 1 Alternative Voting Methods (Early, Absentee & Affidavit voting). This week I conclude with Part 2: Election Day and Overall Turnout.

We started General Election 2022 with 304,495 voters. Overall, 171,212 ballots were cast in the 2022 Election. That results in 56.23% turnout. This is the second highest mid-term election turnout since 2009 besting 2010, & 2014 but a little behind the record year of 2018. Overall, 65,995 Democrats showed up making up 39% of the electorate. They were followed by the GOP (55,936, 33%) non-enrolled (38,346, 22%), Other (7108, 4%) that are mostly former Independence voters, Conservatives (3,392, 4%), and Working Families (435, <1%). Its notable that the third parties of CON and WFP have much fewer registered voters who vote than votes cast on their lines.

Election Day voting was a remarkably different makeup than the alternative voting again this year. Democrats dominated Early and Absentee voting as we saw last week. The Election Day makeup was more even with 44,258 Democrats & 44,047 GOP checking in on Election Day both making up 35% each of the Election Day Electorate. They were followed by non-enrolled (28,862, 23%) and third-party voters (8,623 7%). There were more Election Day voters in 2022 (125,793) than in 2020 (121,044) despite significant lower turnout. However, that is because 2020 had a high percentage of EV and Absentee voters due to the COVID 1-19 crisis. If we ignore 202 as an anomaly this would be the third straight year that Election Day voting decreased as it was only 73.5% of the overall electorate. We are seeing that Election Day voting is decreasing among the populace in terms of percentage of the overall electorate of each election.
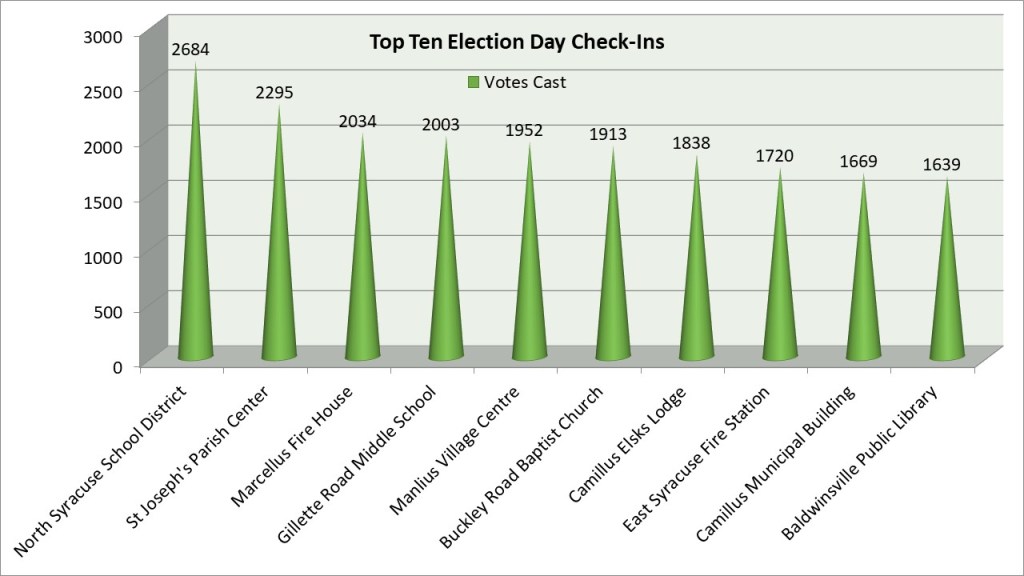
The top ten polling places on Election Day for the first time since I have been analyzing these elections are all in the suburbs. The North Syracuse School District offices was number 1 with 2684 check ins followed by St. Joseph’s Parish Center at number 2 with 2295 check ins. Both polling places were taking on extra voters due to losses of other polling places. We are looking at re-establishing more polling places to help them next year. Marcellus Fire House (2034), Gillette Road Middle School (2003), Manlius Village Center (1952), Buckley Road Baptist Church (1913), Camillus Elks Lodge (1838), E. Syracuse Fire Station (1720), Camillus Municipal Building (1669), & Baldwinsville Public Library (1639) round out the polling places on Election Day.
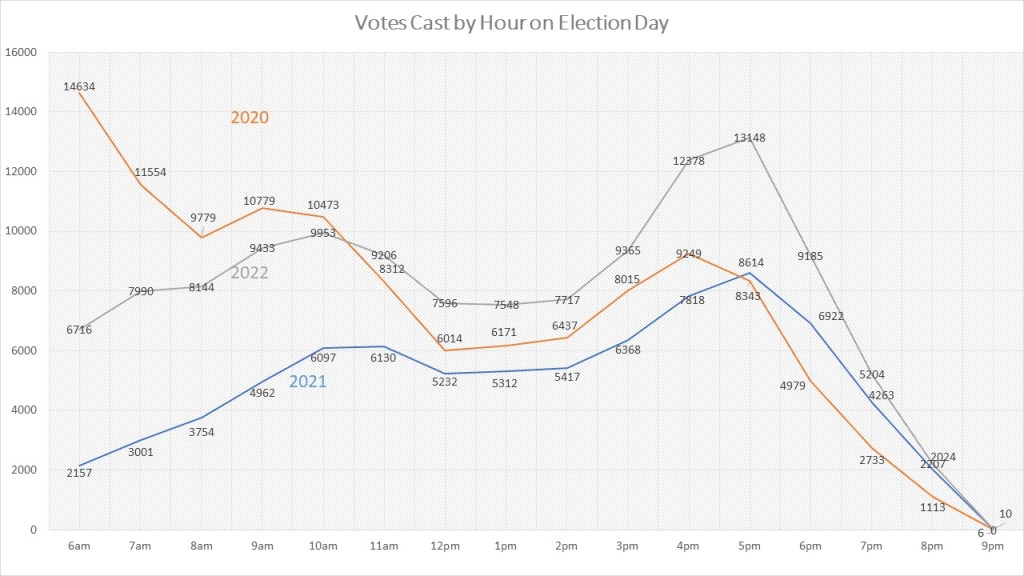
The hour-by-hour Election Day check ins for 2022 have the typical Election Day pattern. Starting off light in the morning then building to a small lunch rush. Then it dips again until the post work dinner rush which is the biggest portion of the day. It then drops sharply going into the close of polls at 9pm. 2020 of course was the anomaly with large voter check-ins in the morning. That paired with higher alternative voting percentages resulted in 2022 outpacing 2020 from 10am and after on Election Day. Luckily outside of moderate lines in North Syracuse our Election teams were able to process voters with little reported lines.

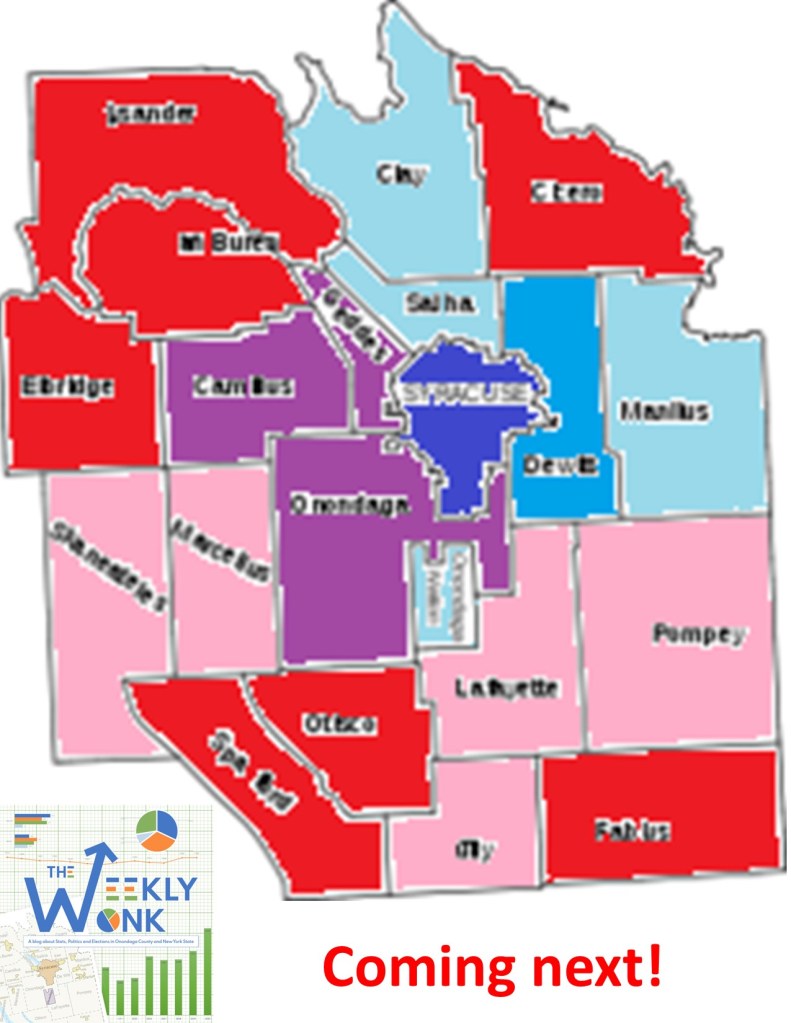
As we look at the regional breakdown for overall voting, we start to get a hint because Democrats had a decent election in Onondaga County, they could have been better. The City of Syracuse is the bluest area in Central New York. Despite the City of Syracuse only being about ¼ of the county its heavy blue makeup is vital for Democratic electoral chances. Unfortunately, only 41.31% of the voters of the City of Syracuse turned out. Compare that to 60.75% of the towns of Onondaga County turning out and we see a glaring difference. In fact, the 19.44% difference in turnout is the largest I show on record since 2009. Democrats will need to re-energize and implement a better GOP plan in the city to be successful.

It was not just regional issues hurting Democrats in Onondaga County, it was voter enthusiasm. Sixty-eight percent of Onondaga County GOP voters turned out in 2022. That is just under the turnout percentage they had last midterm. Democrats however had just 57% of their electorate turnout. While Democrats always lag the GOP in turnout percentage as the GOP electorate is older and more likely to turn out, the 11% differential is the worst since 2014. Even worse was the turnout % of non-enrolled voters who only showed up at 45%. The difference between them and the top spot of 23% was the worst since at least 2009. Democrats destroy their enrollment advantage by not turning out at the same rate of the GOP and when the non-enrolled do not show up as well it makes electoral victories harder.
With this #WeeklyWonk I end my look back at 2022. Next week I will start to look at the 2023 registration data. I will start out by looking at Onondaga County as a whole. 2023 is our County wide election year with County Executive, County Comptroller, County Clerk, and District Attorney are on the ballot. Tune in next week to see how the registration of our home looks as we start to get into the 2023 calendar year.
Subscribe to dustinczarny.com for all content and election news updates.
