Welcome back to the #WeeklyWonk. Each weekend I release an article on a subject relating to elections in Onondaga County and New York State. Often these articles will have detailed stats to consume but sometimes they will be a recap of a prominent issue or on relevant election law. I am turning my eye to the 2023 elections. Each week I hat will have races in them this fall. Today I am focusing on the towns of Onondaga County.

While the City of Syracuse is the primary focus of cultural and political news in Onondaga County, the towns are the most dominant force in county wide politics. While Syracuse is mostly blue and pretty predictable, the towns have a variety of demographic makeups and sizes. We have reliable blue towns like Dewitt and Marcellus that perform much like the city, strong Democratic support up and down the ticket in both local and federal years. Towns like Clay, Geddes, & Salina that regularly perform well for Democrats in Federal years but have lagging support for local candidates. The rest of the towns generally have little support for Democratic candidates, even in federal years.
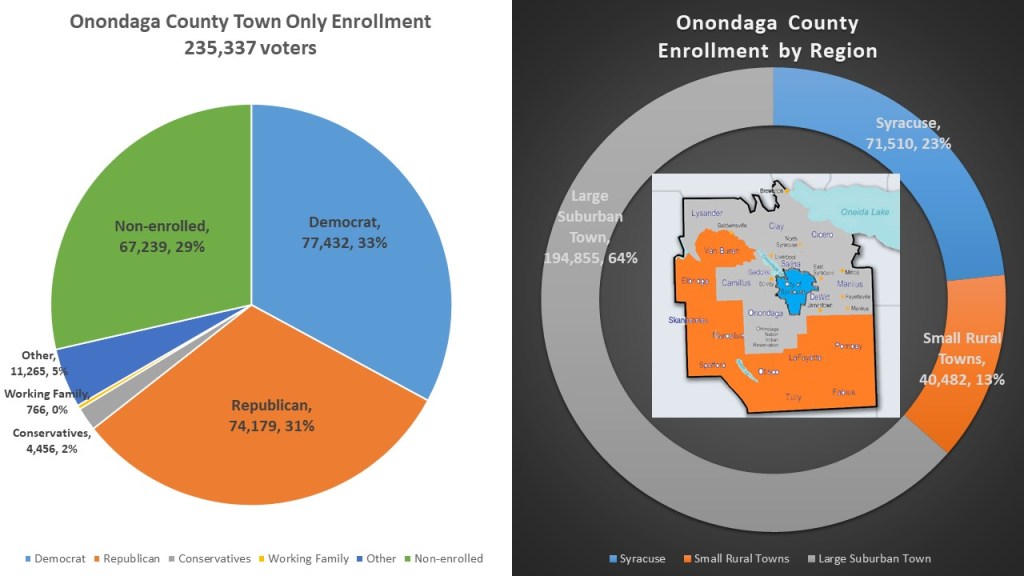
235,337 voters live outside of the City of Syracuse, roughly 75% of the voting population of Onondaga County. It is surprising to many that outside of the City of Syracuse Democrats do have a plurality of voters. 33% of the non-Syracuse voters are Democratic, 31% Republican, and 29% Non-enrolled. Last week I broke the county into five different regions based on geography. For this week’s column I will be looking at the towns based on Demographic makeup. In essence we have three types of communities in Central New York. The City of Syracuse is the urban core of our county. The “Large Suburban Towns” have over 10k voters and generally take on a more suburban feel. The “Small Rural Towns” have under 10k voters and have a more agrarian makeup. Of course inside each town there are areas that fit both definitions so this is just a way to look at the makeup. The Large Suburban Towns are generally in the center of our county surrounding Syracuse (Which has 23% of the voters) or the Northern Towns and make up 64% of the voting population. The Small Rural Towns string along the southern and western borders and make up just 13% of the population.
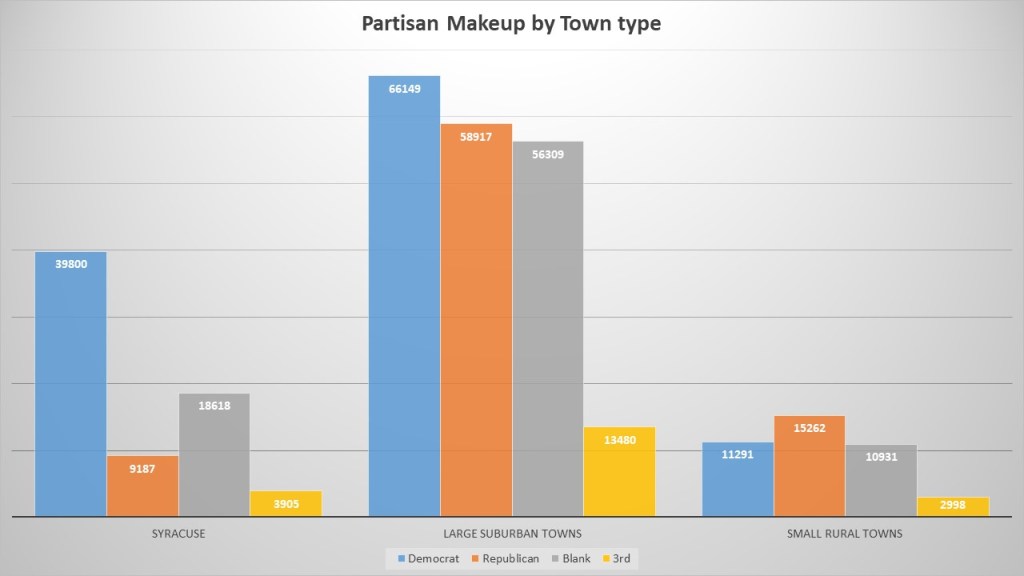
When we look at the Partisan makeup of the three regions of our county, we can see why Democrats have won the Onondaga County portion of twenty of the twenty-six races that had all of our county encompassed in it. The City of Syracuse remains a dominant Democratic city with Democrats having nearly four times the number of GOP and Non-enrolled nearly doubling up the GOP. The suburban towns on a whole also show a significant lead for Democrats with 7232 more voters and the non-enrolled is closing in with just 2,608 voters less than the GOP. The GOP still have a decided edge in the small rural towns outnumbering Democrats by 3,971 voters and the non-enrolled trail the Democrats by just 360 voters. The GOP dominance in the rural towns though is offset by the size and growth of the suburban towns and of course the City of Syracuse.
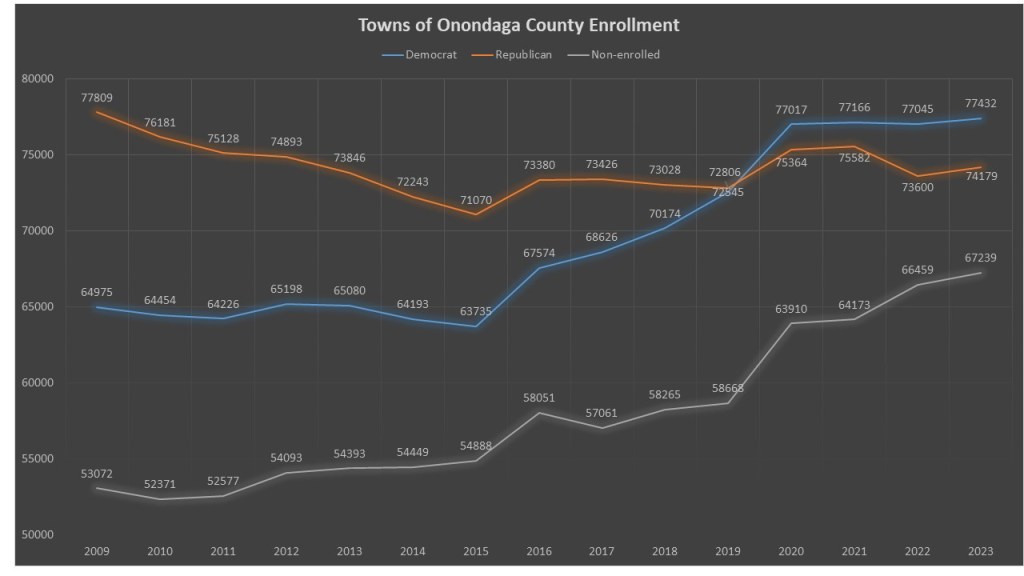
Since 2009 the Democrats have gained 12,457 voters, while the GOP has lost 3,630 voters. The Trump years definitely had its effect on the Central New York population. The growth of Democratic enrollment was most dramatically felt outside of the City of Syracuse. From 2009 to 2015 the GOP was losing voters and the Democrats for the most part were staying even. However from 2015 to 2020 the Democrats had a dramatic increase in enrollment while the GOP actually stagnated for the most part. Since 2020 the Democrats have remained stagnate while there has been some decrease on the GOP. The most consistent rise has been the non-enrolled voters. Since 2009 they have gained at a steady pace adding 14,167 voters.
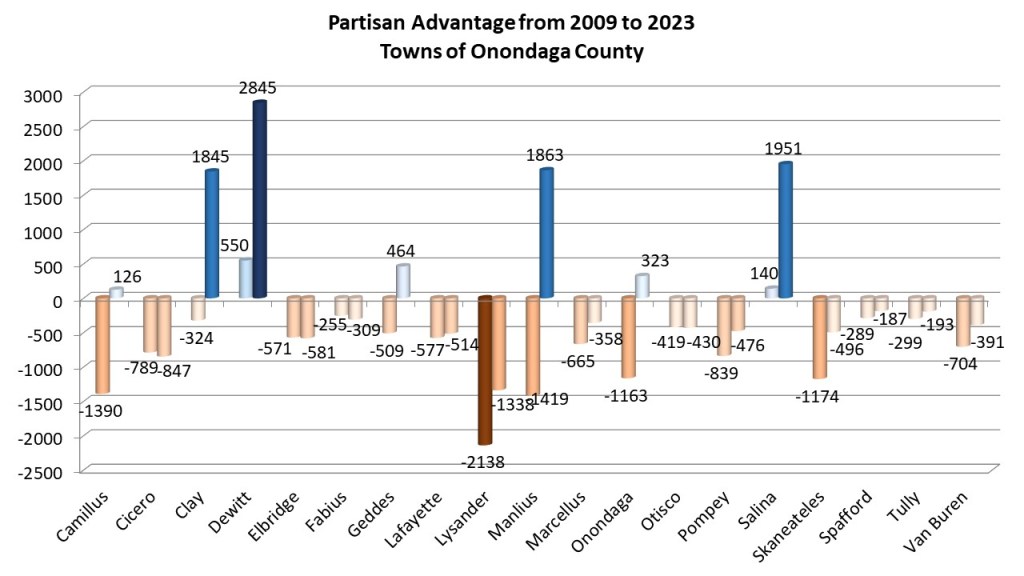
When we look at the individual towns and the changes from 2009 it highlights the gains Democrats have made are dramatic by localized in a few dramatic switches in large towns. In 2009 only the Town of Dewitt had a small Democratic enrollment edge. Now the Towns of Manlius, Salina, Clay, Camillus, Geddes, and Onondaga all have a Democratic plurality. Most notably is the large switch in Manlius, the 3rd most populous town shifting from a reliable GOP town to a reliable Democratic town. In fact Democrats made numerical gains in all but Cicero, Elbridge, Fabius, & Otisco.
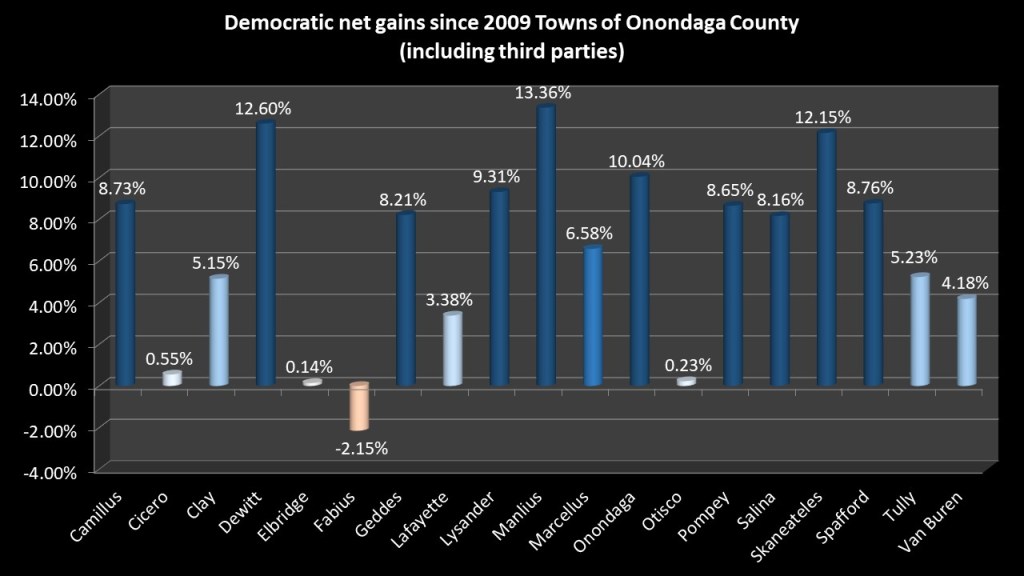
In towns though third parties have a dramatic impact, specially the Conservative party. When you look at gains you have to include the Working Family Party registrants which are mostly aligned with Democrats, and the Conservative Party that mostly aligns with the GOP. This chart shows the percentage gains inside each town when adding the third party in. As towns grow and more non-enrolled voters grow the percentage of the Democratic faction has grown in 118 of the nineteen towns since 2009. It is obvious that the Democratic towns of Dewitt & Manlius have large gains. It is also not surprising that the other towns that flipped Democrat such as Camillus, Clay, Geddes, Onondaga, & Salina are some of the higher gains as well. What may surprise people is how much Democrats have increased their influence in solidly Red towns like Lysander, Skaneateles, Spafford, Pompey, and Marcellus. Each of these towns have elected Democrats town wide recently even with a numerical disadvantage. This growing influence certainly has helped. The only town that Democrats have not seen a statistical growth in influence if Fabius, however the growth in other red towns like Cicero, Elbridge, and Otisco are negligible.
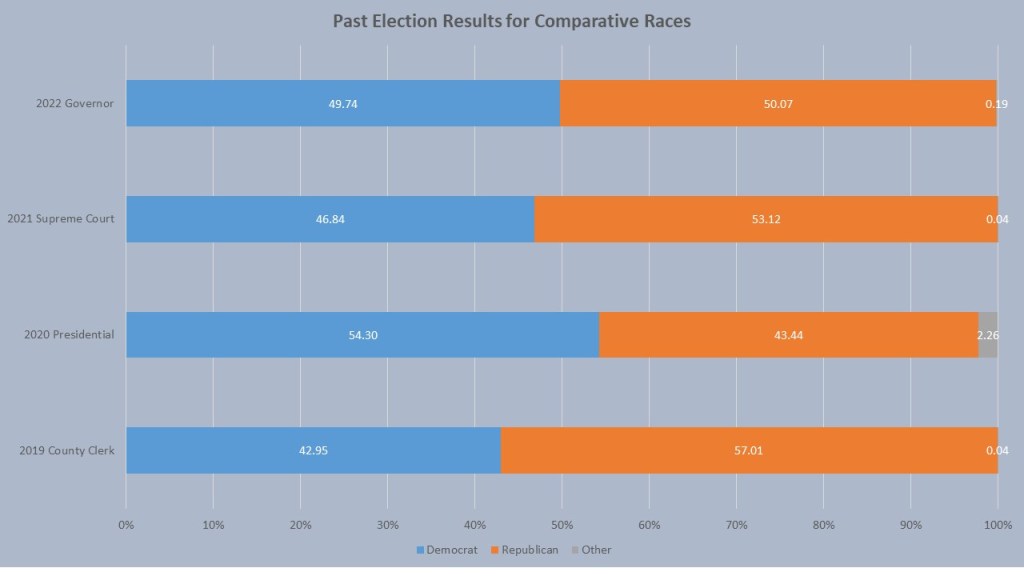
Finally we look at the four comparative races to give us a sense of how the towns as a group vote. For the 2023 Weekly Wonks I am using one race from each of the last four years to demonstrate how a political subdivision can expect to perform. For the federal years of 2022 and 2020 I chose the top of the ticket, Governor and President to show how a district can perform in high turnout years. In the local years of 2021, I chose the most competitive race to give an idea, absent of individual campaign dynamics, the electorate might perform in odd years. I chose a race in 2021 where the Democratic candidate carried Onondaga County (Brindisi for Supreme Court) and a race in 2019 where the GOP won Onondaga County (Dell for County Clerk). I will try and throw in the most recent local race as well however no such race exists in just the towns.
Not surprisingly the Towns of Onondaga County reacted differently in each year and that can be accredited to turnout. President Biden won with the largest margin of any competitive race in recent memory in Onondaga County and did so in the towns winning 54.30 % of the vote. Governor Hochul ran basically even in 2022 in the towns picking up 49.74% of the vote. Brindisi was able to win Onondaga County by limiting his losses in the towns an winning 46.84% of the vote in 2021. Mark Kolinski though in 2019 only won 42.95% of the town vote in 2019 and barely lost the County Clerk race. It is pretty clear for a Democrat to win county wide they can lose the towns, but must win 45% of the vote and take advantage of the Town vote.
Next week I turn my attention to the City of Syracuse as a whole. Our registration vendor is currently applying the new common council and county leg maps and I don’t have statistics for those yet. I plan to dedicate an individual Weekly Wonk to the changes in each of those once they are done. Next week though I will focus on the City of Syracuse and toplines on the Wards inside the city. Remember to subscribe to dustincarny.com for all election news and content updates.

2 thoughts on “The Weekly Wonk: The Towns of Onondaga County”