
Welcome back to the #WeeklyWonk. Each weekend I release an article on a subject relating to elections in Onondaga County and New York State. Often these articles will have detailed stats to consume but sometimes they will be a recap of a prominent issue or on relevant election law. I am turning my eye to the 2023 elections. Each week I look at political subdivisions that have races in them this fall. Today I am focusing on the heart of Onondaga County, the City of Syracuse.
The City of Syracuse recently underwent a transformation in their political landscape. Last year the first and only citizen led redistricting commission reshaped the 5 districts of the common council aligning them with population patterns after 30 years of neglect. These new district lines will be in place for the 2023 elections. In this article though we won’t be examining them as our registration system at the Onondaga County Board of Elections is undergoing a registration system change and that data will not be available until later this month. Instead I am focusing on the City of Syracuse neighborhoods as defined by their ward lines so we can look at the changes over time.
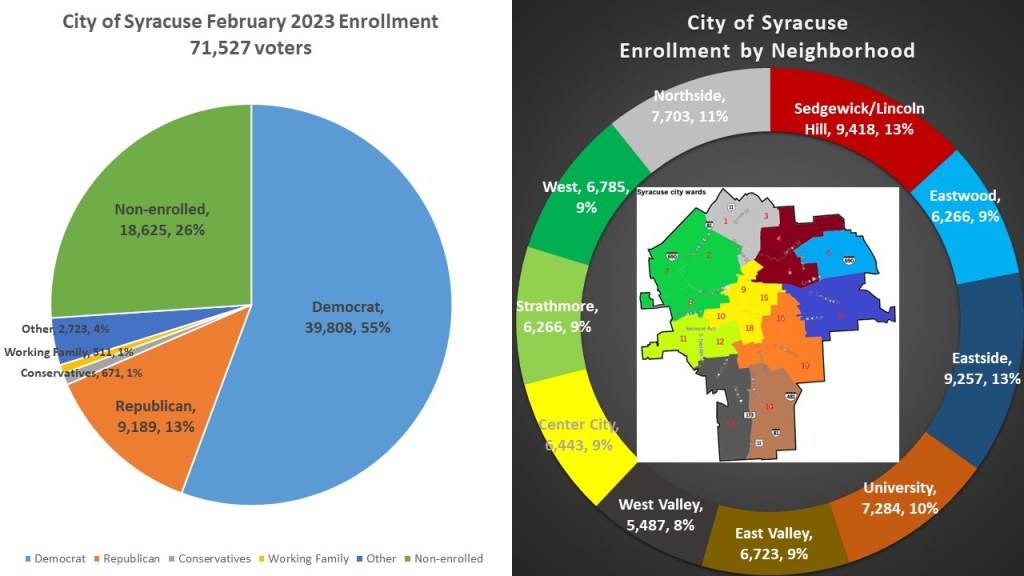
The City of Syracuse currently has 71.527 voters and is easily the bluest city or town in Onondaga County. Democrats have a majority of voters with 55%. In second place is the non-enrolled voter with 26% of voters. The GOP is in 3rd place and their enrollment has shrunk to 13%, now doubled up by the non-enrolled voters. For this article I have broken the City of Syracuse into 10 neighborhoods using the ward lines to define them. It is not perfect but I tried to group wards together to represent somewhere between 5k-9k voters or 8%-13% of the voters. Ward lines are unchangeable as they are part of the City Charter, often how land was added to the City of Syracuse as it grew. Sometimes wards can span two different neighborhoods and I have done my best to group them in a logical way. Those neighborhoods are Center City (Ward 9,10,15,18), Eastside (17), Eastwood (5), Northside (1,3), Sedgewick/Lincoln Hill (4,6), Strathmore (11,12), University (16,19), West Valley (13), East Valley (14), and the West Side (2,7,8).
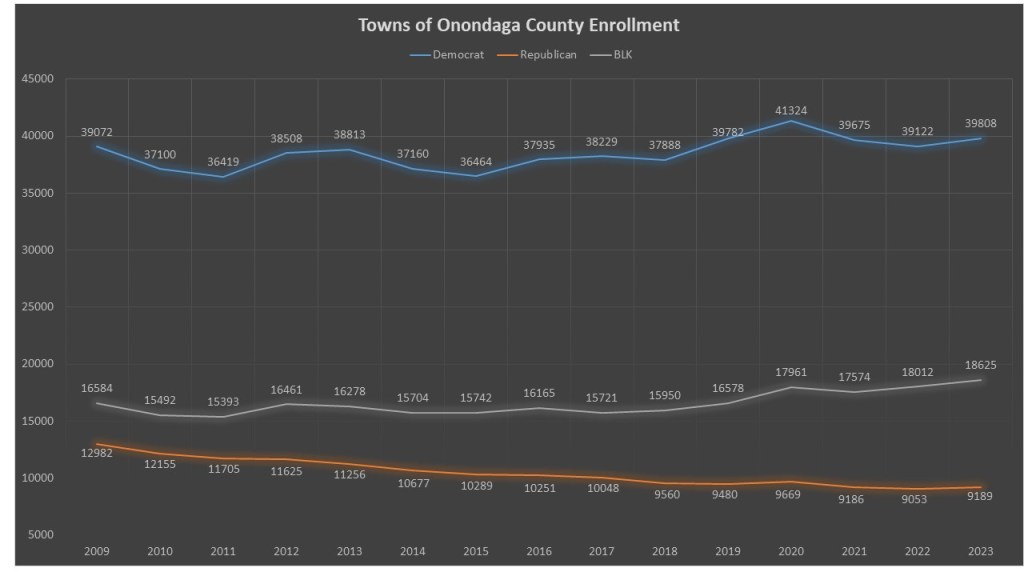
The City of Syracuse has long been Democratic like most urban areas in the Northeast. The partisan divide is continuing to widen but its not because Democrats are gaining large amounts of voters. Since 2009 Democrats have gained 736 voters while the GOP has lost 3,793 voters. The non-enrolled are the greatest most consistent gainers in Syracuse adding 2,041. The story of Syracuse seems to be small growths for Democrats as the GOP move out and are replaced largely by non-enrolled voters.
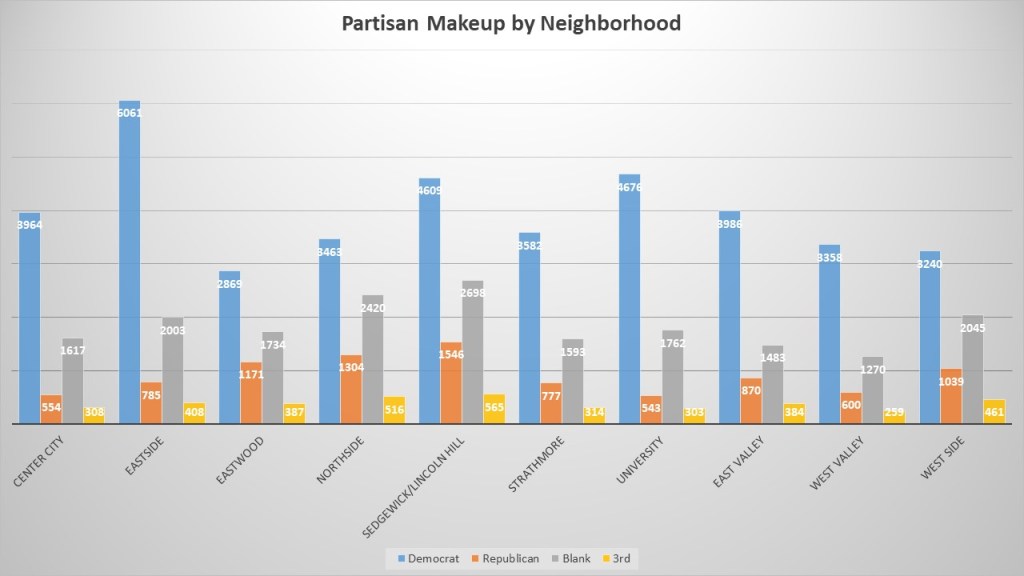
As we look at the partisan enrollment of in the individual neighborhoods it becomes clear just how much Democrats dominate every corner of Syracuse. Not only do Democrats have the most enrolled voters in every neighborhood. Likewise the non-enrolled voters are solidly in 2nd place. Still there are some differences we can see in these neighborhoods. When we look at percentage Democratic the most Democratic neighborhood is the Eastside (65.5%) followed by the University (64.2%), Center City (61.5%), West Valley (61.2%), East Valley (59.3%), Strathmore (57.2%). The other neighborhoods are where Democrats only have a plurality of support Sedgewick/Lincoln Hill (48.9%), Westside (47.8%), Eastwood (46.6%), and the northside (45.0%). Eastwood is the best neighborhood for the GOP as there is still a significant portion of GOP enrolled voters so they are not doubled up by non-enrolled and their ration of Dem to GOP (2.45/1) is the best of all the neighborhoods.

The City of Syracuse has lost 1,532 voters since 2009 but that may not be indications of a trend of loss. Urban populations tend to be more susceptive to the registration waves of the Presidential election. In fact we see that since 2009 the University area is down 2000 voters since 2009. Presidential elections tend to see rising registration rates in university and urban areas in the year of the election lasting the year after. What we do see in the other neighborhoods is mostly stability in their registration numbers with two exceptions, the Center City (+679) and Westside (+407) neighborhoods. When we dive into the individual wards in these two neighborhoods we see two wards standing out, the ninth ward in Center City adding 547 voters, and the 2nd ward in the West Side adding 328 voters. The common factor here is an emphasis on dense apartment living as downtown commercial space and old factory buildings are being turned into apartments in these neighborhoods. It points to the possible future of city living.
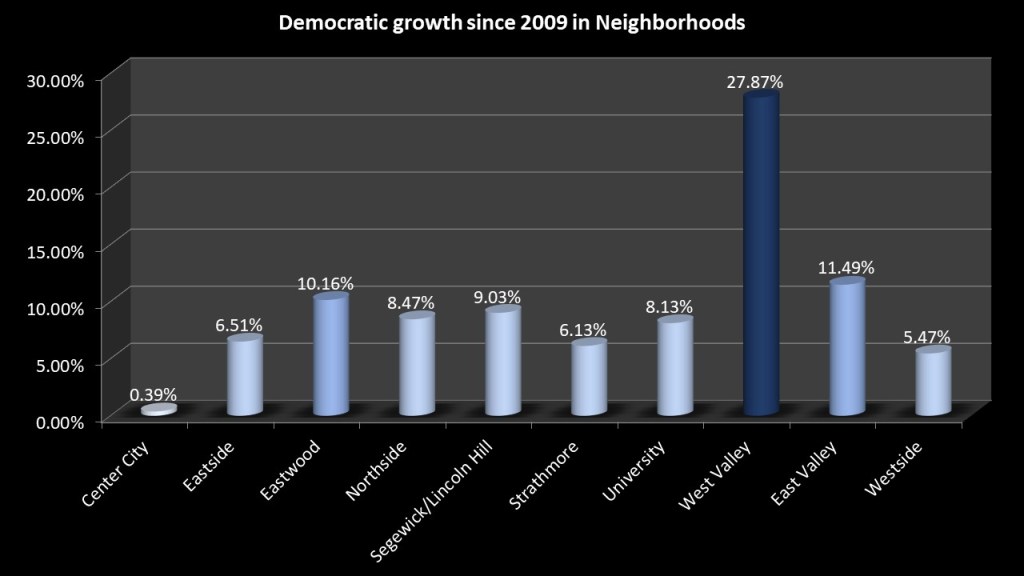
When we look at the partisan makeup of these neighborhoods compared to 2009 there are some interesting anecdotes. The highest growing neighborhood (center City) had the least Democratic growth (.39%). However that could be because it has always had a strong Democratic advantage with little place for it to go. In fact in the more GOP friendly areas of our city we have seen the some of the most Democratic growth. In 2009 the Valley was one of the more GOP friendly areas of the City and has dramatically changed over the last 14 years with Democrats growing at 11.49% in the East Valley and an astounding 27.87% in the West Valley. Like today Eastwood, the Northside, and Sedgewick/Lincoln hill neighborhoods were the other more conservative areas of the City and thus there was more room for growth for Democrats in those neighborhoods.
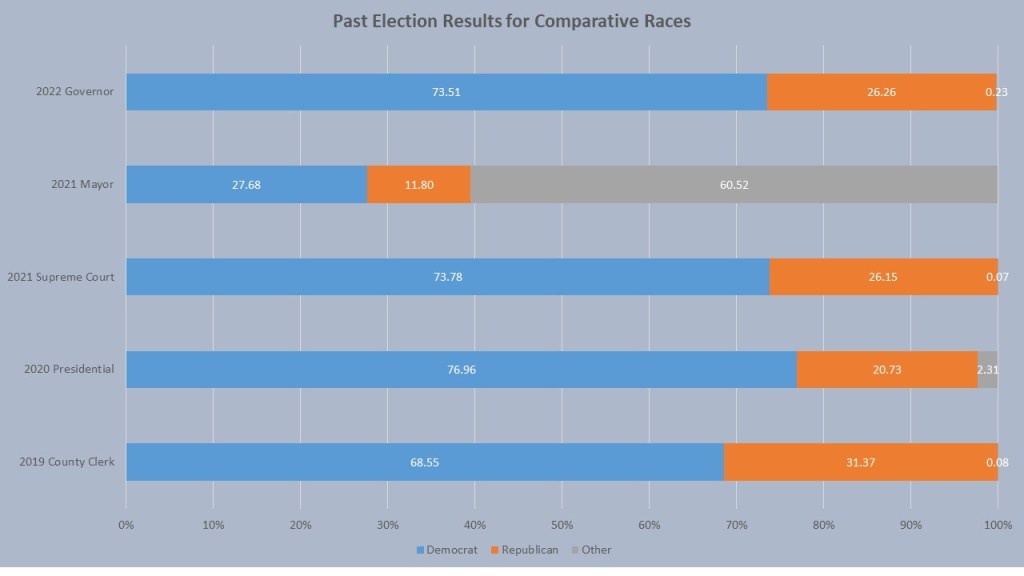
Finally, we look at the comparative races. If we want to see how Democrats perform in their theoretical best year, we look to the 2020 Presidential race where President Biden won nearly 77% of the vote. Governor Hochul’s race in 2022 represents the normal mid term expectations with Democrats winning 73.51% of the vote. However since this is a local year I am going to focus in on the 2021 Supreme Court Race and 2019 County Clerk Race. While Brindisi did not win the Supreme Court race in 2021 he did win Onondaga County. His performance of 73.78% actually bested Hochul in 2022 and propelled him to win Onondaga County. The 2019 County Clerk race is a good example of how the GOP needs to fare in the City to win County-wide. Mark Kolinski only won 68.55% of the vote in the City and because he underperformed he narrowly lost the County Clerk race. For comparison’s sake I am adding the 2021 Mayoral race which remains a unicorn in City performance. Ben Walsh’s re-election as an independent mayor remains the exception to the rule in city contested races and shows the path for winning City wide is possible for a non-Democrat, though highly unlikely and hard to duplicate.
That does it for this edition of the #WeeklyWonk. Next week I take a quick break on voter registration previews to focus on voter registration forms! Namely I will be looking at our annual report data for registration forms processed by Onondaga County Board of Elections. This will hopefully allow our registration vendor to catch up and we can then dive into the new districts for the City Of Syracuse Common Council and Onondaga County Legislatures later this month. Remember to subscribe to dustinczarny.com for all content and election news updates.
