
Welcome back to the #WeeklyWonk. Each weekend I release an article on a subject relating to elections in Onondaga County and New York State. Often these articles will have detailed stats to consume but sometimes they will be a recap of a prominent issue or on relevant election law. I am turning my eye to the 2023 elections. This week I take a break from looking at the political subdivisions and focus on a work item from the Onondaga County Board of elections. Today I look at the effect of redistricting in 2023 on the Syracuse Common Council districts and Onondaga County Legislature.

Redistricting dominated the 2022 political landscape and will continue to do so in 2023. The five City of Syracuse Common Council districts and 17 Onondaga County Legislative districts underwent redistricting in 2022. That means in 2023 candidates will be running in new districts. The process to get to the new districts could not be more different. In the City of Syracuse they instituted a citizen led redistricting panel that redraw the city districts over a year long process that resulted in acceptable maps based on neighborhoods. In the County a hastily convened redistricting process that took place over 30 days resulted in vetoed maps, even more hastily drawn maps by the county legislature, and now an ongoing lawsuit.
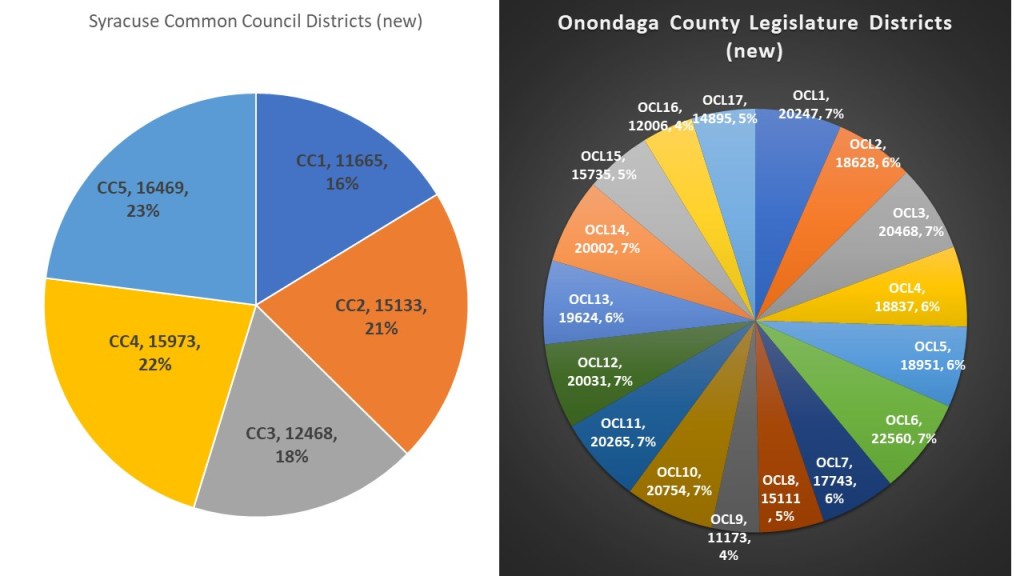
Looking at the above charts we can see the overall voter population in each district. No matter the process redistricting is based on overall population. This can lead to a wide variety on voter population. Urban populations tend to be registered at less rates than suburban populations. In Syracuse this is because of a large non-citizen population as well students from Syracuse University and Lemoyne who may be registered at their home addresses. We see that the City districts for the OCL (7,8,9,15,16,17) tend to have lower voter populations than the suburban districts. The same is true inside the City of Syracuse Common Council districts as northside district CC1 with a large new American population and CC3 the home of student populations for Syracuse University and Lemoyne University lags behind the rest of the city districts.

The new City Common Council districts are still essentially the same as the old ones in terms of partisan advantage. In every district Democrats dominate the partisan enrollment. Like in the previous districts, cc1 is the only district where Democrats have only a an overwhelming plurality of voters instead of a dominating majority like in districts 2, 3, 4, and 5. In every district the GOP is relegated to third party status falling well behind the non-enrolled voters.

To analyze the County legislative districts, I am dividing them into three categories, Safe Democrat, Competitive seats, and Safe GOP. The 6 seats currently held by the Onondaga County legislature Democrats are considered to be safe Democratic seats. They all have significant portions of the City of Syracuse with 3 seats wholly inside the City (9,15,16) and 2 seat sharing a portions of the Democratic town of Dewitt (7 & 17) and 1 having a micro portion of the swing town of Geddes (8). These districts, like the Syracuse Common Council districts, have either overwhelming plurality Democratic enrollment (7,8,9) or Democratic majorities (15,16,17). All districts the GOP is in third party status trailing the non-enrolled by a great amount.

The competitive seats in our county are currently all held by the GOP. Under the new maps these seats have mostly Democratic pluralities (with the exception of OCL 11). OCL 2, an open seat as Jim Rowley is not seeking another term and OCL 4 held by Colleen Gunnip, and OCL 5 (held by Deborah Cody), have non-enrolled advantages over the GOP. OCL 10 has a the largest Democratic enrollment advantage and has had spectacularly close elections the last three cycles under the old map. OCL 11 & OCL 14 are, by the numbers, swing districts with nearly even enrollment between the two parties.

The five SAFE GOP seats are OCL 1,3,6,12,& 13. All five districts have distinct GOP pluralities. The Democrats are solidly in second place ahead of the non-enrolled. However Democrats tend to have a disadvantage in county legislative seats as they are held in low turnout years and Democratic populations turn out a lesser rate than the GOP. It is a harder race for a Democrat to win in these districts and most likely would need a third-party split, open seat, or an unpopular incumbent to be able to win in these races.
One of the ways to measure the effect of redistricting is to see if there is a partisan effect before and after redistricting. Our registration vendor at the OCBOE pulled registration reports of the Common Council districts before redistricting maps were applied and after. I compared the data to see if there was a partisan shift in each of the districts. A positive number means it shifted toward the Democrats and a negative towards the GOP.

The City of Syracuse had the most radical redrawing in this round of redistricting. However the most conservative district, cc1, was barely changed in its partisan makeup. CC5 got more GOP as it gave up the east side for Eastwood and Sedgewick neighborhoods and CC3 got the most Democratic as it gave up Strathmore neighborhoods for university populations. CC 2 got a little more conservative as it absorbed the Strathmore neighborhoods.
The Safe Democratic seats on the County Leg saw little change for most of the districts with small swings for OCL 8,9, and 16 seeing small partisan shifts. OCL 15 is the biggest shift as it was taken from a split seat half in Geddes and Onondaga and half in the city and made an entirely city seat. OCLY 17 got significantly more Conservative but still majority Democratic as it lost some of the city representation and gained more conservative portions of Dewitt.

As we analyze the GOP held seats we can see the true partisan effect of the County legislature redistricting process. When looking at the competitive seats we noticeable partisan shifts for 5 of the 6 competitive seats. We also see 3 of the 5 Safe GOP seats get more red. Of the three seats held by the GOP that shifted Democrat, one was held by Julie Abbott and already the most GOP seat in the county. The other two held by Jim Rowley (2) and Ken Bush (13) just happened to be the only two GOP legislators calling for fairer maps during the process. They were also frequent critics of Ryan McMahon whose staff drew the maps in place and ended up being part of a coup to wrestle the Onondaga County Legislative chairmanship away from David Knapp.
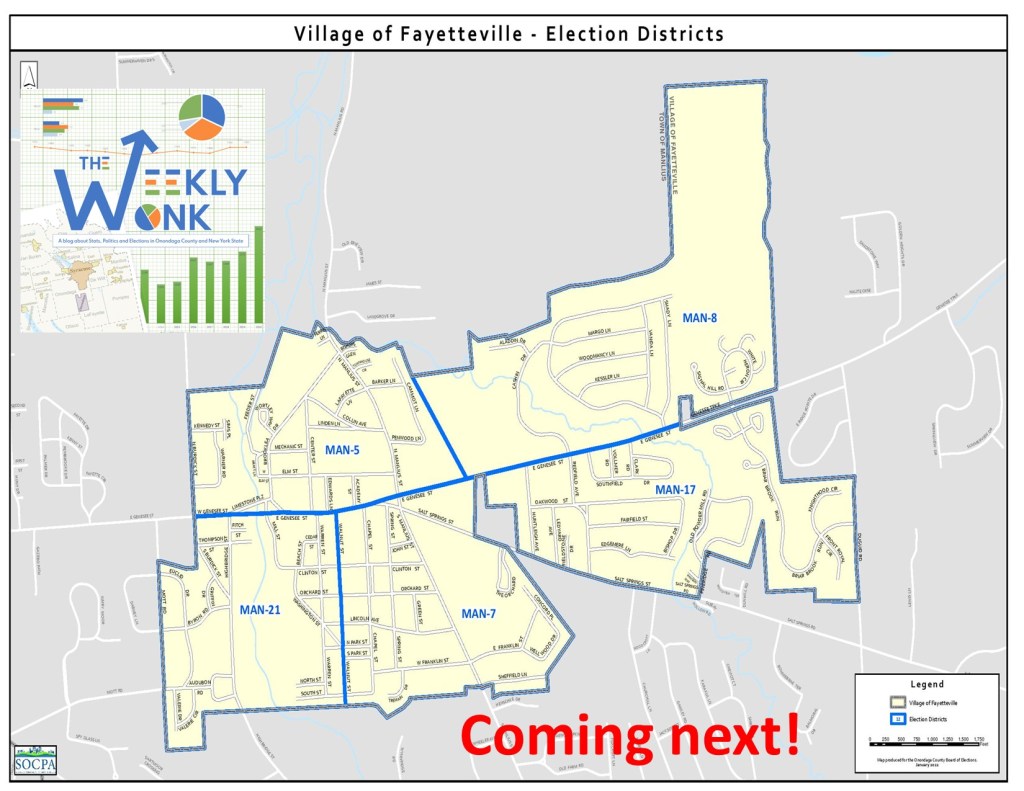
That is it for this week’s edition of the #WeeklyWonk. IF you want to read more about the Redistricting Lawsuit that is still challenging the County Maps go here. Next week I will look at the Village of Fayetteville as we prepare for their elections on March 21, 2023. Remember to subscribe to dustinczarny.com for all election news and content updates.

Hi Dustin, I’m very grateful for your excellent analysis. I wanted to print the maps so that I could follow what you were saying. Unfortunately, they were so fuzzy as to be unusable. I also tried to expand them in the text. Same result. Is it possible to use better maps so that we can really follow what you are referring to? Many thanks. Jayne Humbert
PS I hope to send this to friends to inform them of the issues, but at this point, an unreadable map will only frustrate them. Thanks again for all you are doing.
Jayne Humbert
LikeLike
You cab find readable maps at onvote.net.net maps section
LikeLike
Thank you very much. May I suggest that you put in this link as well as the map next time? Many thanks for all you are doing. Jayne Humbert
LikeLike
Sorry the link doesn’t work.
LikeLike