Happy New Year and welcome back to the #weeklywonk. One of my 2026 New year’s resolutions is to get back to this, my weekly look at registration electoral data in Onondaga County and New York State. I took a brief hiatus from this column in 2025 with just sporadic columns, but now in 2026 I am back with renewed vigor. As we start the New Year I focus my efforts on Onondaga County overall. This will be four parts to look at our home, Onondaga county: Overall, Suburbs, the City of Syracuse, and the Onondaga County Legislature. This week is part 1, Onondaga County Overall. In 2026 Statewide offices such as governor, Comptroller and Attorney General, NY 22 Congressional race, Supreme Court, County Court, and Sheriff will run countywide.
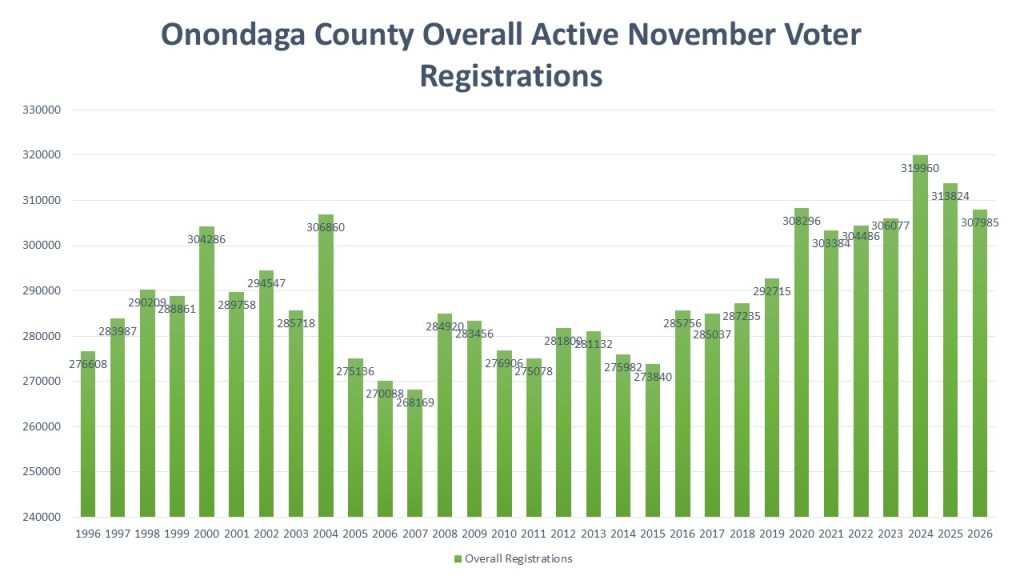
We start with a historic look at voter registration totals in Onondaga County. For comparisons sake we look at the active voter registrations right before the November election of each year except for 2026 which is the registration data as of January 1, 2026. We start 2026 with 307,985 active registered voters. This is down from the 2024 record of 319,960 but still the fourth highest registered voter total on record. What we are seeing is a typical downward trend after a Presidential election. Normally registered voter totals crest in Presidential year and then fall. The major exception to this was 2016-2020 which saw increases in voter registration during the first Trump presidential years. We also made it easier to register between 2020-2024 and the pandemic years made the decreases less noticeable.
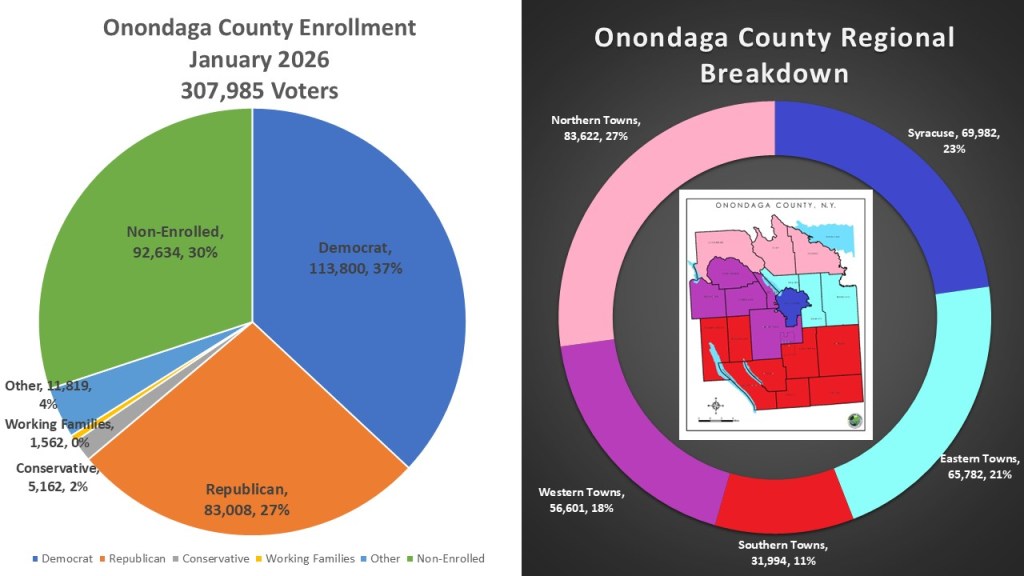
Of our 307,985 voters we see a large plurality of voters registered in the Democratic party. There are 113,800 Democrats (37%) compared to 83,008 Republicans (27%). The non-enrolled population is second most registration with 92,634 voters (30%). The Conservative party has 5,162 voters (2%) and the working families party has 1,562 voters (<1%). There are 11,818 (4%) voters enrolled in non-recognized parties. When it comes to the regions of Onondaga County, I break it up into five distinct regions. The plurality of voters lives in the Northern towns of Clay, Cicero, and Lysander with 83,622 voters (27%). Next is the City of Syracuse, which has 69,982 voters, representing 23%. The eastern towns of Dewitt, Manlius, and Salina have 65,782 voters (21%). The western towns of Camillus, Elbridge, Geddes, Onondaga, and Van Buren have 56,601 (18%). The rest of the towns (Fabius, Lafayette, Marcellus, Pompey, Skaneateles, Spafford, Otisco, and Tully) make up the southern portion of Onondaga County, the largest land mass, but the least populated with just 31,994 (11%).
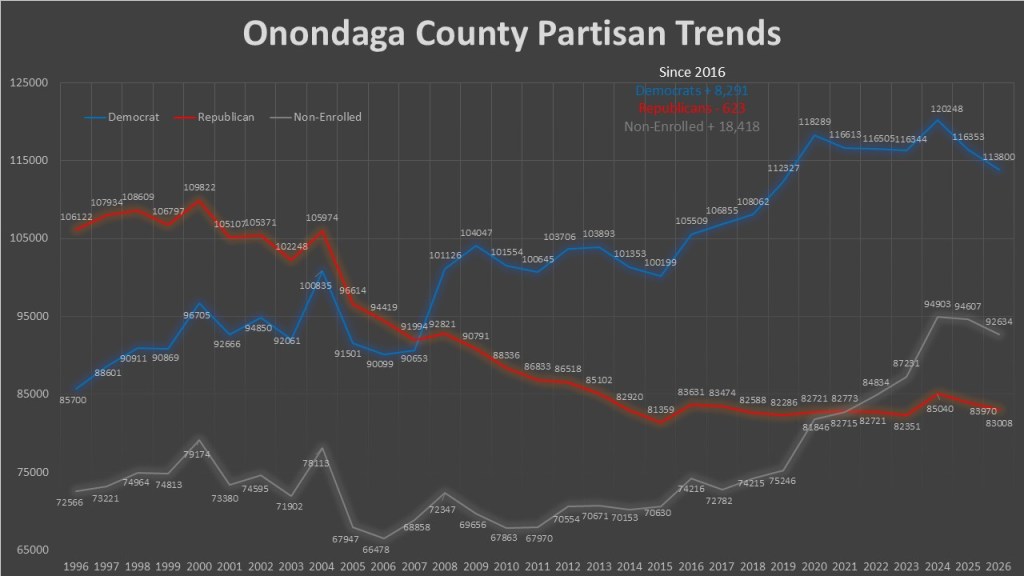
Here we have had partisan trends in Onondaga County since 1996. The long-term story of Onondaga County is how an upstate red dominated county has transformed over the last 30 years from a solidly red Republican County to a solidly blue Democratic County. Democrats first overtook republicans in the 2008 Obama Presidential election and have not looked back since. The Democrats most dominant stretch was their growth in the 2016-2020 cycle with large gains compared to stagnate GOP registration. Since the last 2024 Presidential election all three groups we are tracking, Democrats, Non-enrolled, and Republican voters, are trending down as the voter registration rolls have shrunk. A key point often missed is that an increasing number of people in Onondaga County are not enrolling in a party. In so many ways the 2016 election is a turning point both nationally and locally. Since 2016 the Democrats have had decent growth adding 8,291 voters. Meanwhile the GOP has stagnated, losing only 623 voters, which is a bit of improvement from steady decline since 2004-2015. However, the massive growth of the non-enrolled voter is the dominant story since. 2-16, adding 18,418 voters. This is a trend that will shape Onondaga County elections for years to come.
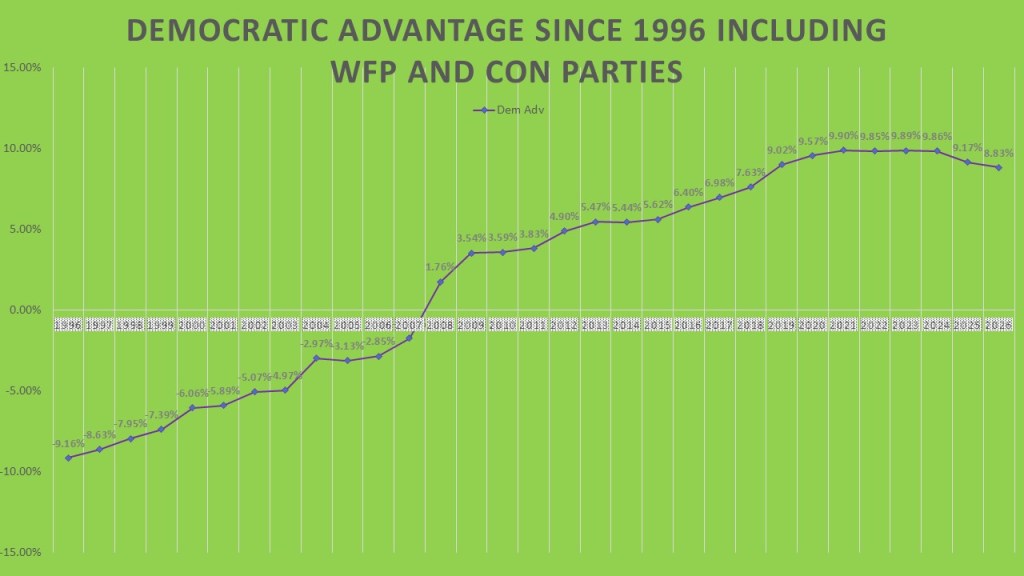
Onondaga County has four individually recognized parties, the Democrat, Republican, Conservative, and Working family’s party. Though they are four different parties, the Conservative and Republican party tends to align on the right while the Democrat and Working families party aligns with the left. Comparing the combined totals of Democratic–Working Families and Republican–Conservative parties show how the Democratic advantage in Onondaga County has grown. The left aligned parties of the Democrats and WFP currently have an 8.83% advantage over the right aligned GOP and Conservative parties. This is down the high of 2021 with 9.9% but still higher than every year before 2019. One reason for this trend is the rise in non-enrolled voters, which has lessened the influence of all four parties. Additionally, after the 2024 election, voters—particularly in Syracuse and around Syracuse University—removed from the rolls due to issues with mail verification and undelivered mail. When 2028 comes about it will be helpful to look at this data set from presidential to presidential and see if this trend continues to grow as it has since 1996.
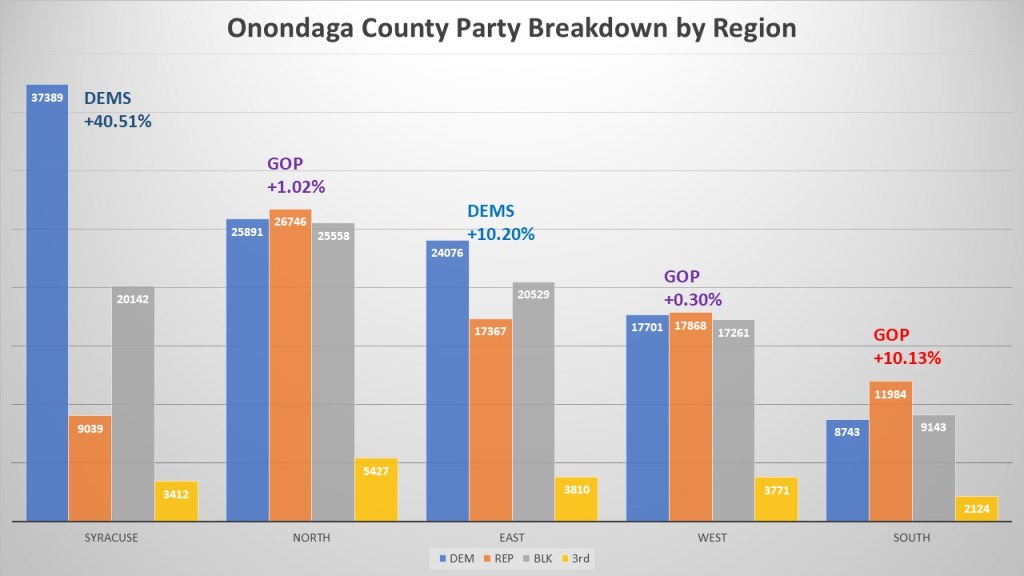
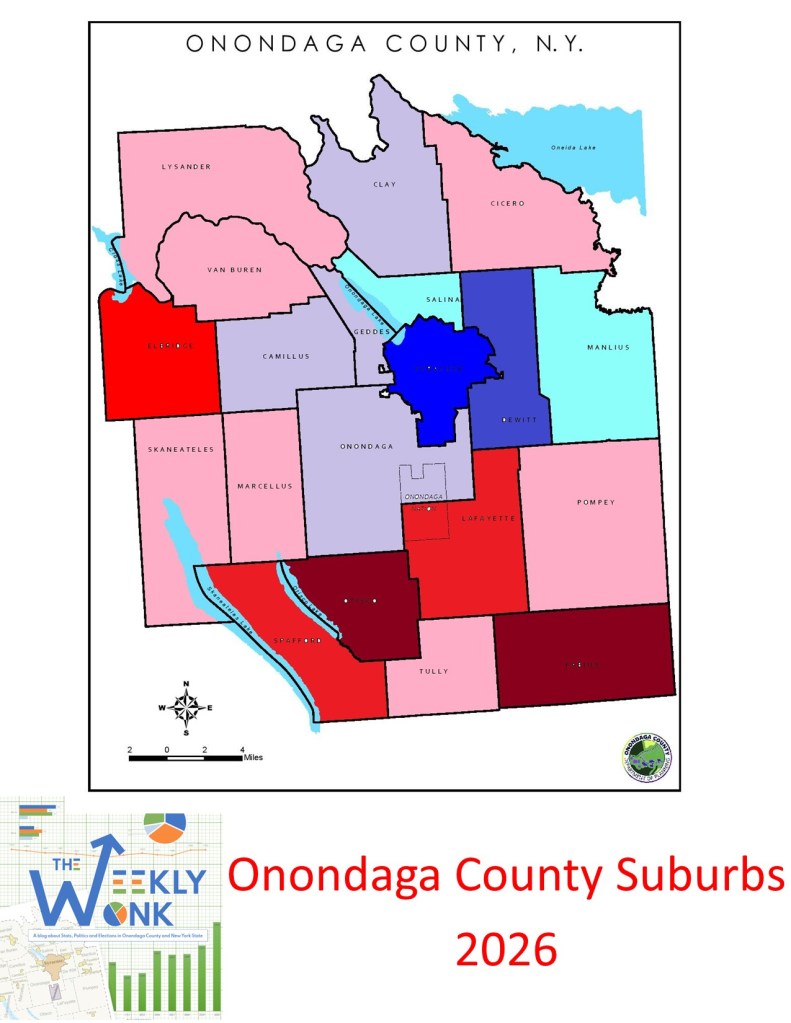
Looking at the five regions of Onondaga County, we find a truly diverse partisan story. The City of Syracuse is the third largest region but the highest number of Democrats and the highest partisan advantage with Democrats having a 40.51% advantage. The Northern region is the most populace but also even partisan wise. The second the greatest number of Democrats live here and the greatest number of Republicans. The GOP has a slight +1.02% advantage. The Eastern towns have gro2wn into a solid Democratic bastion with the third the greatest number of Democrats and a solid Democratic partisan advantage +10.20%. The western towns are the most evenly split region. It has the second the greatest number of GOP and fourth greatest number of Democrats, but the GOP only has a minuscule +.30% partisan advantage. The most solid GOP regions are the least populace region, the south. The GOP hold a +10.13%, Of note is where the non-enrolled outnumber a major party also seems to correspond to high partisanship in the region. Syracuse, the East, and the south all experience this pattern.
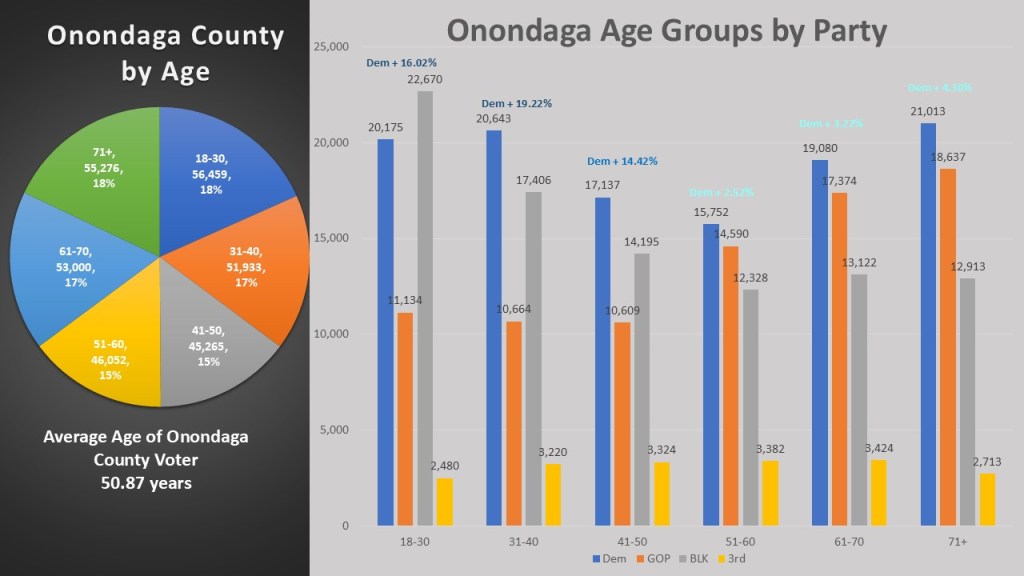
This year I want to introduce a new statistical category to analyze age. The average age of an Onondaga County active registered voter is 50.87 years old. In discussing age, I will break Onondaga County into 6 distinct age categories 18-30 54,459 voters (18%), 31-40 51,933 voters (17%), 41-50 45,265 voters (15%), 51-60 46,052 voters (15%), 61-70 53,000 voters (17%), and 71+ 55,276 voters (18%). When looking at the partisan trends of these age groups, Democrats have the advantage in all of them but to a varying degree. Democrats have a +19.22% advantage in the 31-40 group, +16.02% in the 18-30 group, +14.42% in the 41-50 group. In each of those groups the non-enrolled dwarf the GOP. However, in the upper range the Democratic candidates dropped to just +4.30% in the 71+, +3.22% in the 61-70, and +2.52% in the 51-60. These groups tend to be more partisan driven with less non-enrolled voters. Comparing these figures with voter turnout helps explain why elections in Onondaga County are highly competitive: older voters participate at higher rates than younger ones, and Democrats typically turn out less often than Republicans.
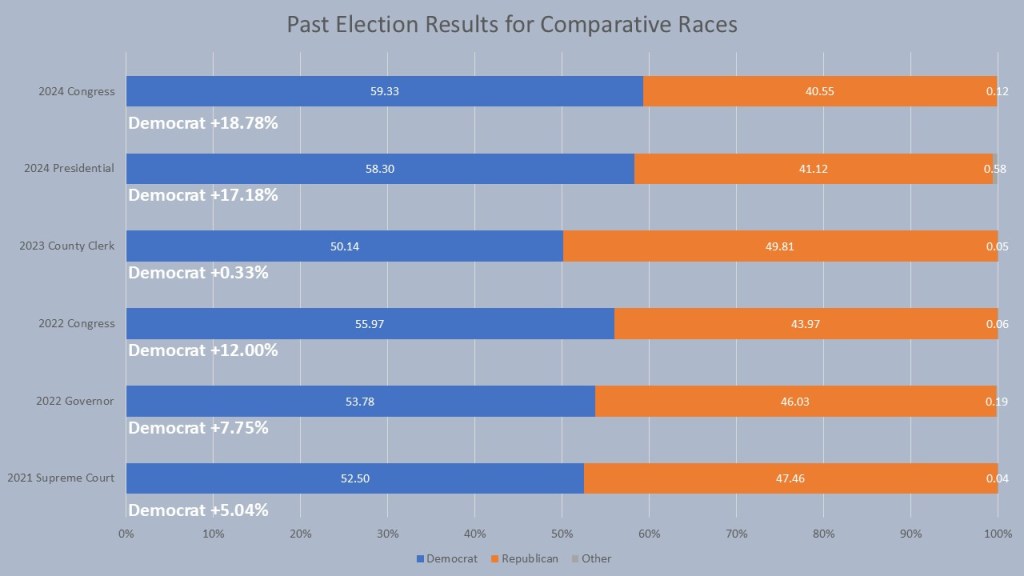
Finally, we look at the comparison races in Onondaga County. 2025 was an unusual year as we did not have a one-to-one race that covered all of Onondaga County to draw a comparison for how Onondaga County performed. So, I am drawing two races from 2024 to compare and two from 2022. Our two odd year comparisons, 2021 Supreme Court with Anthony Brindisis (+5.04%) and. 3 County Clerk with Emily Bersani (.33%) show what typical odd year elections mean for Onondaga County with tight races (Brindisis lost the Supreme Court race by about 9% by losing in the other 5 counties). In 2022, the last Gubernatorial year, Kathy Hochul won Onondaga County by 7.75% which was near how she won state-wide. For congress in 2022 the Democratic nominee Fran Conole won Onondaga County by 12.00% but lost the race by about 1%. J. Mannion in 2024 won the Congressional race in Onondaga County by 18.78% won overall by about 9%. Mannion did better than Presidential Candidate Kamala Harris who only won about 17.18% (down from 20% Biden won in 2020) which shows why Harris underperformed in less Democratic states in the country and lost the presidency to Trump.
That is it for this week’s edition of the #weeklywonk. Next week I will look at part 3 of my focus on Onondaga County as I will focus on the suburbs of Onondaga County. I will then the next week look at the City of Syracuse followed by the Onondaga County Legislature to close out our top-level look at our home Onondaga County going into 2026. As always you can follow along by subscribing to dustinczarny.com to get an email notification for all media and content updates.

3 thoughts on “The Weekly Wonk: Onondaga County Overall 2026”