Welcome back to the #weeklywonk. This is my weekly column reporting on electoral and registration data for Onondaga County and New York State. This column was on a bit of a break in late 2024 and 2025 with only occasional postings but is now back with vengeance. We are in the middle of my four parts looking at Onondaga County as we head into the new year. Last week I covered Onondaga County as a whole (found here https://dustinczarny.com/2026/01/01/the-weekly-wonk-onondaga-county-overall-2026/). This week I continue with part 2 of my look at Onondaga County with a focus on the suburbs and towns outside the City of Syracuse.
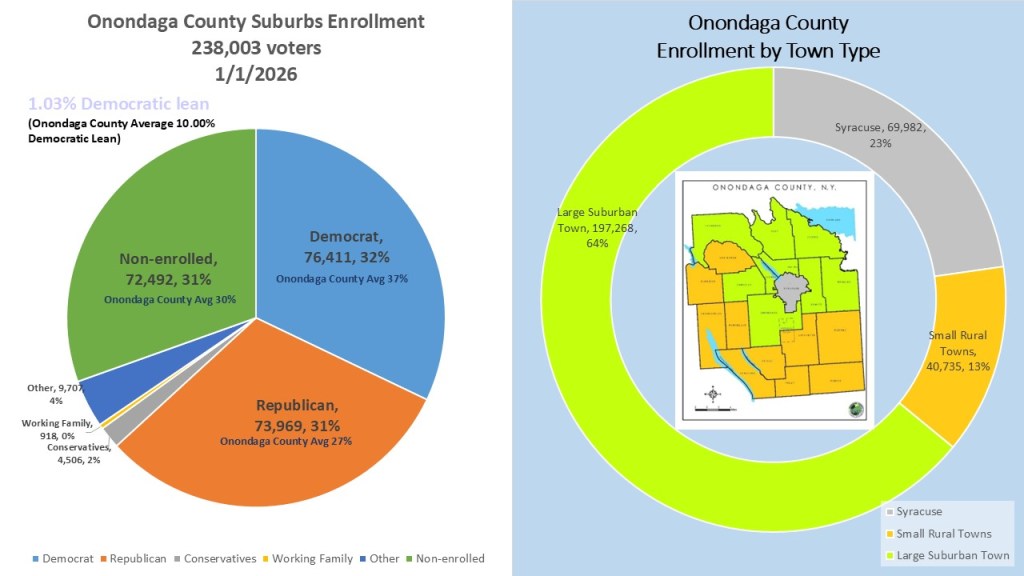
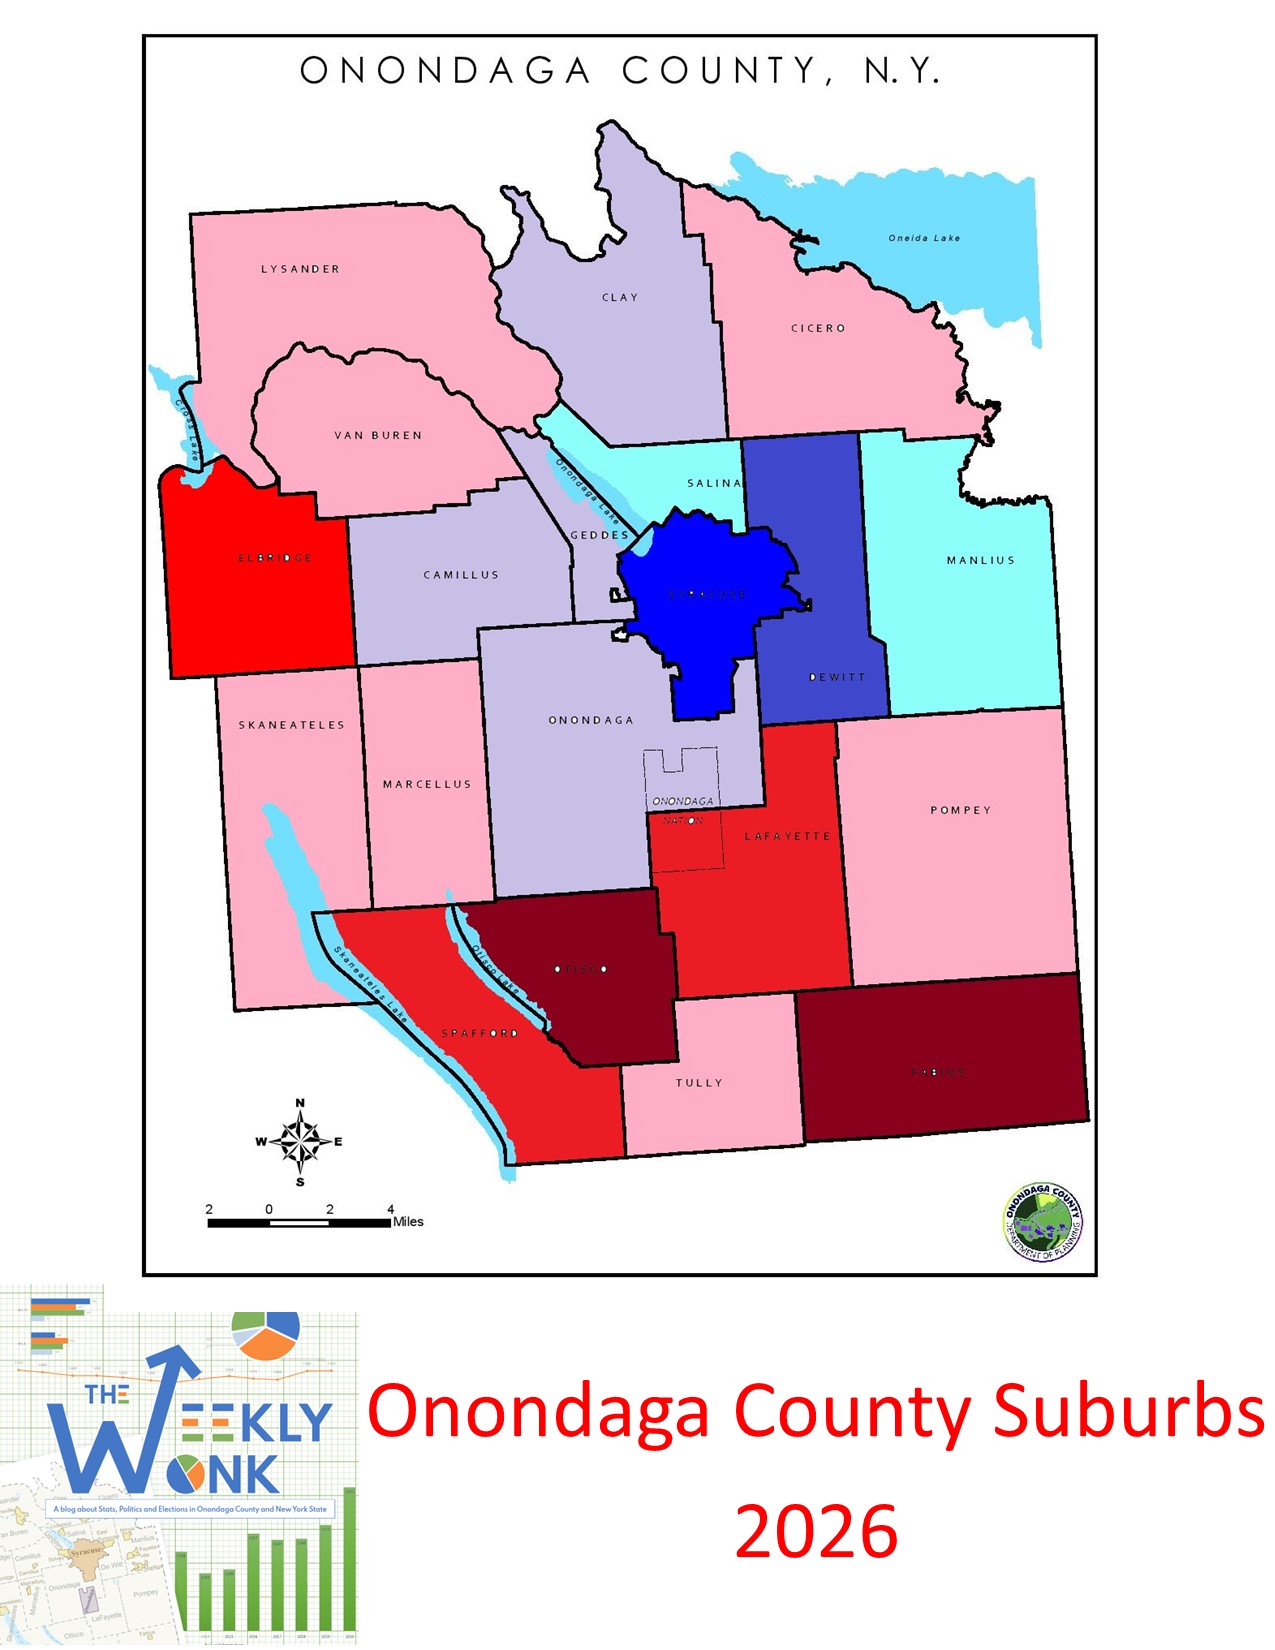
The voters outside of the city of Syracuse are evenly split. Of the 234,608 voters that live outside the City of Syracuse 32% are Democrat (76,411), 31% Republican (73,969), 29%, non-enrolled also 31% (72,492), the third parties make up about 6% (9,707 Other, 4,506 Conservatives, 918 Working Families). This means the areas outside the city of Syracuse have a 1.03% Democratic lean, which is down 10.00% Democratic lean in the county. I tend to look at Onondaga County in three distinct groups. The nine large suburban towns (Camillus, Clay, Cicero, Dewitt, Geddes, Lysander, Manlius, Onondaga, & Salina) with over 10k active registered voters, the 10 small rural towns (Elbridge, Fabius, Lafayette, Manlius, Otisco, Pompey, Skaneateles, Spafford, Tully, & Van Buren) with under 10k registered voters, and the City of Syracuse. The large suburban towns make up the majority of Onondaga County with 197,268 voters (64%), the City of Syracuse is second with 69,982 voters (23%), and the smaller rural towns make up the smallest voter count with just 40,735 voters (13%).
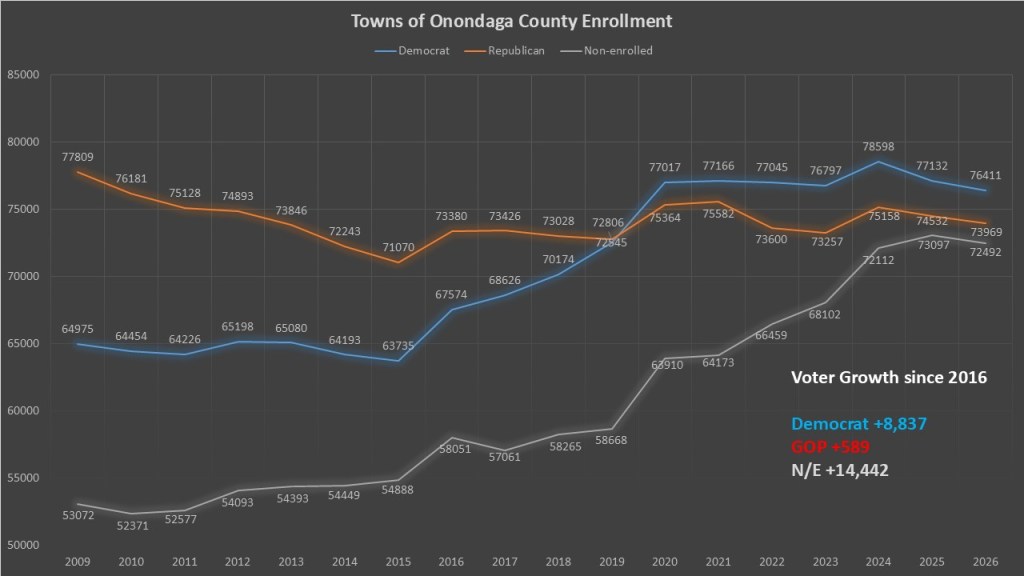
The Democratic rise in the voters outside of Syracuse is the driving factor that has turned our county blue. We see in this chart the rise was dramatic during the first Trump term (2016-2020) and since then the parties have leveled off. However, the rise of the non-enrolled in the suburbs is the most 2016 is the sea change year. Democrats grew by 8,837 voters outside the City of Syracuse since 2016, while the GOP gained just 589 voters. The non-enrolled explosion in Onondaga County can also start in 2016 and it has added 14,442 voters to their ranks. They are the biggest growing segment and the only segment significantly growing since 2020.
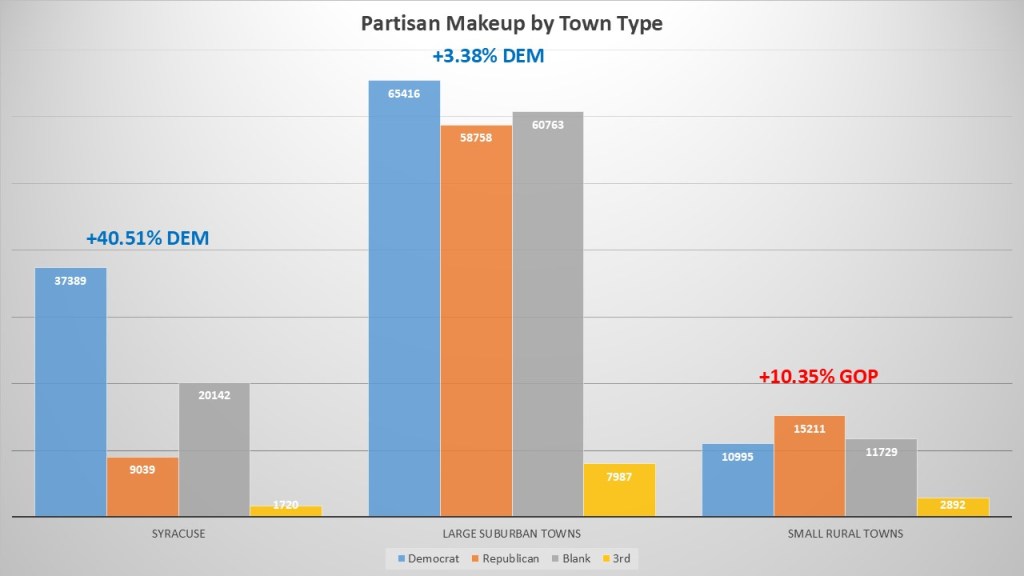
The partisan makeup of the three portions of our county is vastly different. Democrats dominate the City of Syracuse with a +40.51% enrollment advantage. Democrats also have a slight registration advantage in the large suburban towns with a +3.38% enrollment advantage. Republicans dominate the small rural towns with a +10.35% enrollment advantage. The non-enrolled dwarf the GOP inside the city adding to their disadvantage there. They also slightly eclipse the GOP in the large suburban towns while slightly overtaking the Democrats in the small rural towns. This pattern of the n/e mimics the growth and parity in these regions overtaking a major party in all three regions.
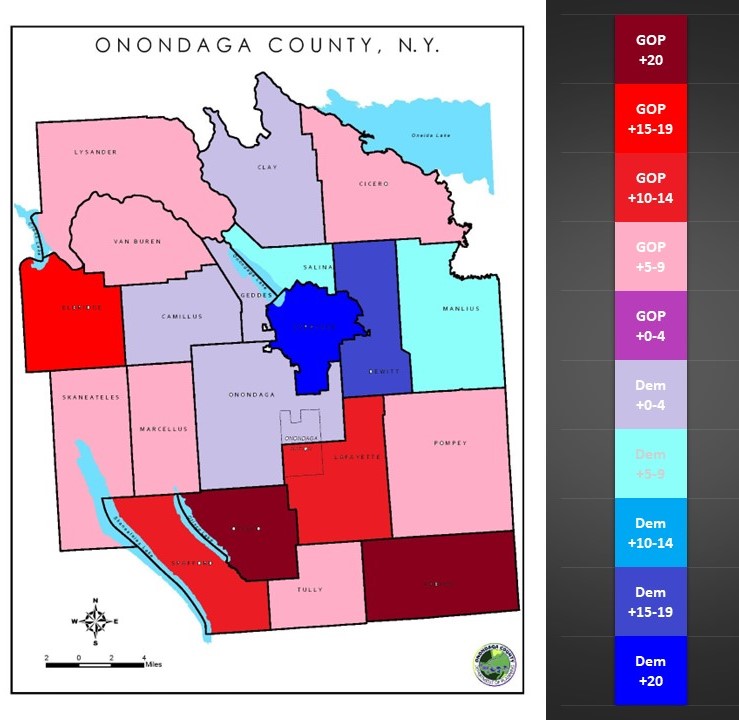
When looking at the heat map of the towns of Onondaga county individually we see definitive stratification and diversity of the amount of partisan lean in a town. Syracuse is overwhelmingly Democrat in the +20% partisan advantage range. Dewitt follows next with a strong Democrat advantage in the 15-19% range. Two more towns, Salina and Manlius, are in the lean Democratic range of 5-10%. Camillus, Clay, Geddes, and Onondaga are the borderline Democratic towns in the 0-5% range. Cicero, Lysander, Marcellus, Pompey, Skaneateles, Tully, and Van Buren are in the lean Republican range of 5-10%. Lafayette and Spafford are in the moderate GOP range of 10-15%. Elbridge is in the strong GOP range of 15-20%. Finally, Otisco and Fabius round out the towns in the overwhelming GOP range of +20%.
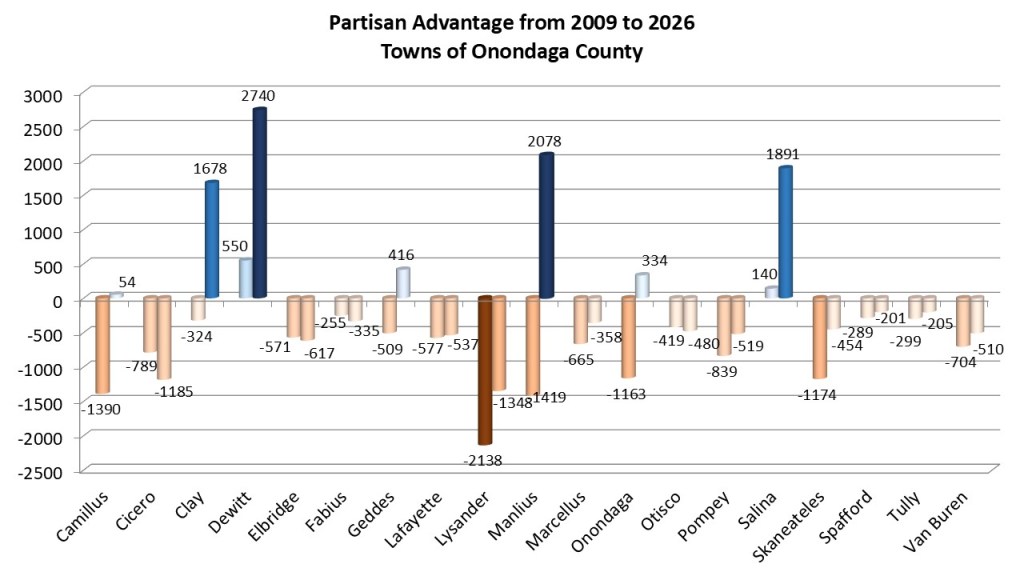
This chart shows the changes in individual towns since 2009. Looking at the registration rates since 2009 it is important to note that most towns shifted toward the Democratic party in partisan difference between Republicans and Democrats. Dewitt and Salina were slight Democratic towns in 2009 and shifted well towards the Democrats. The towns of Camillus, Clay, Geddes, Manlius, and Onondaga reversed from GOP towns to Democratic towns in terms of partisan advantage. Lafayette, Lysander, Marcellus, Pompey, Skaneateles, Spafford, Tully, and Van Buren remained GOP lean towns, but Democrats cut into the partisan advantage. Cicero, Elbridge, Fabius, & Otisco were the only towns that shifted to the GOP over that time frame.
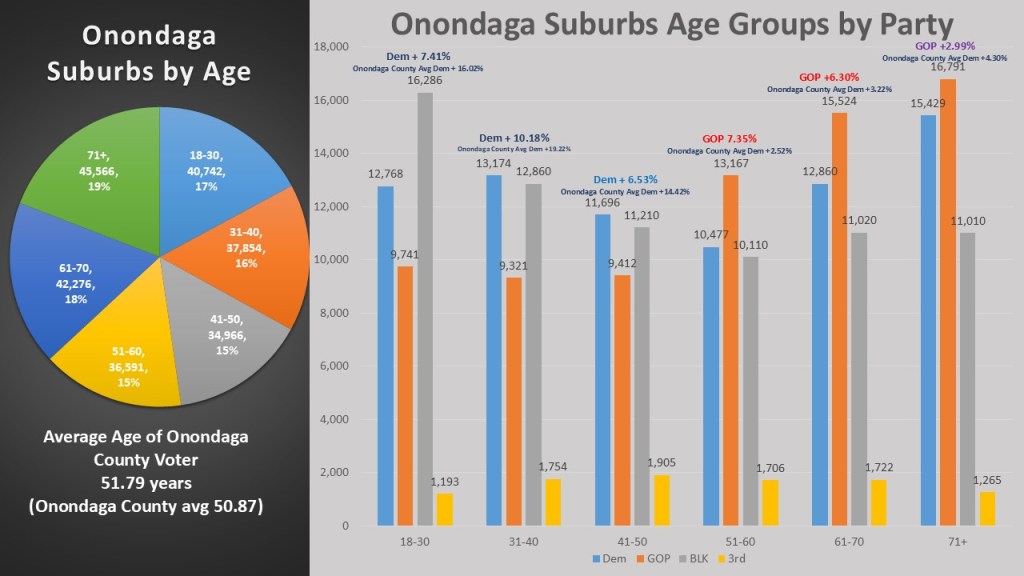
I am introducing age as a statistic I am tracking this year with my #weeklywonk breakdowns. What we are seeing about the places outside the City of Syracuse is they are older than the rest of the county. The average age of non-city voters is 51.79 years old. That is almost one year older than the Onondaga County average of 50.87 years. T=Every age group is also more republican than the age group average of Onondaga County as a whole. When looking at the voting age groups, Democrats and Non-enrolled Dominate the 18-50 ranges like they do in Onondaga County as a whole. However, the GOP dominates the 51-71+ranges. The age groups tend to run 6-9% more GOP than their counterparts in the county.
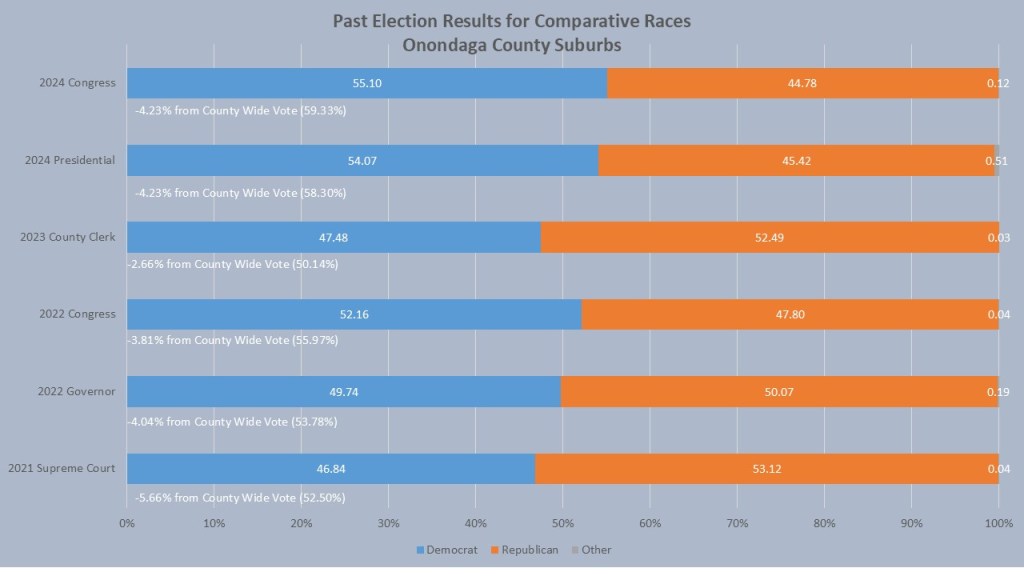
Despite the GOP having a significant sway in in partisan leans, when it comes to results in the recent races we are comparing, the Democrats have tended to outkick their coverage. Democrats won both the 2024 Presidential election and Congressional election in the non-city areas by only 4.23% less than they won in Onondaga County. There was a similar outcome in the 2022 congressional race with Democrats winning but with 3.81% less than they won Onondaga County. They lost the Governor’s race in the non-city portions but only underperformed the Onondaga County average by 4.04%. The best performer in the towns when compared to their overall average was Emily Bersani for County Clerk in 2023 only trailing by 2,66%, The worst performer in the towns was Anthony Bersani in the 2021 Supreme Court race trailing his overall performance by 5.66%. This data suggests that in the competitive races the non-enrolled and nonpartisans in the non-city areas tends to align with the Democrats more than the GOP.
That is, it is for this week’s edition of the #weeklywonk. Next week I will continue looking at the regions of Onondaga County as we head into 2026. The City of Syracuse will be the focus of part 3 launching either Wednesday or Thursday of next week. In the meantime, you can subscribe to dustinczarny.com for all content and election news updates.

One thought on “The Weekly Wonk: Onondaga County Suburbs 2026”