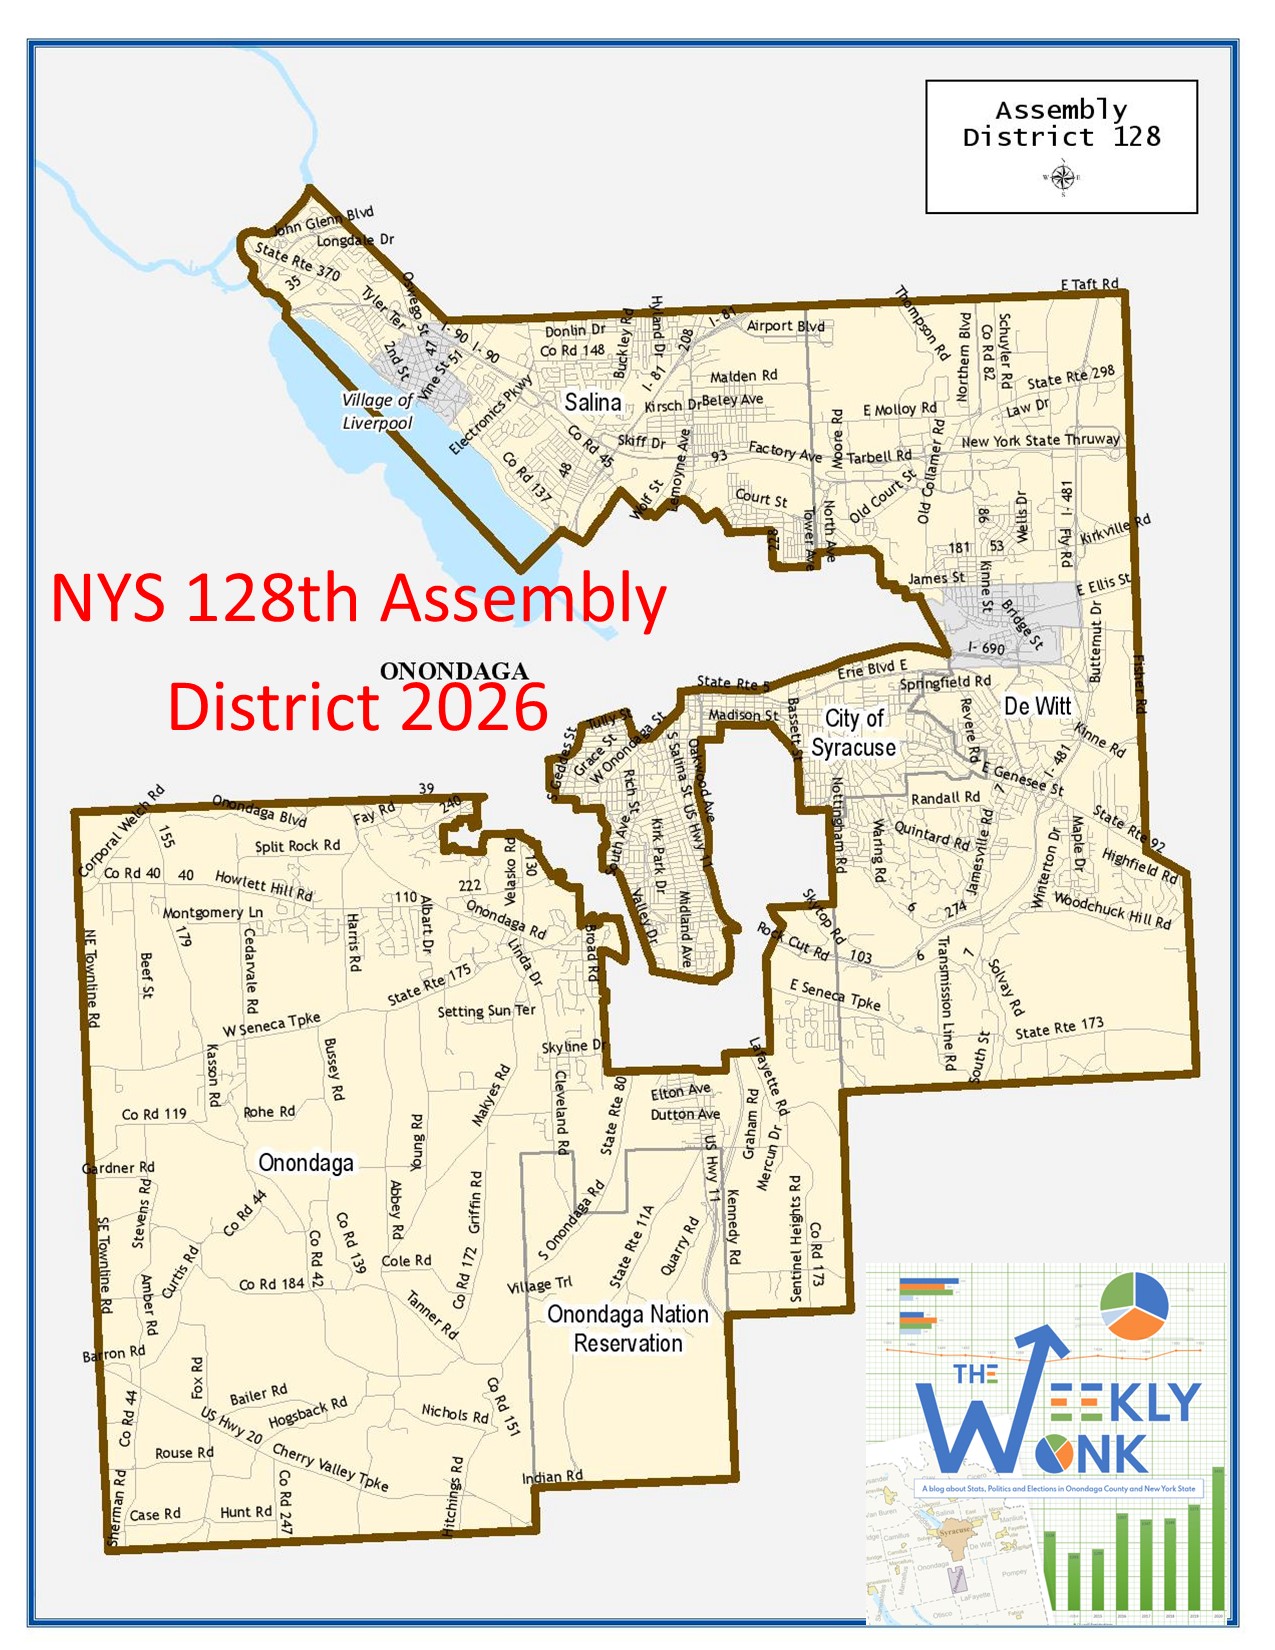
Welcome back to the #weeklywonk. This is my weekly article on dustinczarny.com on statistics and data. Each week I look at a political subdivision having a competitive election this fall and analyze the registration, electoral, and other pertinent data that encompasses it. This helps you understand the story behind election results in our home of Onondaga County. This week I will continue my investigations of the 4 Assembly districts that represent Onondaga County. NY Assembly district 128th represents towns of Dewitt, Onondaga, and Salina and a good portion of the City of Syracuse in Onondaga County. AD 128 represents this district serving from 2008-10 and continuously since 2012.
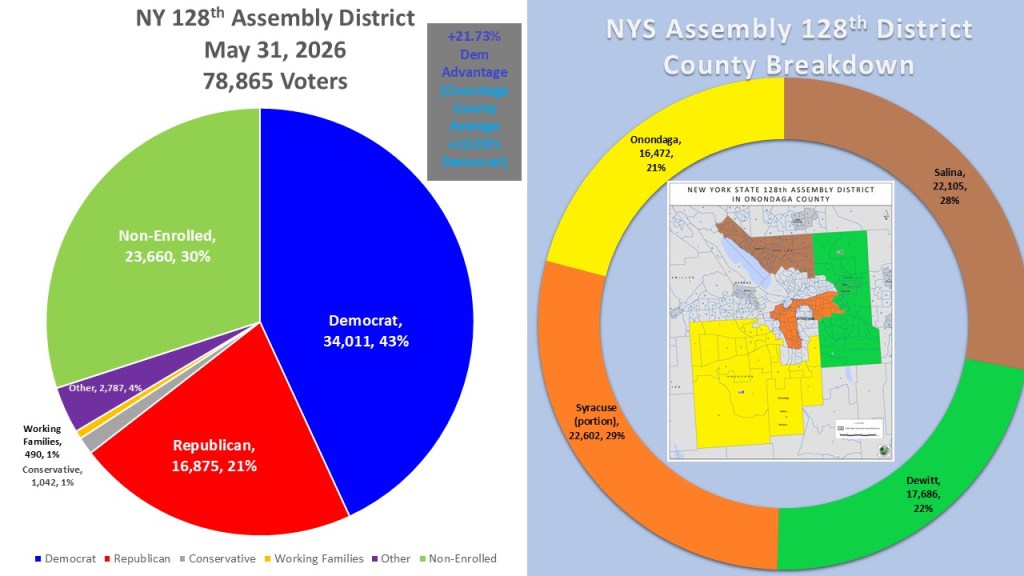
NY Assembly District 128th is inside Onondaga County. This means that this weekly work can solely rely on data from the Onondaga County Board of Elections. As of May 31, 2026, we see the district has 78,865 active voters. Democrats hold a large plurality with 34,011 voters (43%). The non-enrolled are second, with 23,660 voters (30%). The GOP is a distant third with 16,875 voters (21%). Rounding out the registration is the other category (2,787, 4%), Conservative Party (1,042 1%), and Working Families (490, 1%). The Syracuse portion has the greatest plurality in the district with 29% (22,602 voters) of the active voters. In a remarkably close second place is Salina with 28% (22,105 voters). Dewitt is third with 22% (17,686 voters) and Onondaga is close fourth with 21% (16,472 voters). Overall, this district split even between these four political subdivisions.
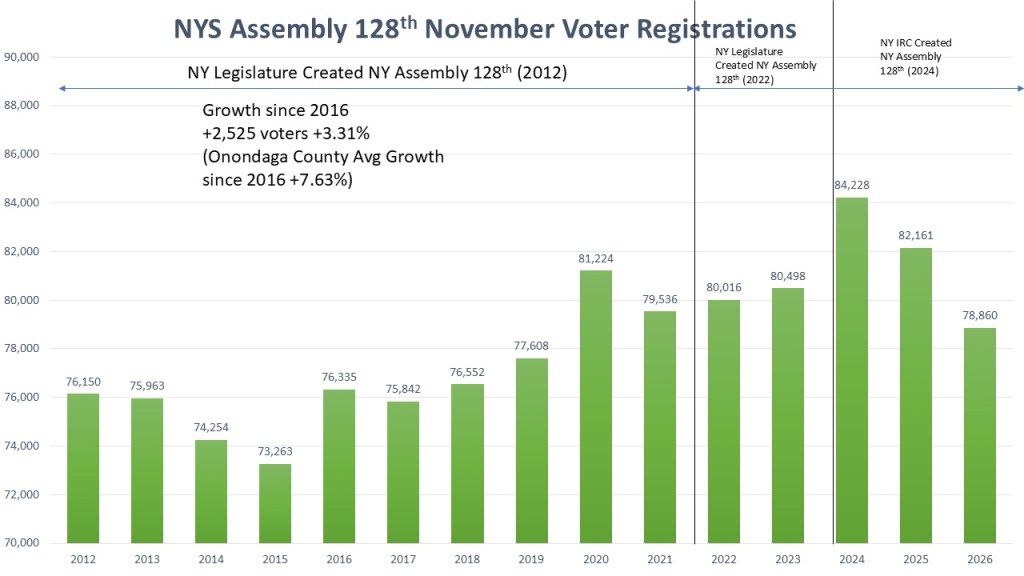
As we noted in the last couple of weeks, the story of redistricting for Assembly districts is a little different than the Senate and Congressional districts. Like the Congressional districts, Assembly members have run on three different maps of the last three cycles, but the Assembly district maps were never drawn by the NY Judiciary as they were never part of the lawsuit in 2022 thus the NY Legislature maps created in 2022 stood until a separate lawsuit required the NY IRC. Like most Assembly Districts, AD 128 there was no change in the 2012, 2022 & 2024 maps. There were also only minor changes around borders inside the City of Syracuse portion of the district. One of the advantages of having a district inside Onondaga County is getting up to date registration information. But this is why we see a major drop in registrations in n2026. The mail check cards along with NVRA and National Change of Address. All of this is how we clean our voting rolls by taking voters off the active rolls that have mail returned. This adversely affects the City of Syracuse and specially the east side with high student voter population who are very transitory in non -presidential years, This is why the growth of the district since 2016 is essentially flat, with growth only being 2,525 voters, a growth rate of 3.31% slower than the growth rate we saw in Onondaga County during that period of 7.63%.
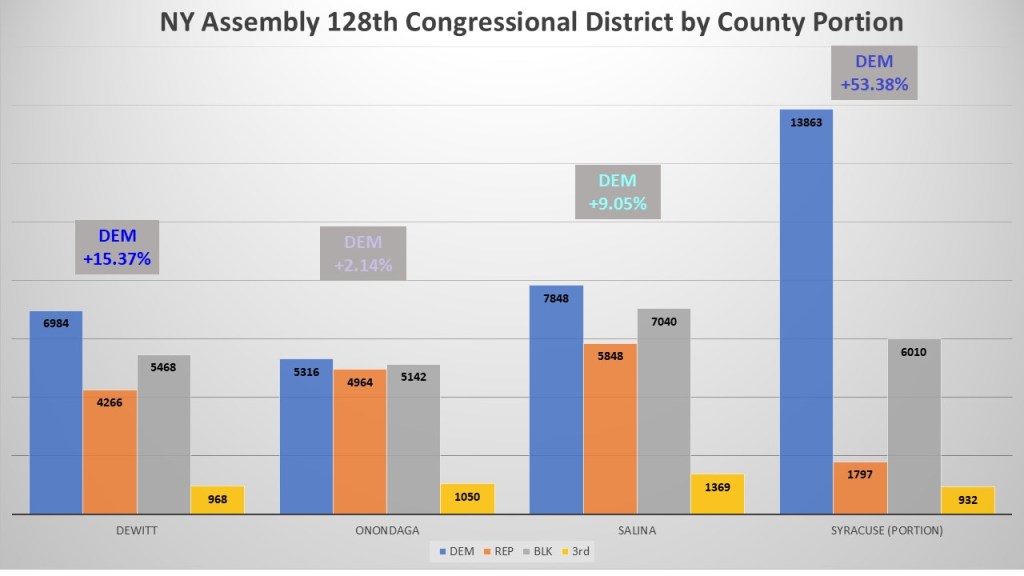
Focusing on the district’s four political subdivisions reveals how the City of Syracuse portion dominates the district. While overall the City of Syracuse portion is not that much more in voters than the other three, the extreme partisan domination of Democrats in the district shapes the partisan leans of the district. Democrats enjoy a +53.38% partisanship lean with Democrats have seen times more and non-enrolled have over three times more voters than Republicans. However, Democrats also dominate the towns of Dewitt (+15.37%) and Salina (+9.05%). The town of Onondaga even has a border line Democratic lean of +2.14%. What is also interesting is even in the towns non-enrolled outnumber the Republicans.
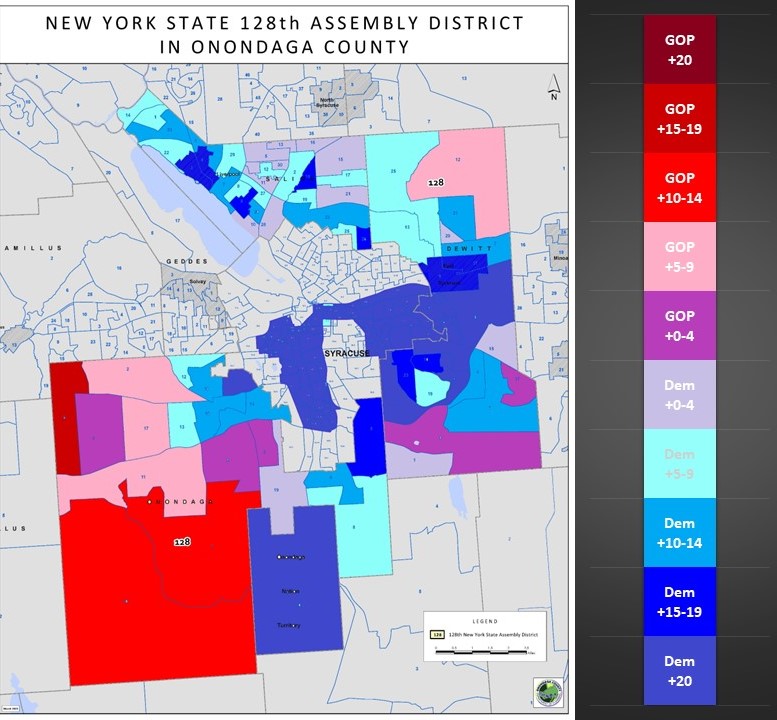
Another advantage to analyzing a district inside of Onondaga County is more data readily at hand. This allows me to get a little more granular on our heat map. In this map I color code the leanings of every election district in the 128th. Here we see that Syracuse is dominant blue but so are portions of Dewitt Salina, and Onondaga that border the city. In fact, all of Salina districts have a Democratic lean. There are only seven election districts in the entire district, one in Dewitt, and six in Onondaga that have definitive GOP leans. The are also five more election districts with borderline GOP leans noted by the dark purple (3 in Onondaga and two in Dewitt. Outside of that everywhere on the map has a Democratic lean, and often it is definitive.
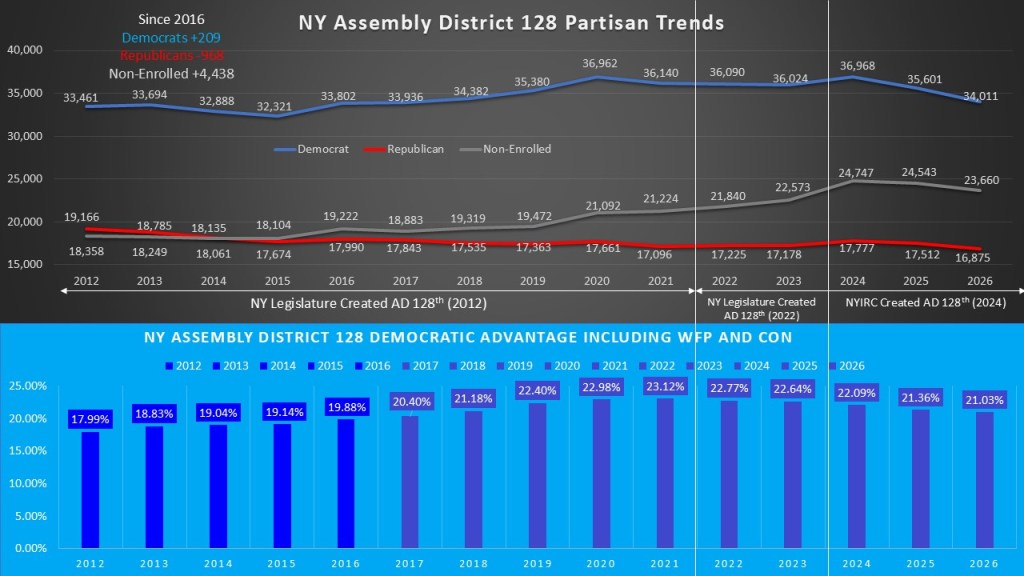
Looking at the district’s partisan trends the stableness of the district has led to flat partisan baselines of Democrats and Republicans. Since 2016 Democrats have only gained 209 voters. In the inverse the GOP has done a tad bit worse, losing 968 voters since 2016. Like most districts the non-enrolled surge is prevalent. Since 2016 non-enrolled have gained 4,438 voters. The rise of the non-enrolled and flattening of the Democratic growth is also flattening the ideological gain of this district. When we add the WFP to the Democratic column and the conservatives in with the Republican the difference is the ideological leaning of the district. The district grew consistently from 2012 (+17.99%) to 2021 (+23.12%). However, as the partisan lines flatlined and the non-enrolled grew, we have seen a retreat since then to just +21.03% in 2026.
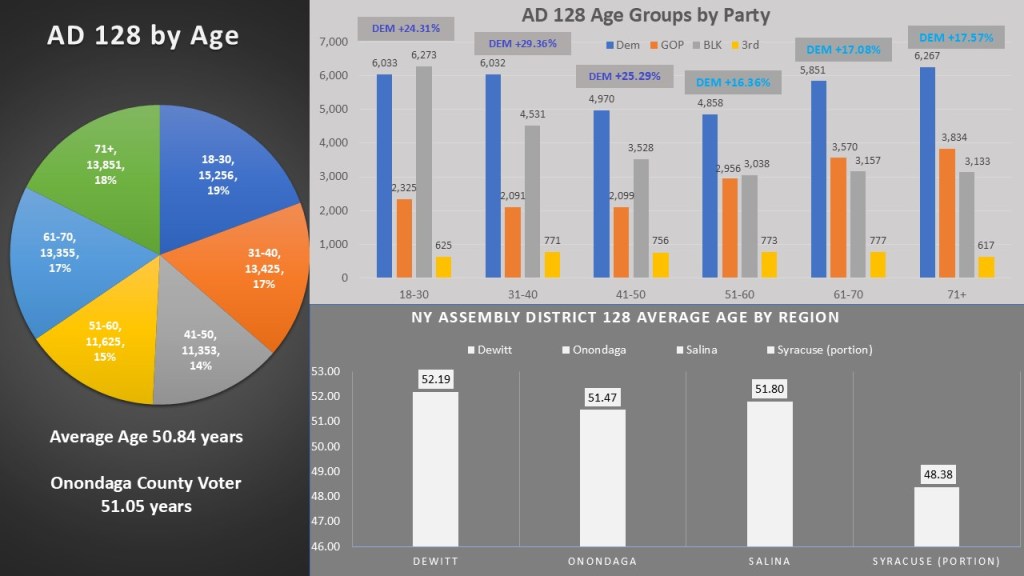
Once again, the fact this district lays entirely inside of Onondaga County I have more tools to use to get a good picture of the district. This year I wanted to look at the age registered voters to get an idea of the differences in different communities. Eagle-eyed readers will see that the average age of Onondaga County has risen a bit to 51.05 years (from 50.87 in March). That is because of the mail checks that I mentioned earlier disproportionally affects the SU Student population and younger population that are more transient and less likely to update their address. This does not mean they will not get to vote if they are still here, they will just have to update their address with us or vote by affidavit. The age groups are typical with an even split amongst the groups and the under 50 groups having a large non-enrolled population as compared to 51+ groups. The differences in ages really come in the Towns and Syracuse portion. All three towns Dewitt (52.19), Salina (51.80) and Onondaga (51.47) are older than the average age of the county and Syracuse portion (48.38) is much younger. This is another way Syracuse exerts its dominance on the district.
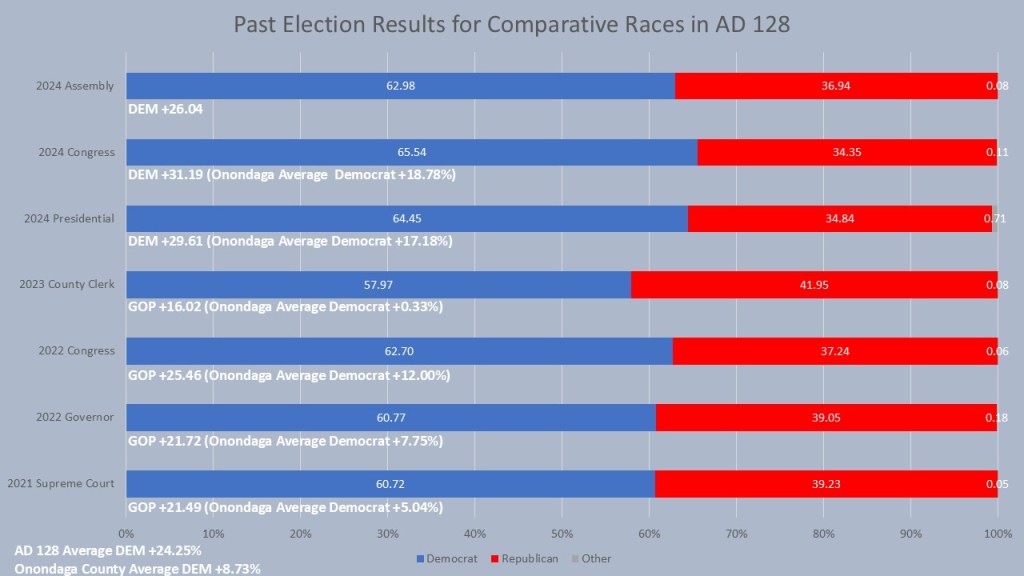
Now that we are back in Onondaga County, I can use our system to look at the comparison races for this year. This gives us an idea of how this district performs in comparison to the rest of the county in similar races. First off, we look at the last result in the district itself in 2024. Pam Hunter won re-election with 26.04% of the vote. This is a little behind where Mannion for Congress (+31.19%) and Kamala Harris (+29.61) ran in the district. In the mid-term year in 2022 Governor Hochul won the district by 21.72% and Fran Canole won the district by 25.46%. This district performs differently in odd years with Emily Essi’s county clerk race only winning the seat by 16.02% and the 2021 Supreme Court race, Brindisi won this district by 21.49%. Still, it is a solidly performing Democratic district the six comparative races the district averaged +25.46% for the Democrats while Onondaga County averaged +8.73% in those races.
That is all for this week’s edition of the #weeklywonk. Next week I will continue my look at the county Assembly districts with AD 129 represented by Bill Magnarelli. Once again, we are on races inside Onondaga County, meaning I can get fresh data, including age data, back into the analysis. As always, you can subscribe to dustinczarny.com for all content and election news updates.
