
It’s the formal return of Wonky Wednesday! Each week I hope to do a deep dive into data that can bring insight into elections in Onondaga County and NY State. This week I take a look back at the November presidential election. As you may remember when the voting was done Democrats did quite well in Onondaga County. They picked up a Supreme Court Justice (Rory McMahon) 2 Family Court seats (Julie Cerio & Christina DeJoseph) and NY Senate 50th (john Mannion) while successfully defending NY Senate 53 (Rachel May), and NY Assembly 127 (Al Stirpe), 128 (Pam Hunter), and 129 (William Magnarelli). The GOP successfully defended US Congress 24 (John Katko), NY Assembly District 120 (Will Barclay) and 126 (Greg Lemondes). These victories though were mostly possible as those districts extended into neighboring counties. In fact in Onondaga County it is likely Dana Balter would have won the county if not for the appearance of Steve Williams on the Working Families line that drew likely Democratic votes from her totals.
Part of the story of why Democrats did so well in Onondaga County is the massive record breaking voter turnout in 2020 in both raw numbers and percentages. Onondaga County entered the November election with a record high voter turnout of 308,402. This surpassed the previous record of 306860 set before the 2004 election and was a gain of 22540 since the 2016 Presidential Election (285,756). This is despite a pandemic making traditional voter registration drives nearly impossible.
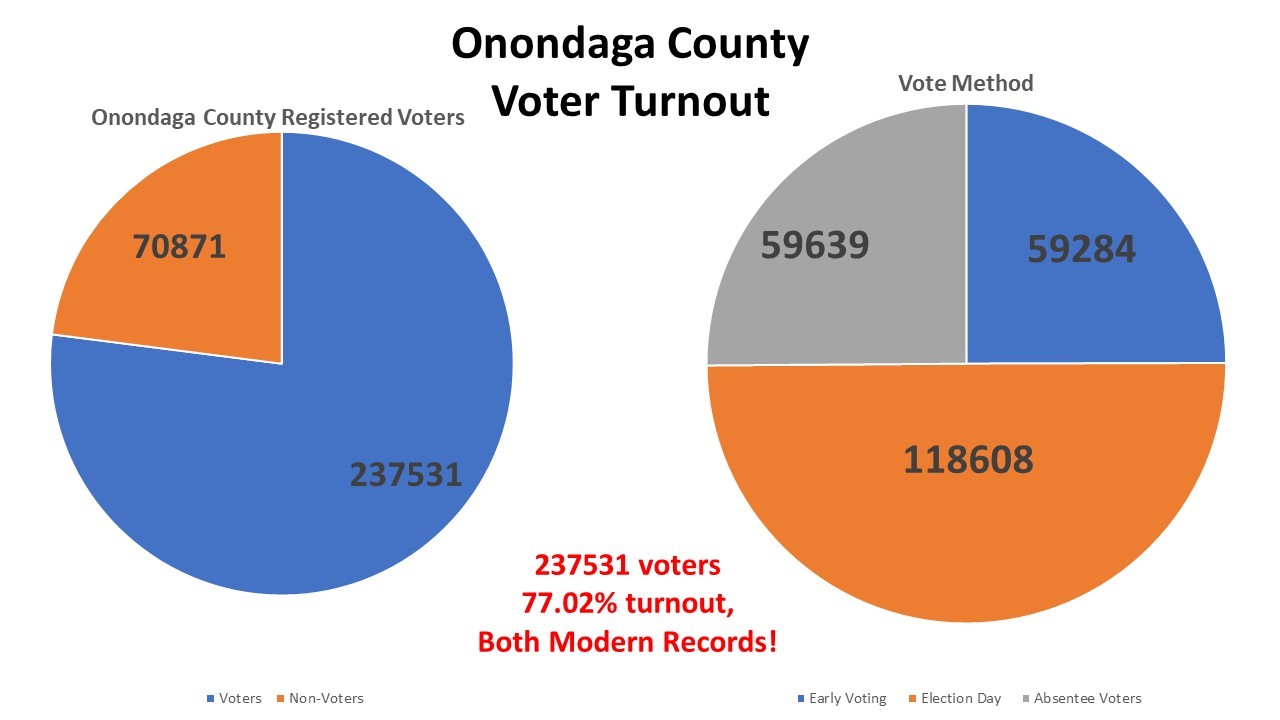
A big story of this election is not just the number of voters but the way in which they came to the polls. In 2019 Early Voting was introduced and during the summer of 2020 because of the onset of the COVID-19 pandemic stringent rules on Absentee voting were lifted creating a nearly ubiquitous Vote by Mail option for voters. These options proved to be quite popular for voters in 2020. Only 49.9% of voters chose to vote on Election Day in 2020, 25.1% chose to vote from the safety of their homes, while 25% chose the convenience of Early Voting. This is a tidal change in how voters chose to exercise the franchise and likely will continue until we eventually see equal 1/3 shares in future years.
The fervor of the Presidential Election combined with this high registration number to result in 237,531 voters that came to the polls which reflected a turnout rate of 77.02%. This surpassed the previous records from the 2008 election of 224,032 and a turnout rate of 76.83%. Its also not surprising given the enrollment edge in Onondaga County that Democrats made up a large portion of the voter turnout at 39%. This is slightly better than the 38% share that Democrats make up in the County of Onondaga.
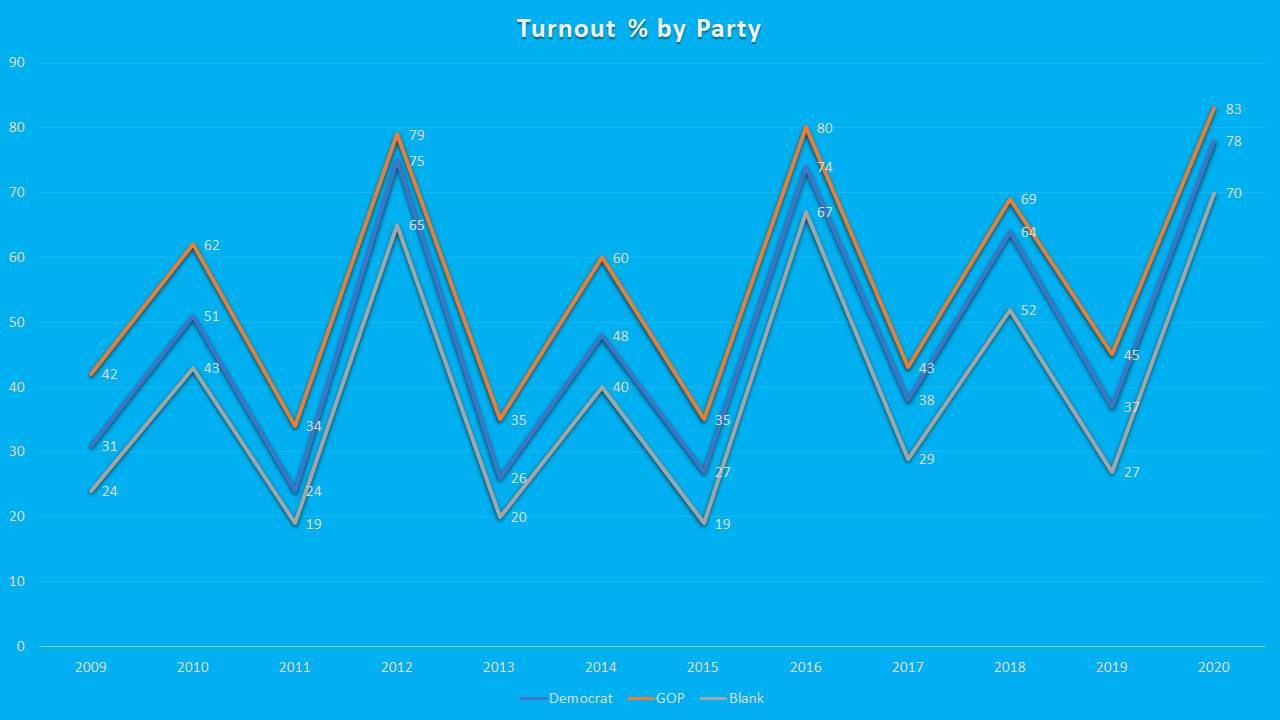
Though Democrats over performed their voter enrollment share, so did Republicans by an even bigger margin. The GOP continues to have better turnout as a percentage then Democrats. Though both parties as well as non-enrolled all saw record turnout rates, the GOP continues to outpace both Democrats and non-enrolled. Non-enrolled voters continue to be the least participatory in voting no matter the year as well. Democrats need to do a better job at increasing their turnout as well as turning out non-enrolled voters that align with their candidates.
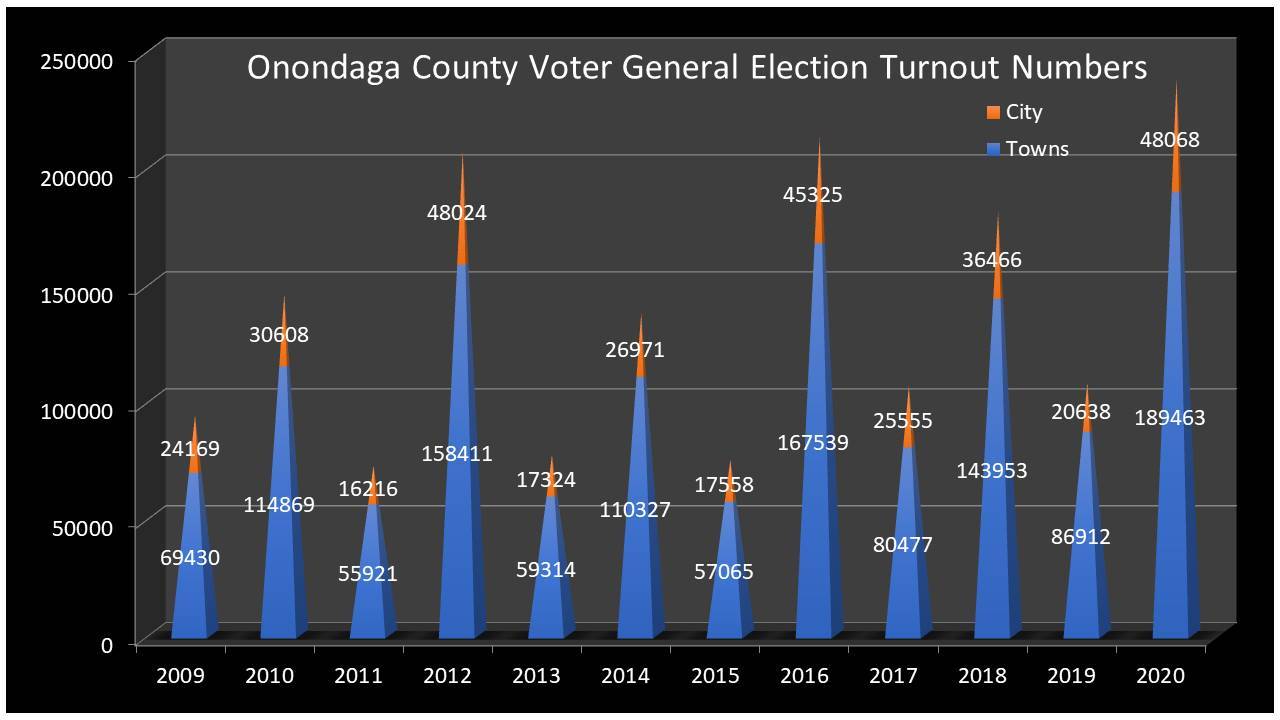
The City of Syracuse tends to dominate the media market and lexicon of Onondaga politics. However its actual vote share continues to decrease. As we can see in this chart the City of Syracuse is just over 1/5th of the actual vote share in Onondaga County. The large suburban towns is where most of the vote lies in county wide races. We will do a deeper dive on town data later as well as the City of Syracuse. It is worth noting though the City of Syracuse vote share in Onondaga County is not as big as it once was falling from about a 1/4 share to 1/5 share the last few years.
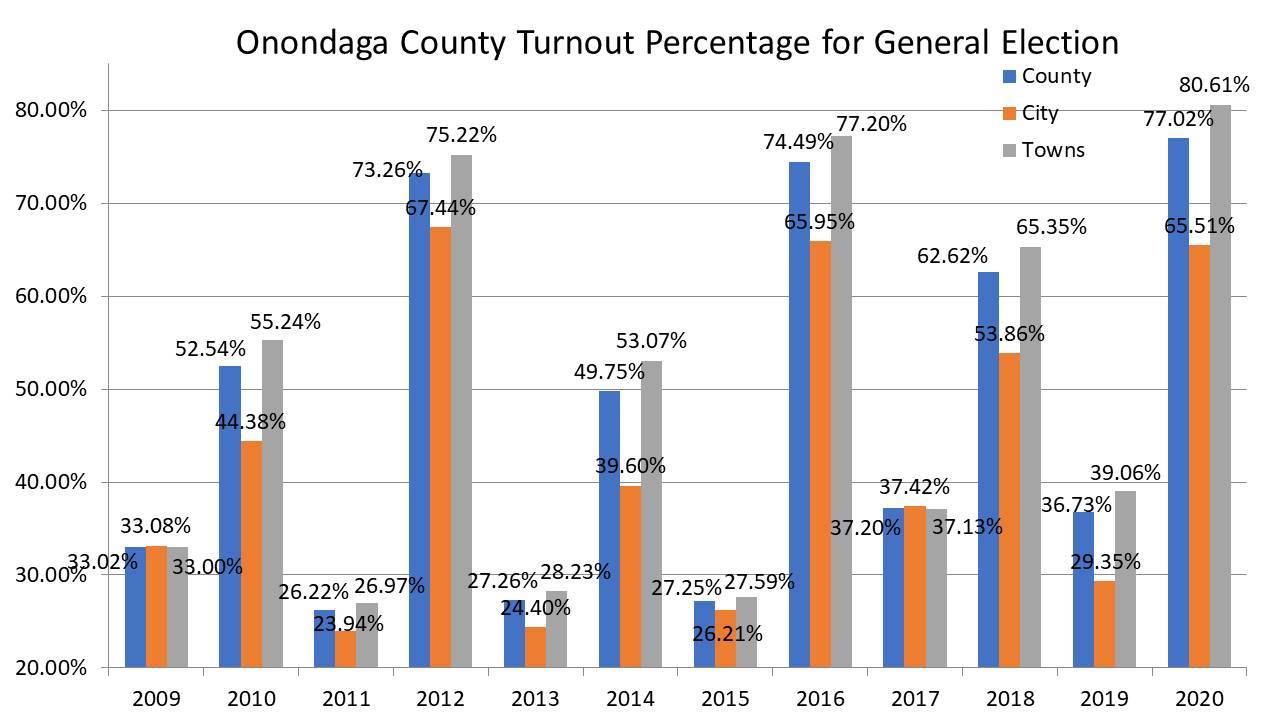
The high voter percentage in Onondaga County was not distributed equally and may be contributing to why the City vote share continues to fall. Towns and the suburbs continue to have a significantly higher voter turnout among its growing population and the City of Syracuse continues to fall behind with a shrinking population. the 15% gap amongst turnout in the Towns and the City of Syracuse in 2020 is the highest on record. The lack of competitive city races in general elections may be a contributing factor. The only time where City turnout has been higher than the towns is 2009 & 2017, both open races for Syracuse mayor. Even then the difference was less than a percentage point. With an overwhelmingly Democratic city driving up city turnout is key to further county wide Democratic victories.
