
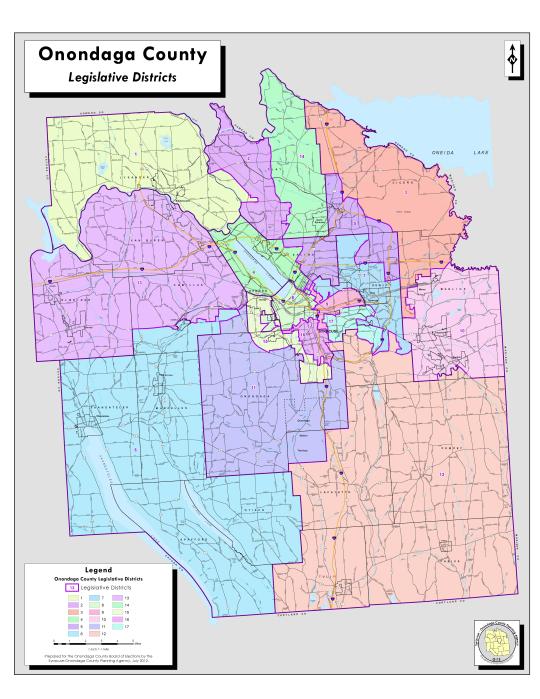
Welcome to Wonky Wednesday! Today I start to turn the page on the 2020 election and look ahead to the 2021 elections. Over the next few months I will take a look at the 19 towns including the City of Syracuse as well as the 17 Onondaga County legislative seats (pictured above). However we will kick it off today by looking at the overall picture in Onondaga County. Though no one person is on the ballot countywide I think it will be helpful to take a look at the ever more blue county we live in.
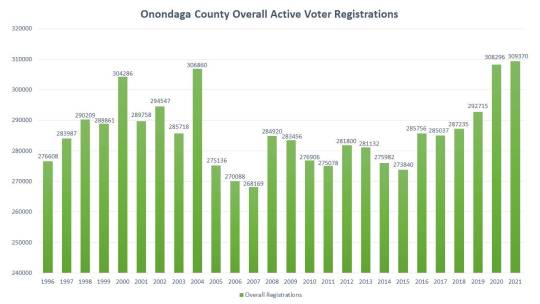
Onondaga County continues to grow our record registration levels post election. This will likely continue for the next three months. The initial registration surge post election came from affidavit and court order voters that were added to the rolls. however we are currently about 12k voter registration forms in backlog as we recover from our late certification. Some of these are moves and party changes however many of them are new voters and we continue to add 18 year old pre-registered voters each month who age into active voter status.
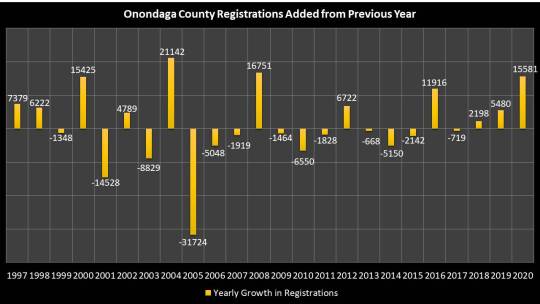
We added 15,581 voters in Onondaga County in 2020 as compared to 2019. This is the highest single year jump since the 2008 election of Barack Obama. This is not just a one year gain though. Since 2016 Onondaga County added over 22.5k voters. This is the most productive voter registration gains since the 2000 presidential election. Those gains were mainly due to the newly enacted Motor Voter laws which transformed the voting electorate. The last 4 year gain is quite remarkable and part of a statewide trend to register more voters of the eligible adult population.

Democrats are continuing to strengthen their lead over the GOP in Onondaga County. The big question is will the enrollment advances that went accelerated after the 2016 Donald Trump election continue at the sharp pace we have seen or will it level off or even reverse. The other question is can local Democratic candidates in 2021 translate this large enrollment edge into local year victories. As we saw with our previous dive into turnout, Democrats tend to turn out at less of a rate, specially in local years.
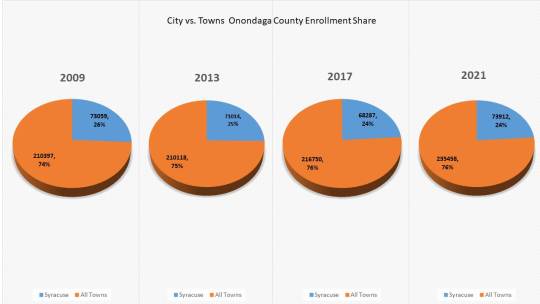
The final slide deals with the City vs. town share of Onondaga County. It looks as if the City of Syracuse has stabilized the trend of a steady decline in the percentage of the voter registration in our county. Since 2009 the City of Syracuse has lost about 2% of the county share, but that took place mostly from 2009 to 2016. The City of Syracuse kept pace with the large voter registration gains in Onondaga County. This is specially hard for most urban centers, specially one with a significant college population which has large turnovers.
Over the next couple of weeks we will take a look at the City of Syracuse in depth and then turn to the Towns of Onondaga County.
