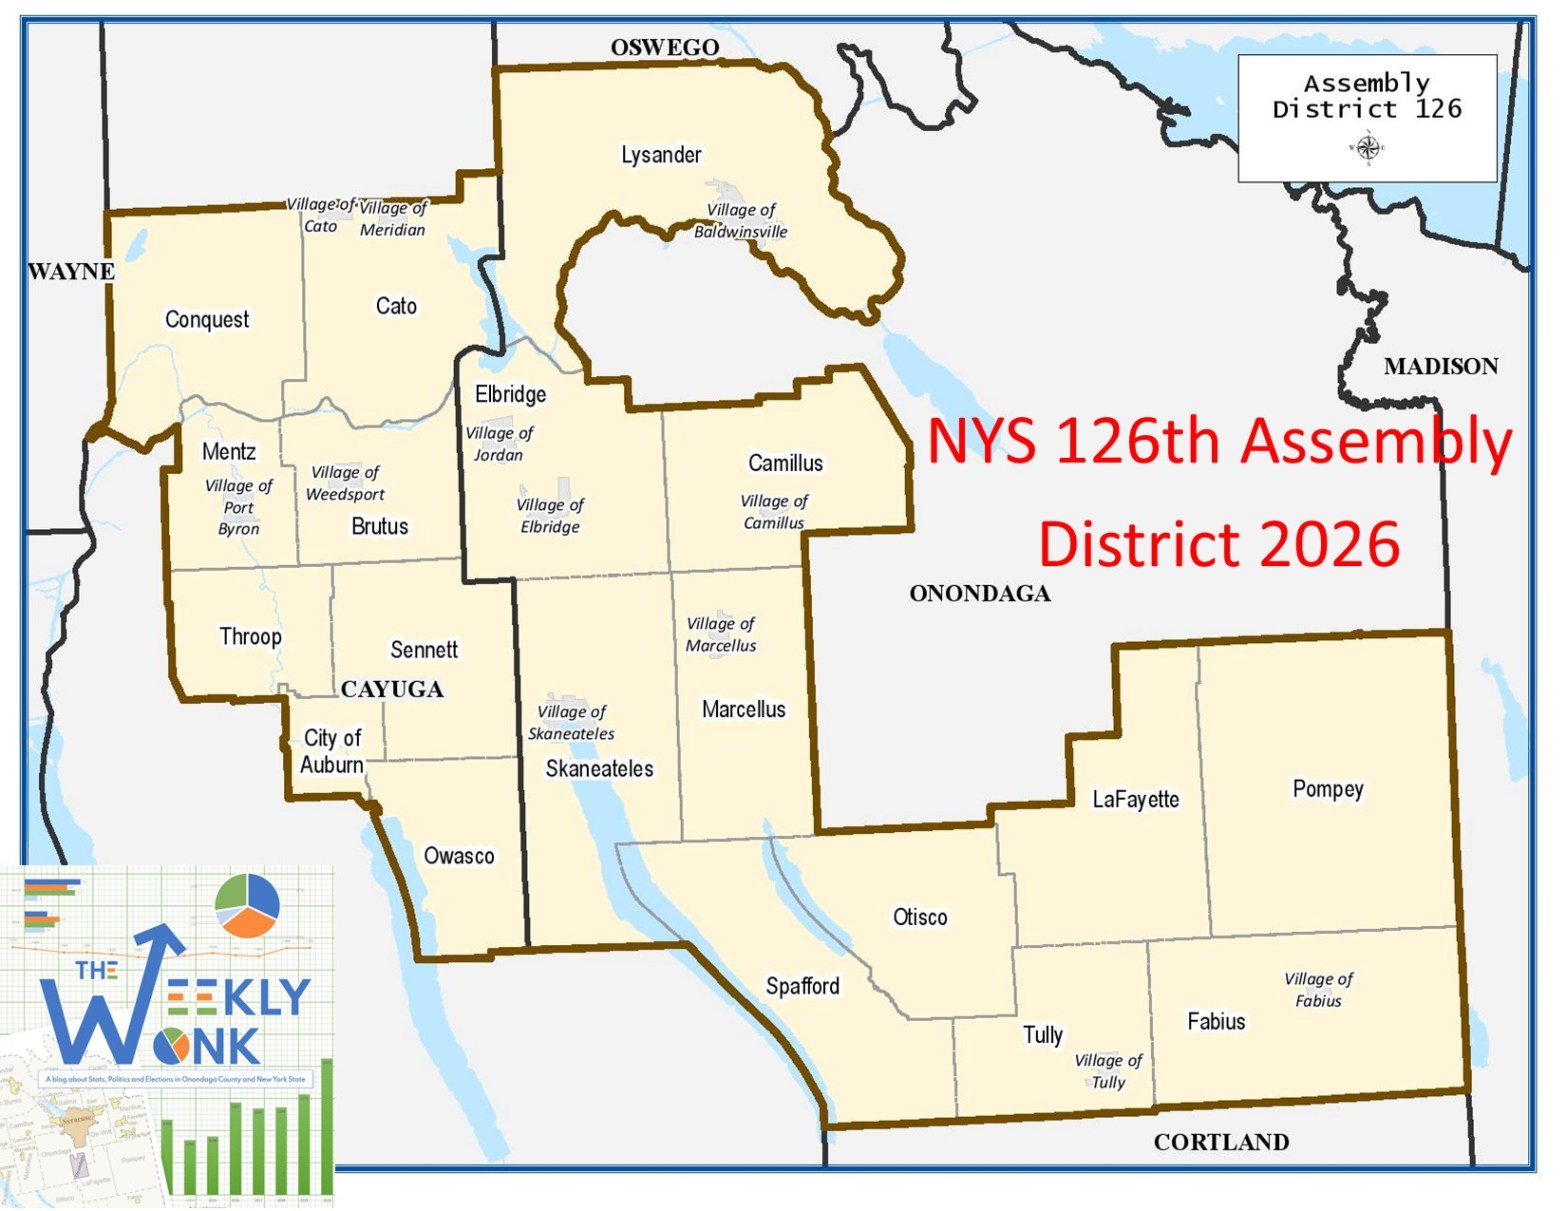
Welcome back to the #weeklywonk. This is my weekly article on dustinczarny.com on statistics and data. Each week I look at a political subdivision having a competitive election this fall and analyze the registration, electoral, and other pertinent data that encompasses it. This helps you understand the story behind election results in our home of Onondaga County. This week I start my look at the 4 Assembly districts that represent Onondaga County. NY Assembly district 126th represents the Western and southern towns of Onondaga County as well as the City of Auburn and the middle portion of Cayuga County. It is the only state district where a GOP representative holds office.
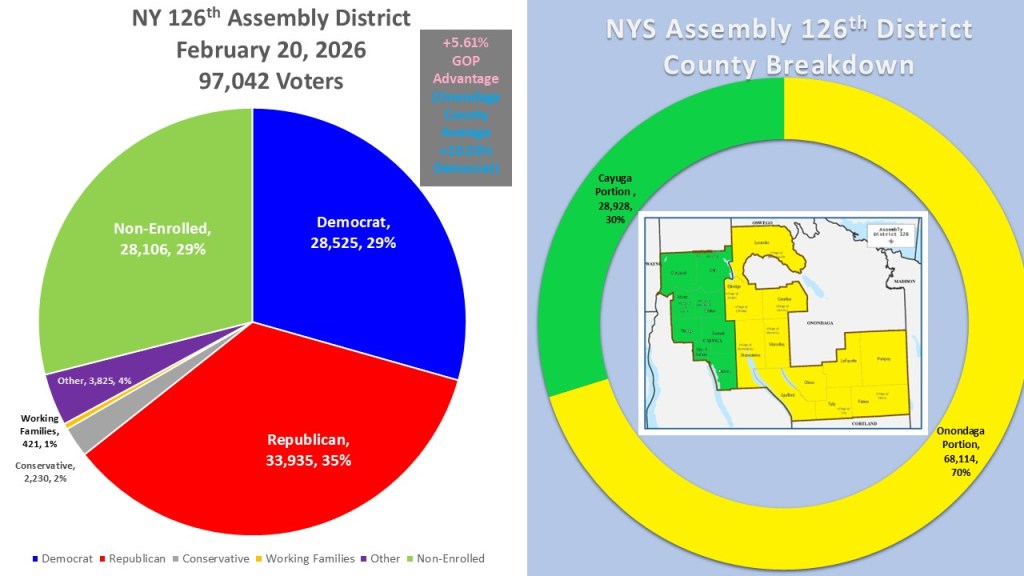
NY Assembly District 126th spans two counties, Onondaga and Cayuga, which means this week’s analysis once again relies on data from the New York State Board of Elections. Looking at the enrollment pulls of February 20, 2026, we see the district has 97,042 active voters. The plurality is in the GOP with 33,935 voters (35%). Democrats are second with 28,525 voters (29%) but not by much. Right on their heels are the non-enrolled with 28,106 voters (29%). Rounding out the registration is the other category (3,825, 4%), Conservative Party (2,230 2%), and Working Families (421, 1%). The Onondaga County portion is the lion share of not only land space but active voters with 70% (68,114) of the voters. The Cayuga County portion is just 30% (28,928) of the voters.
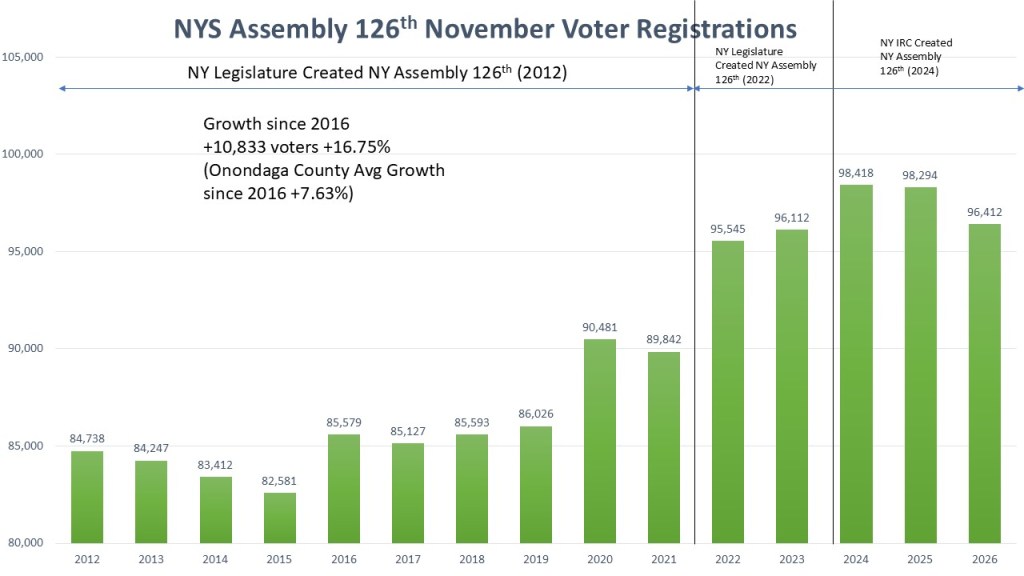
The story of redistricting for Assembly districts is a little different than the Senate and Congressional districts. Like the Congressional districts, Assembly members have run on three different maps of the last three cycles, but the Assembly district maps were never drawn by the NY Judiciary as they were never part of the lawsuit in 2022 thus the NY Legislature maps created in 2022 stood until a separate lawsuit required the NY IRC. Though in the case of AD 126 (and most Assembly Districts) there was no change in the 2022 and 2024 map. Still there was a massive change between the 2012 and 2022 map that grew the voter amount as Onondaga County became the biggest portion of the district. Since 2016, mostly because of redistricting, the Assembly district has grown by 10,833 voters, a growth rate of 16.75% far outpacing the growth rate we saw in Onondaga County during that period of 7.63%.
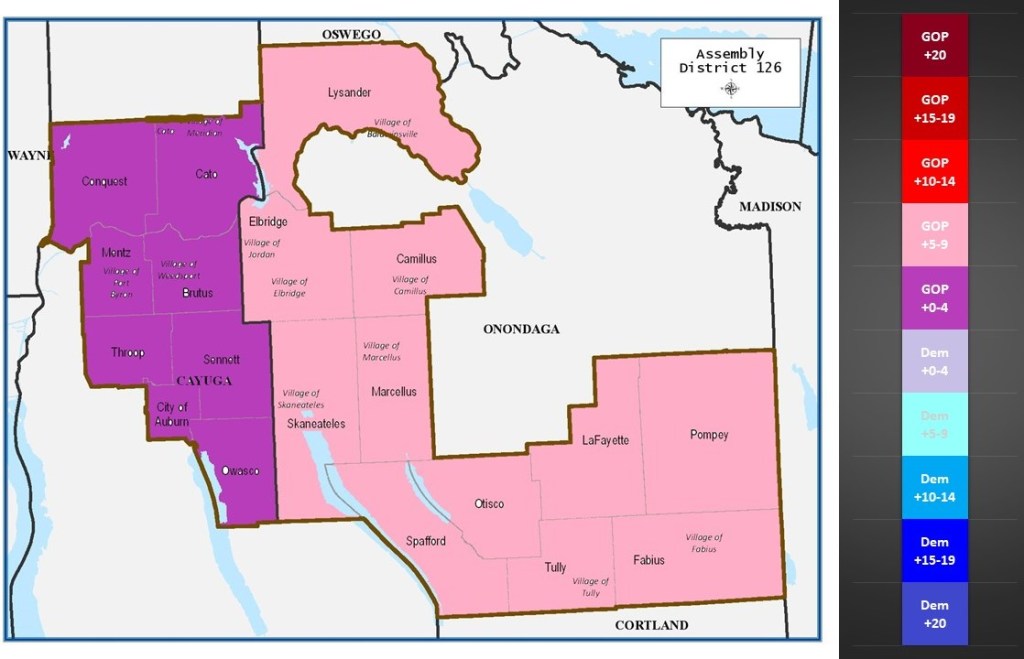
The 2022 redistricting radically reshaped AD 126. It used to span the southern towns of Cayuga, the southwestern towns of Onondaga and portions of Cortland and Chenango counties. The 2022 redraw excised the Cortland and Chenango portions, shifted the Cayuga County towns to the middle of the county (though keeping Auburn) and adding all the southern and west towns, including the populous town of Lysander and Van Buren in the Onondaga County portion. By registration, the Cayuga County portion of the district is the more Democratic portion residing in the borderline GOP +0-4% range on the heat map. The Onondaga County portion is in the lean GOP +5-9% on the heat map.
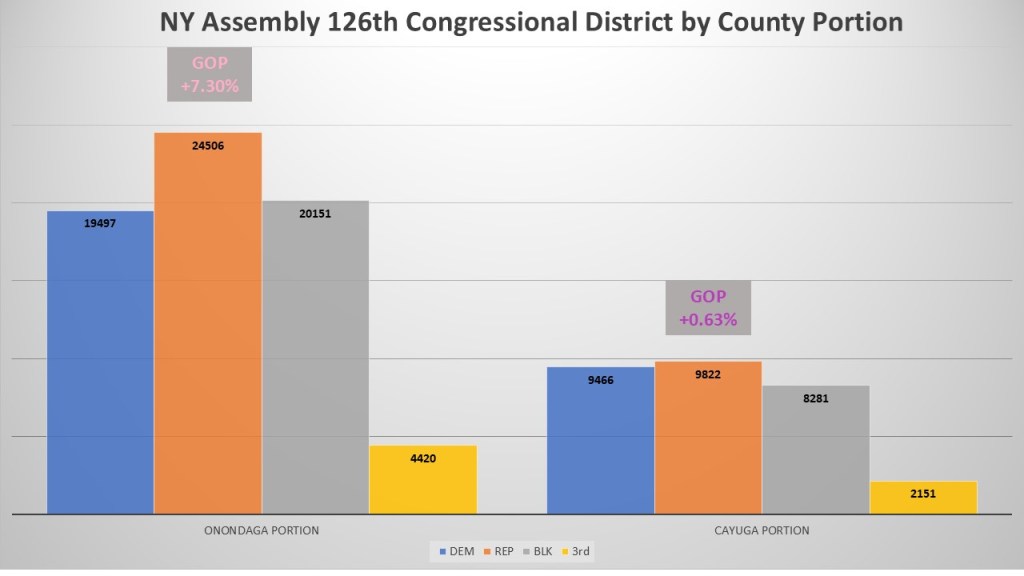
As we focus more on the two county portions of the district, we see it is not as straight forward as it may have looked on the heat map. The Onondaga County portion shows the GOP have a +7.30% with Republicans outnumbering Democrats by over 5k voters. However, we also see the non-enrolled are in second place also outnumbering Democrats. The Republicans in Cayuga County portion only outnumber the Democrats by less than four hundred voters and only enjoy a +0.63% advantage in the district. The non-enrolled here are solidly in third place. The non-enrolled, especially in Onondaga County, may explain a unique phenomenon in performance of the district we will examine at the end of this article.
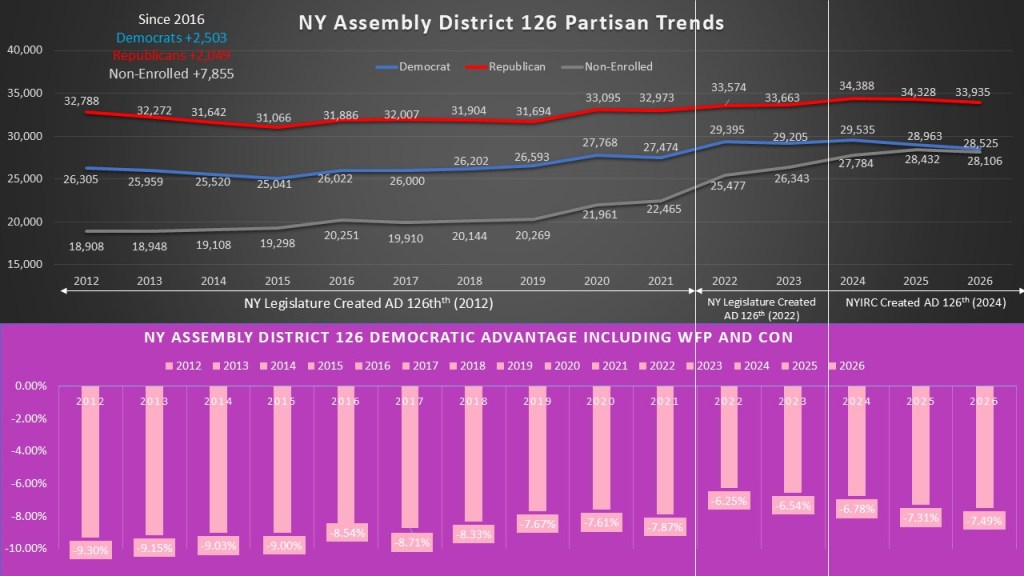
Looking at the district’s partisan trends, the major regional changes in 2022 had negligible effect on the balance between Democrats and Republicans. Since 2026, Democrats have gained 2,503 voters and Republicans have gained 2,049. Non-enrolled voters saw the largest increase, rising by 7,855 over that period. When Conservative and Working Families, voters grouped with their ideological counterparts, the district has become slightly less Republican leaning since 2012, shifting from a 9.30% right lean to 7.49% today. Even so, that trend has reversed since the GOP advantage reached its low point of 6.25% in 2022.
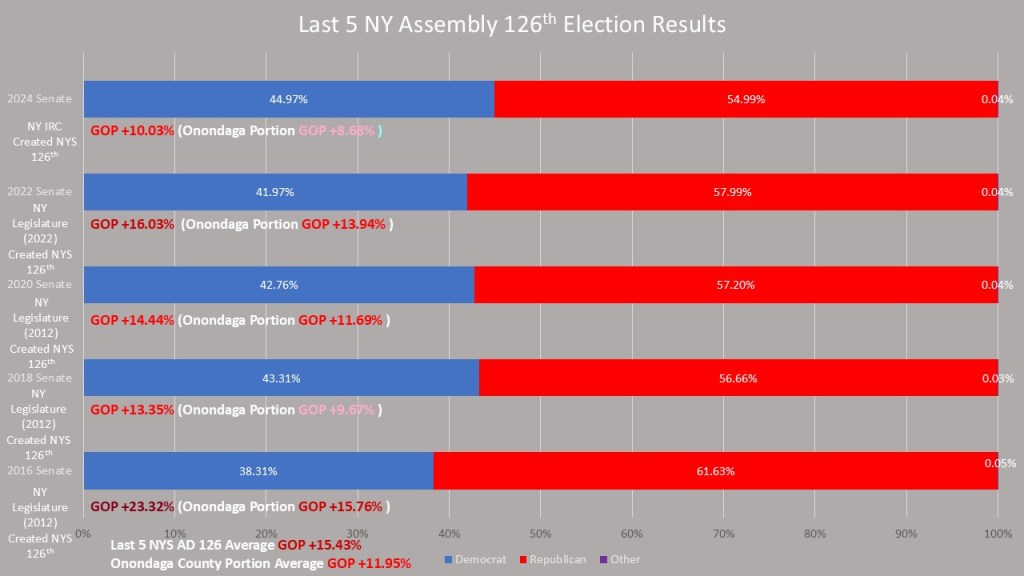
When we look at the last five e3lections in NY Assembly District 126, there is an interesting phenomenon happening. When we examined the Onondaga County portion of the district it appeared to be a more GOP friendly land than the Cayuga portion. However, performance wise over the last five cycles, including the last two that the current maps were in place, the Onondaga County portion of the district performed better for the Democrats (though still GOP leaning) than the overall results. This suggests that turnout in the city of auburn Democrats remains low and non-enrolled in Onondaga County tend to be more favorable to Democrats than their Cayuga County counterparts. Last cycle’s matchup, Ian Phillip’s was the closest of the last five races, but still a 10.03% loss which is more than the registration makeup of the district would suggest. Still, it was also the best performance by a Democrat in the Onondaga County portion and suggests that the key to winning this district is to do better in the Onondaga County portion despite its apparent registration disadvantage.
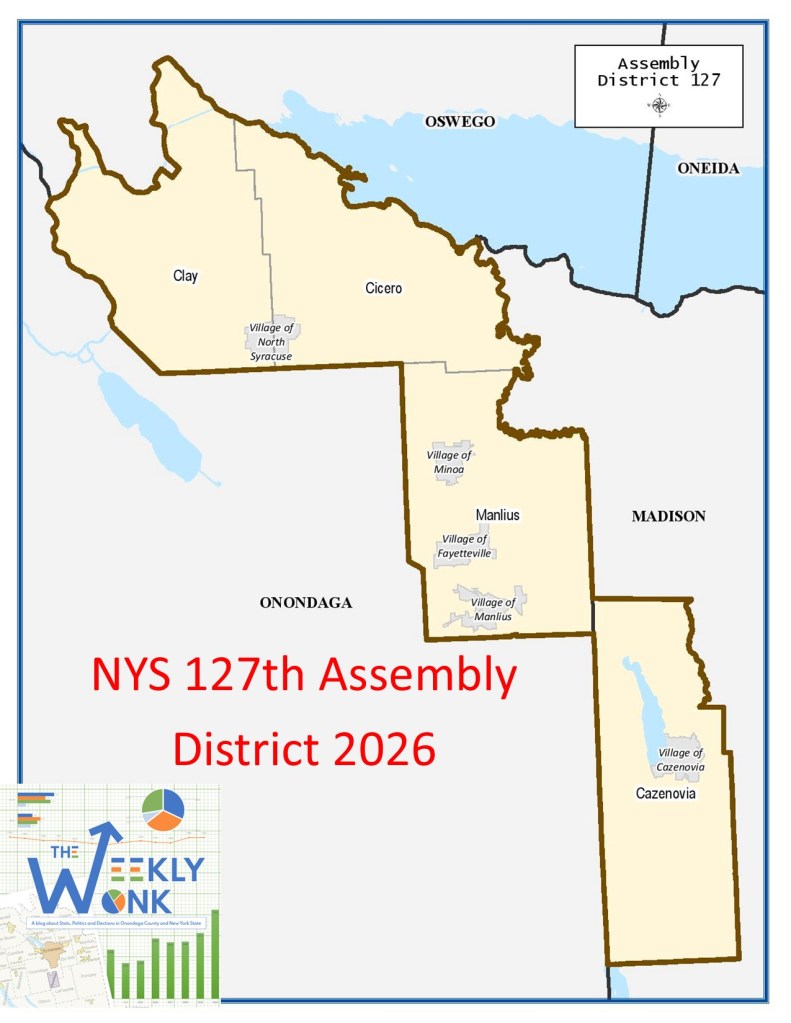
That is, it is for this week’s edition of the #weeklywonk. Next week I will continue my look at the county Assembly districts with AD 127 represented by Al Stirpe. It spans the Northeastern portion of our county and dips into Madison County. As always, you can subscribe to dustinczarny.com for all content and election news updates.
