
Welcome back to Wonky Wednesday. Each week I do a deep dive into the election and registration data that makes up the electoral landscape of our home, Onondaga County. I hope by looking into this data we can glean that this everchanging county is not monolithic as once thought and competition for Democrats, and all registrations, can be found everywhere. This week I investigate the June enrollment updates and look at overall trends since the last election.
Tri-annually the Onondaga County Board of Elections assembles enrollment figures for every political subdivision our county covers. We do these enrollment snapshots in mid-February right before determining signature requirements for the year, in June after the enrollment cut off for the June primary, and Mid October right before the General Election in November. I have been wondering whether the Democratic trend of Onondaga County would fall off since the November election and the ousting of Donald Trump. So today I will look at the trends of the County, Suburbs, and City of Syracuse and see if there is any change.
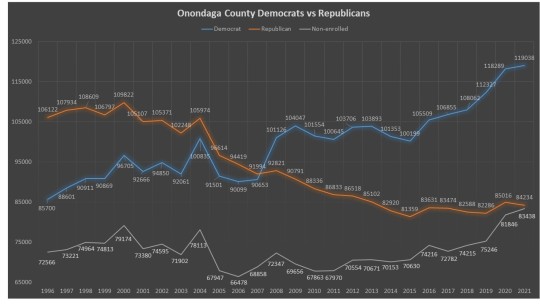
Onondaga County overall is continuing its Democratic trend since the November election. Since that election Democrats have gained 749 voters continuing its ascendant trajectory we have seen since 2015. Republicans on the other hand have lost 782 voters climbing down from the momentary bump they got in 2020 and what has been a mostly steady decline since 2004. It seems these parties continue to move in opposite directions at an almost equal pace. The bigger rise comes with the non-enrolled portion of the county. The voters who choose not enroll in any party grew by 1,592. In fact non-enrolled voters seem on pace to overtake GOP voters countywide.
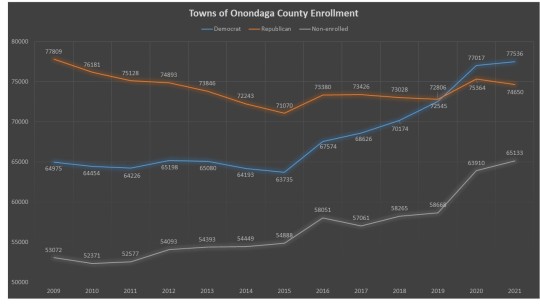
The Towns of Onondaga County are also continuing this trend. The towns make up about 76% of the County enrolled voter population. Since November Democrats have gained 519 voters which are less than 70% of its overall gain. The GOP has lost 714 voters, which is over 90% of its loss since November. Conversely the non-enrolled gained 1,223 voters which are 77% of its overall gain.
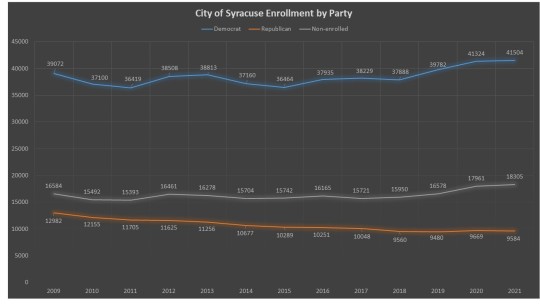
We see in the City of Syracuse a less pronounced trend. The City of Syracuse makes up just 24% of the enrolled voter population. Democrats gained 180 voters which are about 24% of its gain. Republicans only lost 85 voters which are less than 12% of its loss. Non-enrolled voters gained 344 voters which are about 22% of its gain. Democrats and Non-enrolled are growing at equal rates outside in the towns and in the city. Republicans on the other hand are having their most dramatic losses come outside the city, though their city enrollment remains at historic lows. Anecdotal evidence seems to indicate that younger voters tend to not-enroll in a party or enroll in the Democratic Party combined with the GOPS mostly older electorate and those switching out of the party are driving this trend.
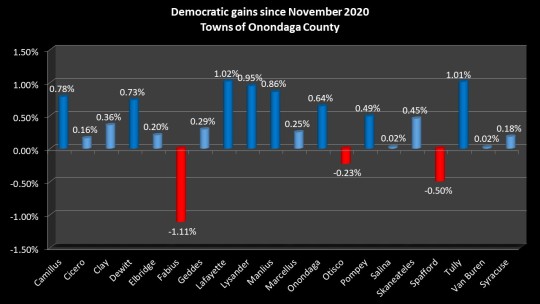
How is this trend playing out in the various towns of Onondaga County? For this comparison I partnered the GOP with the conservative party and the Democrats with the Working Families party. I then compared the Democratic share of the voter enrollment as a percentage of overall voter enrollments and then compared the change since November. Overall Onondaga County Democrats increased their share since November 2020 by .46%. Knowing that average we can see that the towns of Camillus (.78%), Dewitt (.73%. Lafayette (1.02%), Lysander (.95%), Manlius (.86%), Onondaga (.64%), & Tully (1.01%) are seeing above average progress toward Democratic enrollment. Cicero (.16%), Clay (.36%, Elbridge (.20%), Geddes (.29%), Marcellus (.25%), Van Buren (.02%) and Syracuse (.18%) are below average. Pompey (.49%) & Skaneateles (.45%) are seeing average progress. Only 3 towns Fabius, Otisco, & Spafford did the GOP show gains when compared to last year.
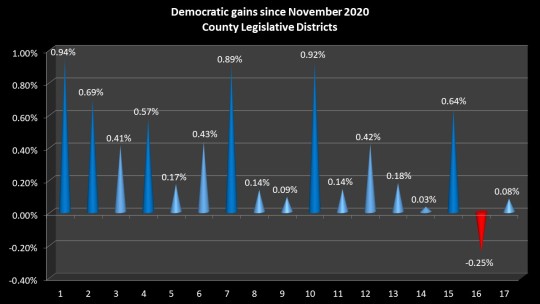
Soon I will be starting my series on the County Legislative seats but as you can see here nearly every seat besides OCL 16 has had progress towards the Democrats since 2020. The standouts OCL 1 (Lysander Area), OCL 2 (western Clay), OCL 4 (Galeville and Liverpool) OCL 7 Dewitt, N. Side of Syracuse, OCL 190 (Manlius), and OCL 15 (Valley to Geddes) has seen the strongest progression toward Democrats. Only OCL 16 (inner city) has seen a tilt towards the GOP.
It’s important to remember that Democratic progression does not mean overall enrollment advantage. Democrats enjoy Democratic pluralities in Camillus, Clay, Dewitt, Geddes Manlius, Onondaga, Salina and Syracuse as well as OCL 2,4,5,7,8,9,10,11,14,15,16, & 17. So while they may be growing in areas like Cicero, Lysander and Skaneateles the enrollment still heavily favors GOP. It will be very important for all Democratic candidates everywhere to court the growing non-enrolled voters to overcome the tendency for Democrats to vote at a lower rate in local elections. That being said we are getting toward a time where the vast majority of towns and county legislative districts can be seen as swing districts.
Starting next week we start looking at the 17 county legislative districts and the race to #Fliptheleg in Onondaga County. The candidates are known in these districts but the history may not be. I will dive into the creation of the districts and what they look like today.
