
Welcome back to #wonkywednesday. Each week I dive into a facet of electoral data for Onondaga County. My hope is by understanding these data points we can appreciate the many facets of election administration and voter participation. This week I am investigating Budget and staffing levels of Onondaga County in relation to the rest of New York State. Each year the New York State Board of Elections askes each of the fifty-seven counties and NYC Board of Elections to submit data based on our operations for the previous year and budget and staffing levels for coming years. In that data I have settled on four main points of comparison where we can measure Onondaga County resources devoted to Elections. Those four main categories are Annual Budget, Full time permanent staff, Inspectors Appointed, and finally Commissioner Compensation.
When comparing the Onondaga County Board of Elections to other counties you must account for the variety of sizes in New York. Onondaga County has 303,387 voters as of last November. This ranks the sixth most populous County in New York State outside of NYC. The range of counties varies widely with Hamilton County being the least populous (4,287 voters) to Suffolk County being the most (1,305,408). New York City encompasses five different counties (Bronx, Kings, New York, Queens, & Richmond) which operate the NYC Board of Elections jointly and serves 5,565,015 voters. New York State in total has 12,933,976 voters.

Using ratios to active registered voters is the best way to get a contrast on how Onondaga County is doing in relation to the other boards. Furthermore, smaller boards, under 100k, the ratios will be different as they have minimum amount of work that needs to be done regardless of size. For this comparison I am going to contrast the Onondaga County statistics to the entire New York State Average, to NYC, to Non-NYC Counties (57), and finally to counties (16) over 100k voters. This will give a broad sense of places where we are more efficient than others and other areas where Onondaga County voters are disadvantaged because of frugality.
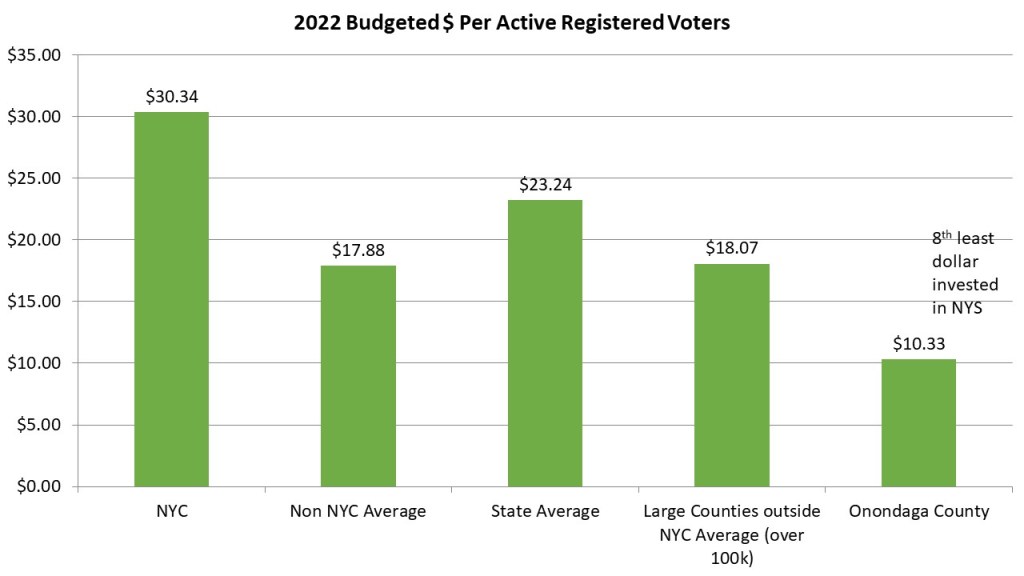
In 2022 the Onondaga County legislature approved a budget of $3,134,217.00 for 2022 year. Later in March the Onondaga County Comptroller will close the book on 2021 and we will do a #wonkywednesday where we compare the budget to previous years. Today we will look at the number of dollars spent per voter. NYC leads the state here spending $30.34 per voter in 2022. This makes sense as NYC has ranked choice voting and a variety of special elections it must run each year. Outside of NYC the fifty-seven counties only average $17.88 per voter which leaves a New York State Average of $23.24. The sixteen counties that have over 100k voters have budgeted $18.07 per voter. Onondaga County has only budgeted $10.33 per voter in 2022. This is the 8thleast investment budget in all of New York State using this metric. This is due both to efficiency by our board and frugality by the Onondaga County legislature.

The lack of permanent full-time staff is a long running criticism of the Onondaga County Board of Elections. In 2022 the County Legislature finally allowed a staffing increase, the first in over a decade, at the Board of Election. This still gets us the worst ranking of full-time employee to voter ratio in the state, despite the increase. What is surprisingly consistent across the state is what they believe a proper employee to voter ratio. NYC (7561.16), Non- NYC Counties (7,051.64) NY State Average (7,262.20) and counties over 100k (7,751.6) all have a consistent ratio on average. Onondaga County’s 1 full time employee for every 15,169.35 voters is not only the worst it is over double the average of the rest of the state.
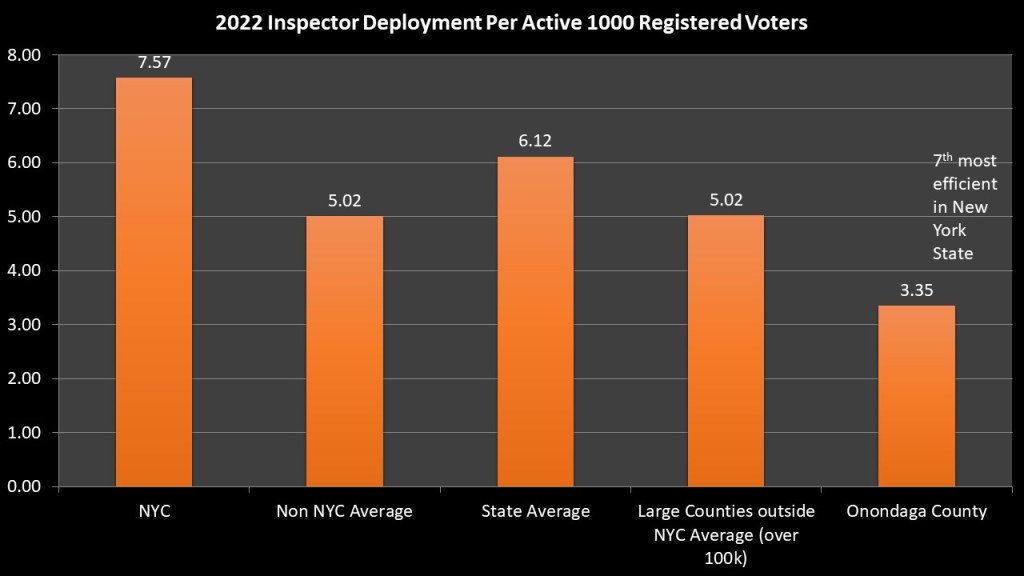
One place where Onondaga County is one of the most efficient in the state is the number of Election inspectors we appoint annually. In 2019 we invested in Electronic Poll Books and that revolutionized how we conduct elections in Onondaga County. Gone are the inefficient single table check ins for each Election District. Now singe check in stations combined with on-demand ballot printers in our most populous counties has allowed us to deploy less inspectors without any noticeable increase in voting lines. Onondaga County deploys 3.35 inspectors for every one thousand voters. New York City deploys 7.57, non-NYC counties 5.02, for a statewide average of 6.12. When compared to the counties over 100k they deploy 5.02. Onondaga County is the seventh most efficient county in all of New York State because of our reliance on technology.
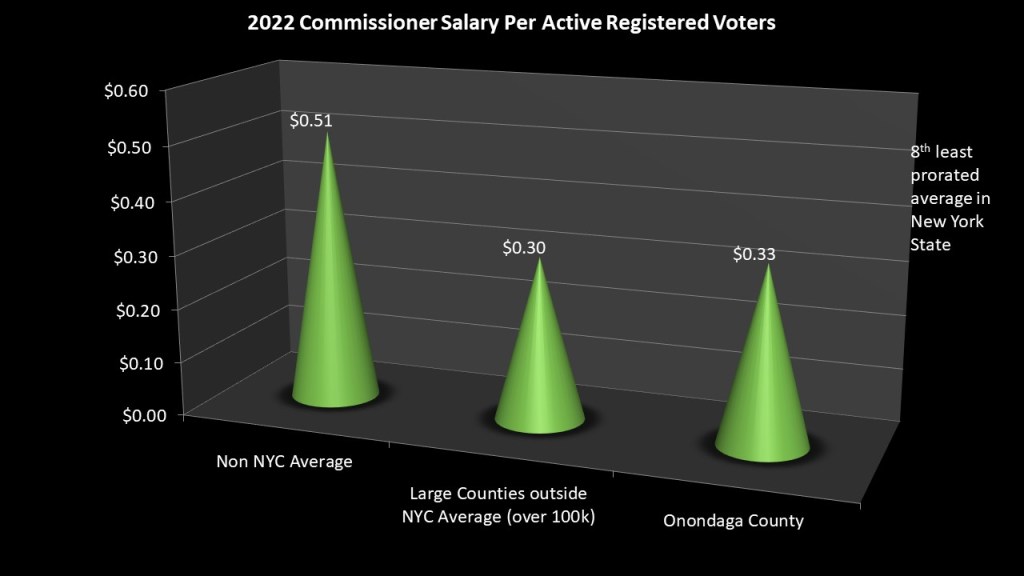
Finally, I address the question of Commissioner compensation. In 2020 the Onondaga County legislature attempted to arbitrarily cut the pay of the Elections Commissioners in a last second budget amendment. This was followed by a County Executive veto after tremendous public outcry. However, the County legislature was not done as it decided to reinstate the salaries but freeze our pay which resulted in costing the county thousands of dollars. We are one of the few employees or elected officials who do not get automatic salary increases each year. I decided to do this comparison because wild claims were made about our compensation despite running one of the more efficient boards in all of New York State. For this comparison we must leave out the NYC commissioners as they are not full-time commissioners, not even part time. They get paid small stipends to attend monthly meetings. This leaves the rest of New York State which averages a compensation of $.51 per voter. Smaller counties will tend to have a higher prorated salary since commissioners take on more duties in the office. However even when compared to other counties over 100k voters we are near the average of $.30 clocking in at $.33. That prorated average is the eighth least in New York State. The commissioners are well compensated, and I feel blessed to go to work every day, but the claims about being overpaid, especially considering the frugal comparative resources we are tasked to deal with, is factually inaccurate.
If you are interested in the underlying statistics for this article, check out the statistics page at onvote.net which is the home of the Onondaga County Board of Elections. You can specifically look at the NYS Budget Employee Comparisons linked here: http://www.ongov.net/elections/documents/NYSBudgetEmployeeComparisons.xlsx. Next week I will be taking a week off as I will be away at my bi-annual Elections Commissioner Conference in Albany. But check back in two weeks as I preview village elections in Manlius and Fayetteville.
Subscribe to dustinczarny.com for all content and election news updates
