
Welcome back to #WonkyWednesday. Each week I take a deep dive into the electoral and registration data that make up Onondaga County and New York State. Over the next few weeks I will be investigating the City of Syracuse. Usually I dedicate #wonkywednesday articles to races happening in the current year, however there are no races in Syracuse this year. I am continuing my run of Syracuse articles to highlight the Syracuse Independent Redistricting Commission will be holding 4 more public meetings over the next 6 weeks to develop their draft redistricting plan. This citizen led redistricting process depends on you to give input before they redistrict the five common council districts that make up our city. At the end of this article, I will post the next meeting times so you can attend. This week I am focusing on the least populous Common Council District, Common Council #2.
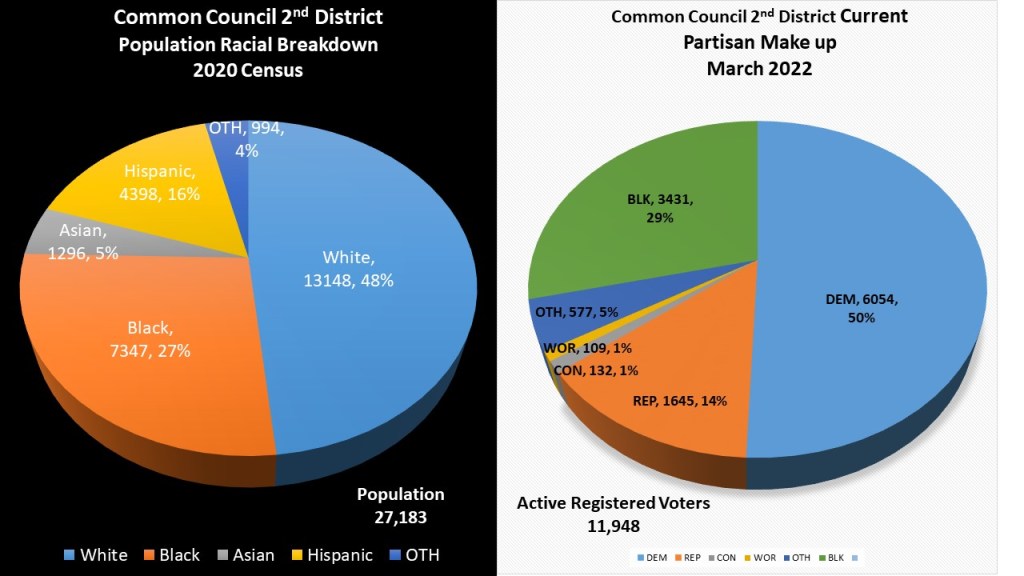
In the 2020 Census the 2nd Common Council district was reported to have 27,183 residents in the 2020 Census. In terms of population this is the lowest district of all 5 districts. The racial breakdown is 48% White, 27% Black, 16% Hispanic, 5% Asian, and 4% other. This makes the 2nd district the highest concentration of Hispanic population in the city. Partisan wise it is dominated by the Democratic Party with just over 50% of the enrolled voters, followed by 29% Blank (non-enrolled), and just 14% GOP. While Democrats dominate every district, this district is the 2nd least Democratic in terms of enrollment overall.

Democrats only recently broke the 50% mark in this district but like most areas of Syracuse, they continue to strengthen their advantage over the GOP. Since 2009 Democrats have gained 162 voters. This compares to the GOP losing 580 voters in the same time period. That is a loss of over 26% during that time period. The biggest beneficiary of the GOP decline though may again be the non-enrolled population. The Non-enrolled grew by 388 voters since 2009. That is an increase of 12.8%. Overall registration numbers have declined since the height of 2020 as people fall off the roles and don’t update addresses in the odd years. We should see an uptick in voter registrations by the end of this year.

The second Common Council district spans 7 different wards in the City of Syracuse. Ward 2, 7, 8, and 10 are wholly contained inside the 2nd Common Council District. About 2/3 of the 1st Ward, a tiny portion of the 3rd Ward, and 1/3 of the 11th ward makes up the rest of the district. Once again Democrats dominate every region of the district. In fact the GOP trails by wide margins the non-enrolled in each portion of the district. This district is genuinely seen as a Tipp Hill (Wards 7 & 8) district but registration and population wise it only makes up a smaller plurality of the district. That being said the other portions of the district don’t necessarily form as cohesive a voting bloc.

For our #wonkywednesday articles this year we will be using 5 races to compare how the subjects of our articles perform. We will be using the Presidential, State Senate, and Congressional races to see how our subject performs in a high turnout federal year. We will also use last year’s Supreme Court Race for a base on how the voters in the district react in a low turnout year. For the City of Syracuse, I am including last year’s mayoral race as well. The 2nd Common Council District is not only the second least Democratic district in terms of registration; it is also the 2nd least in terms of performance. The top 5 races all are still dominated by Democrats with the exception of Mayor Walsh, however only slightly better than the 1st Common Council district performed and trailing the rest of the city. Still in a high turnout year of 2020 Biden won this district with a margin of +42.57, the Democratic senators for NYS Senate won the district by +36.59, and Dana Balter despite losing her congressional seat still won this district by +24.01. In the low turnout year of 2021 Anthony Brindisi barely won Onondaga County overall, but dominated this district +33.49 in his unsuccessful run for Supreme Court. As the exception to the rule of Democratic dominance Mayor Walsh easily won this district by +30.56 getting a majority for his independent run for mayor despite opposition from the GOP and Democratic Party.

The City of Syracuse Independent redistricting Commission will meet 3 more times over the next six weeks to hear from the public on what they want from their new districts. They will be holding hearings at each of the city high schools. The first redistricting was held on Friday March 18th at ITC High School, and then a 2nd on March 26 PSLA at Fowler High School. You can watch the live stream from Fairmaps CNY here. The next three meetings will be April 7 at Henniger High School at 7pm, April 24th at Corcoran High School at 4pm, and April 28th at Nottingham High School at 7pm. You can give testimony about what you would like to see in your city for the next ten years.
