
Welcome back to #wonkywednesday. Each week I take a deep dive into the electoral and voter registration data that makes up our home here in Onondaga County and across New York State. It is that time of year where I start to focus on the races this fall and the registration data that makes them up. With statewide elections happening this year I decided to investigate New York State as a whole. Here is what I found looking at the Empire State.

It will surprise no one that New York is a blue state. Republicans have not won a statewide office since George Pataki ended his 12-year run as governor in 2006. Since then, not only has the GOP gone winless in State-wide elective office, often the race is not even close. Democrats have 5,929,375 enrolled members, making up just over a majority of all voters in the state. The Non-Enrolled are now second most populous group with 2,713,757 voters (23%), Republicans are now in third with just 2,645,799 (22%). Conservatives have 152,669 (1%) and Working Families Party has just 45,093 (0%). Though Conservatives and WFP make up the two other recognized parties there are still 419,193 voters enrolled in formerly recognized parties or other parties.
Regionally New York is generally considered to be broken up into three different distinct sections. New York City and the five counties that make up the City proper (Bronx, Kings, New York, Queens, Richmond) account for 4,611,360 voters (39%). The NYC Suburbs are generally considered the four counties directly bordering NYC. They consist of the two long Island counties of Nassau and Suffolk and the two counties that sit directly to the north Rockland and Westchester. Together they contain 2,808,825 voters (23%). The Non-NYC counties make up the Hudson valley, southern tier, western and central New York as well as Upstate New York. To avoid getting into the various debates about where each of these regions lie it is helpful to show them together as the non-NYC contingent. They make up 4,485,701 voters (38%).
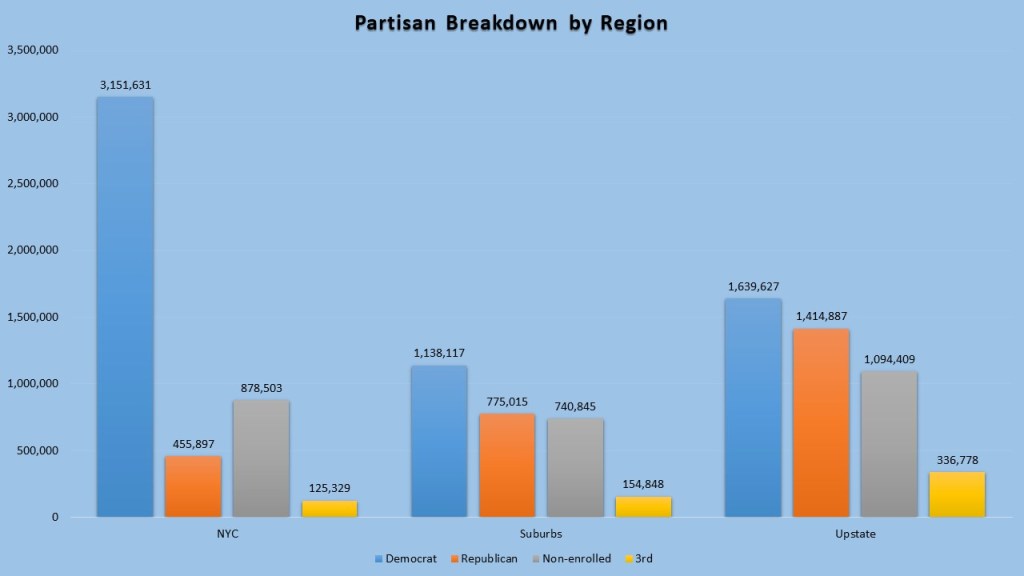
While each region varies in their partisanship, specially from county to county, the regions as a whole are generally Democratic. New York City NYC (3,151,631 Democrats (68.3%), 455,897 GOP (9.9%) and 878,503 & non-enrolled (19.1%) is overwhelming Democrat with the non-enrolled not just outnumbering but over double the GOP. In the Suburbs things get a little better for the GOP but Democrats still have a Plurality of voters (1,138,117 Democrats (40.5%), 775,015 GOP (27.6%), 740,845 non-enrolled (26.4%)). The Non-NYC rest of New York State the GOP fares the best but even their Democrats have a small plurality (1,639,627 Democrats (36.6%), 1,414,887 GOP (31.5%), 1,094,409 non-enrolled (24.4%)).
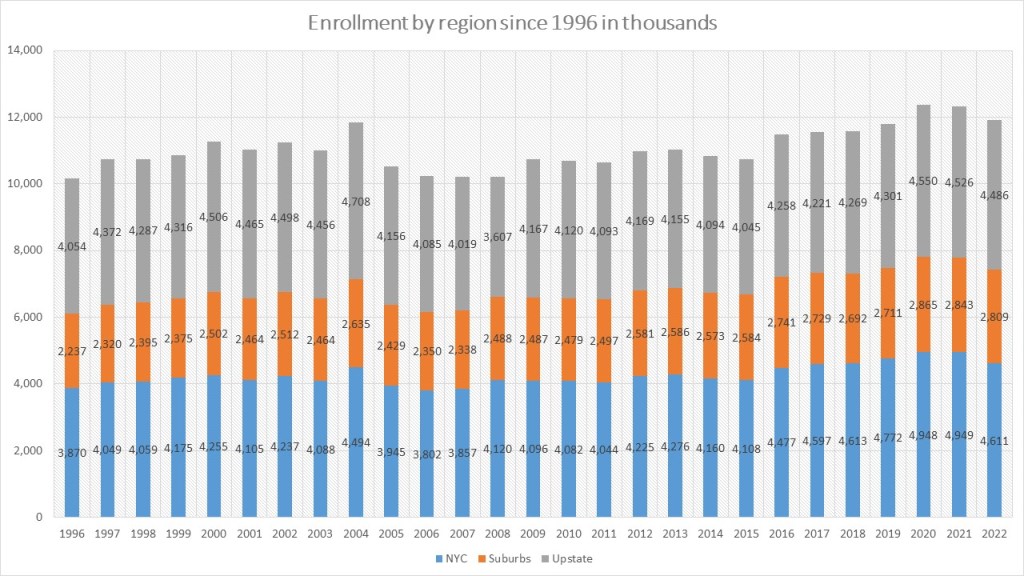
New York State Voter Enrollment has grown dramatically since 1996. In 1996 New York had 10,162,156 voters. That had grown in February of 2022 to 11,905,886, a growth of 17.2%. New York City has grown as well at a rate of 19.1% with the suburbs of NYC growing the fastest at 25.5%. Non-NYC counties saw a lagging growth rate of just 10.6%. This resulted in a shift in New York voting power downstate. The Non-NYC counties were more populous in 1996 accounting for 39.9% of the voters but fell to 37.7% of the voters. New York City grew its share of New York voters slightly from 38.0% to 38.7%. However, the NYC suburbs have seen the largest vote share gain growing from 22.0% to 23.5%.

Finally, since 1996 New York Democrats have had a steady but robust growth in its population. Democrats have added 1.2 million voters since 199. However, it is the non-enrolled that have added the most, growing their ranks by 1.6 million voters. The GOP has lost approximately 350k voters during that same time period. In 2020 the Non-enrolled finally caught up to and surpassed the GOP and that trend does not seem to be changing anytime soon.
The Demographics of New York State have been clear. It is not only a blue state, but also getting bluer with each passing year. The 2016 election of Trump has helped in that process, but New York GOP has seen a long steady decline since 2004. The primary for Governor is on June 28, 2022, and we will have a set of statewide candidates for each office. Democrats will be the overwhelming favorites for the fall elections and Republicans will be battling a long trend of losing political influence on a state-wide level.
