Early Voting runs October 26 to November 3rd. I go over all the times and places in Onondaga County where you can Early Vote. I also talk about the Early Voting Wait time tracker at onvote.net. Check it out.
I talk about the status of processing at the Onondaga County Board of Elections. We are on daily processing now! I also go over the big deadlines for Vote by Mail and Registering to vote for the November Presidential election. Enjoy.
Subscribe to dustinczarny.com for all content and election news updates
I was honored to join Central Current Radio hosts Maximilian Eyle and Dr. Rick Wright to discuss how this year’s election cycle is unfolding. We review legislative progress to make voting more accessible, deadlines for registration and mail-in ballot requests, the court order to redraw Onondaga County Legislature’s district maps, and more.
Today i talk about the October release of enrollment numbers that showed Onondaga County adding 6k active voters to our rolls and nearly 20 vote by mail going out in the last week. But more to go before November. Enjoy.
Subscribe to dustinczarny.com for all content and election news updates
“Up until July, it was pretty dead on the Democrat and Republican side, while the non-enrolled were pretty high,” Czarny said. “So the partisan enrollment have started to pick up. And of course the Democrat enrollment has really picked up since and we’ve seen a lot of people switching parties as well.”
YToday is my 52nd birthday. We got some pretty big news this week about the gerrymandered maps of the Onondaga County Legislature having to be redrawn. It was an early birthday present for sure. When I ran for commissioner in 2012 it was a direct response to the gerrymandered maps from 2011 and the lack of resistance to them.
But that fight is not over. Though Chris Ryan and the Onondaga County Legislature Democrats scored a great victory, they still need support. If the Onondaga County Legislature as a whole does not agree to fair and open process with bi partisan maps, the Democrats have vowed to fight on. That means money for experts and possibly another court case on new maps if warranted.
I ask that you consider another donation to the legal defense fund. We have some bills left over from the last lawsuit that needs to be paid as well as future costs coming from this next fight. our opponents spent over 200k in taxpayer money this last round, they will do that again for sure.
If you would consider donating $52 in honor of my birthday to this cause it would help out a great deal. You can donate here:
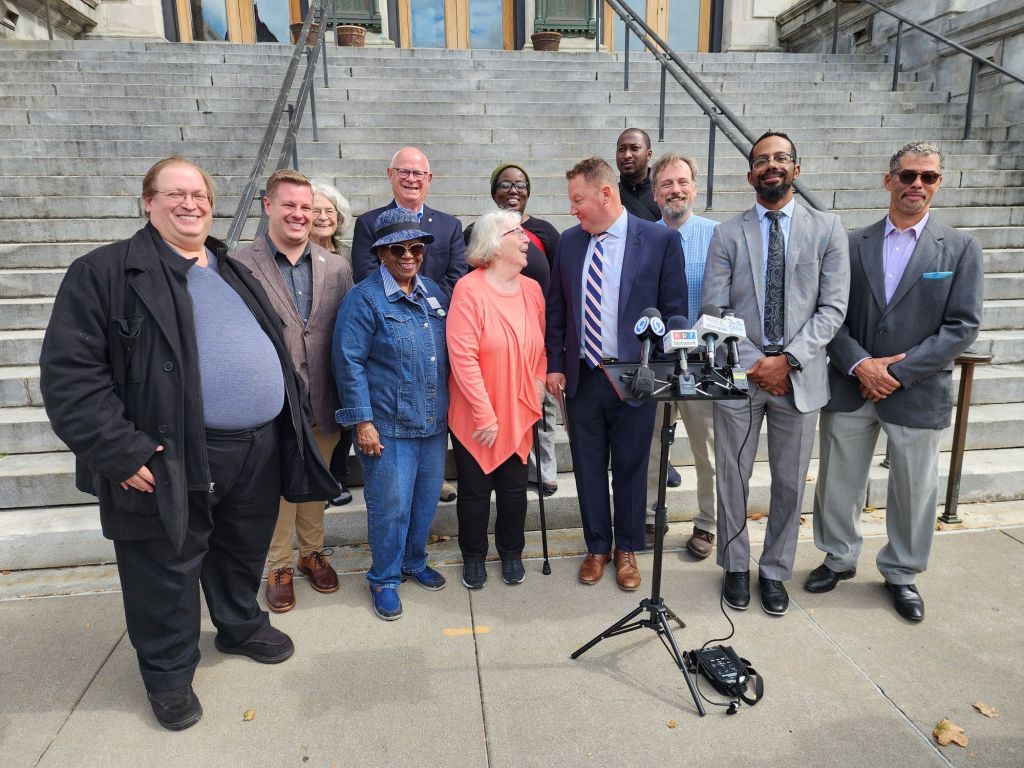
On September 24th Legislator Chris Ryan announced victory n the Onondaga County redistricting lawsuit. New maps are ordered for the 2025 elections. I was proud to work on this lawsuit and stand with my fellow democrats on it.
“It seems that this was a top-down decision that the county executive’s office was very involved in,’’ said Dustin Czarny, the county’s Democratic election commissioner.
This week I talk about the decision that will make the Onondaga County Legislature draw new maps for 2025. I go over the history of how we got here and what Democrats on the legislature hope will lead to fair maps in the future. Enjoy.
Subscribe to dustinczarny.com for all content and election news updates
On September 20, 2024 Commissioner Sardo and myself presented testimony to the Onondaga County Legislature Ways and Means Committee on the proposed 2025 County executive budget for Onondaga County. Above is the video portion of that presentation. Below is our formal written testimony.
Written Testimony for the Onondaga County Board of Elections
Budget Hearing September 20, 2024
Thank you to the Onondaga County Legislature for the opportunity to discuss our 2025 budget request. Representing the Board of Elections is Democratic Commissioner Dustin Czarny who has served in that role since 2013 and Republican Commissioner Michele Sardo who has served as Commissioner since 2017. The Onondaga County Board of Elections has 20 full time staff, including the two commissioners. We also have 25 seasonal machine custodians that serve during election periods. Onondaga County has over three hundred and eight thousand active registered voters. To serve those voters we currently have ten Early Voting sites, One Hundred and Forty-Six election day polling places and over one thousand inspectors bi-annually for the June primary and November general election. We also assist the villages who have March and June elections as well as the rural and suburban school districts, along with library and fire districts.
The 2025 County executive proposed budget for the Board of Elections has addressed many of our wishes for 2025. The budget includes an increase in pay rate for our part time mobile technicians from $25.00 to $25.75 an hour. This is the first pay raise for this position in over a decade and reflects pay increases that school districts and villages that run their own elections have instituted over the last several years. The County executive budget also institutes cleaning fees for our private polling sites. We are losing polling places each year, especially among private institutions who find the burden of hosting a polling place to outweigh the civic pride of doing so. This cleaning fee will retain more polling places.
Commissioner Salary Raises
In 2020, a change in the classification of the Commissioner’s title eliminated an annual salary increase. Other elected officials, department heads, and county employees have seen annual 3% raises during this period. In the last four years, we have seen some of the largest rates of inflation in our country’s history. The election commissioners are re-nominated this year, and it is appropriate to address the salary for the next two-year term. We are asking for a 5% raise to $104,971.65. This will bring the salaries more in line with similar sized counties: Monroe ($153,534), Orange ($96,342), Rockland (120,606), Albany ($108,593), and Dutchess ($121,058). It is important to note that the Commissioners get no overtime and have led the department through uncertain election times while maintaining a cost ratio of spending to voter registration of just $11.67 per voter which is the 5th lowest in all of NY State.
Additional Staff
The need for additional permanent staff for the Board of Elections is more crucial than ever. The OCBOE has 20 full time employees and over three hundred and eight thousand voters. That is one full time employee for every 13,959 voters. This is the highest ratio in New York State according to the annual report provided by the State Board of Elections. For comparison of similar sized counties, Monroe County (482,105) has a ratio of 1:9,642.10, Orange (241,849) has a ratio of 1:10,515, Rockland (204,078) has a ratio of 1:8,872, Albany (200,107) has a ratio of 1:8,700, Dutchess 198,801) has a ratio of 1:9,466.
The county executive budget rejected our proposal to add two additional Machine Custodians, and four additional Election Clerk II positions. The Custodians will help safeguard and program the Clear Ballot election system as well as the Knowink poll pads and poll print cabinets. We have nearly 1,200 pieces of election equipment (275 Clear Cast Scanners, 175 Clear Mark Units, 450 Knowink poll pads, 150 KnowInk poll print pads, 150 Knowink poll print cabinets) that needs to be tested and programmed before every election event. The two custodians who hold the positions are overwhelmed and need support to protect our capital investment.
The four additional Election Clerk II positions will not only help with the influx of registrations that we have seen over the last few years, but it will also help us with the influx of vote by mail applications that we have received and are expecting for years to come. Also, next year automatic voter registration will take effect and expected to increase use of online voter registration will continue to burden our staff.
The low staffing levels is causing stress as we must implement voluntary and mandatory overtime as we must have every voter registration processed before every election event. The additional six employees would bring Onondaga Staffing ratio to 1:11,808 which is at a higher ratio in comparison to similar sized counties but will address the immediate needs.
103 Clarification
The County Executive budget allocation in the 103 account is less than our projections for 2025. We estimate $1,072,328.50 in expenditures. This estimate is put together assuming a countywide June primary. It is reasonable to believe the primary in 2025 may only be a city wide primary, however we have no way of knowing that for sure. We won’t know the extent of the 2025 primary until the petition filing period in April of 2025. At that time, we will have a clear estimate of what areas primaries may occur in. We leave it up the Onondaga County legislature to determine the best course of action to accommodate this. The allocated 103 in the County executive budget could be enough to cover a city only primary and may not need adjusting at all.