I want to take a moment to welcome you to my website. This is my new home for my various election related projects that I have started over the last few years. As Onondaga County’s Democratic Elections Commissioner I am always looking for ways to further educate voters and navigate them through the arcane web of New York’s electoral system.
On my podcast page you can find my ongoing Commissioner in a Car series. A weekly Facebook live show dedicated to election news and deadlines. I also started a weekly interview series for candidates and Democracy advocates called Zoom with Czarny.
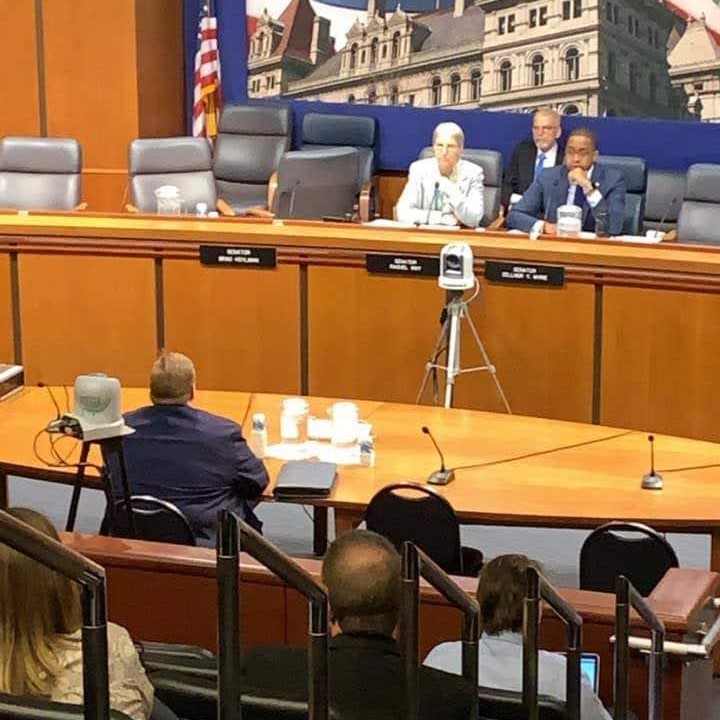
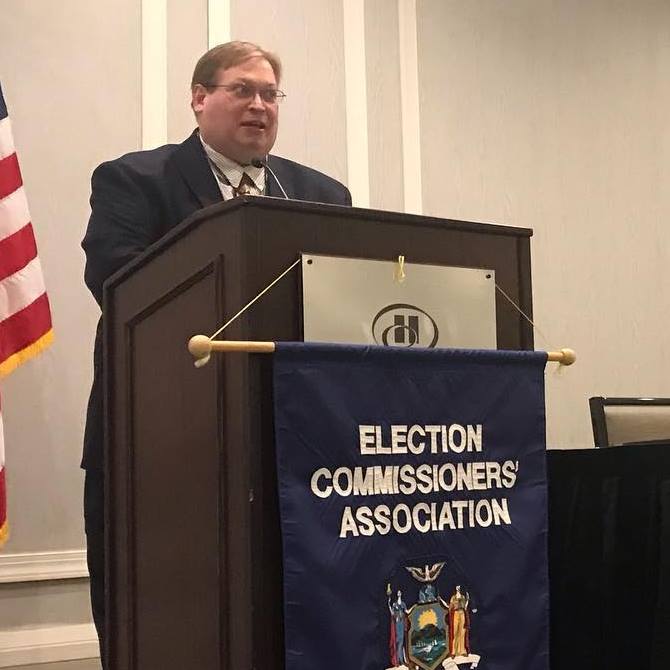
This will also serve as a home for my writings. On occasion I am blessed to testify in my role as Democratic Caucus Chair of the NYS Elections Commissioner Association. I have appeared in front of the NYS Legislature, Onondaga County Legislature, and Syracuse Common Council. I have collected my previous testimony here with video links when available.
I also have a weekly statistics blog called Wonky Wednesday. This column is dedicated to examining the election statistics and registration data in Onondaga County and throughout New York State. I also will from time to time author editorials and opinion articles on election related topics. You can find those writings on my editorial page.
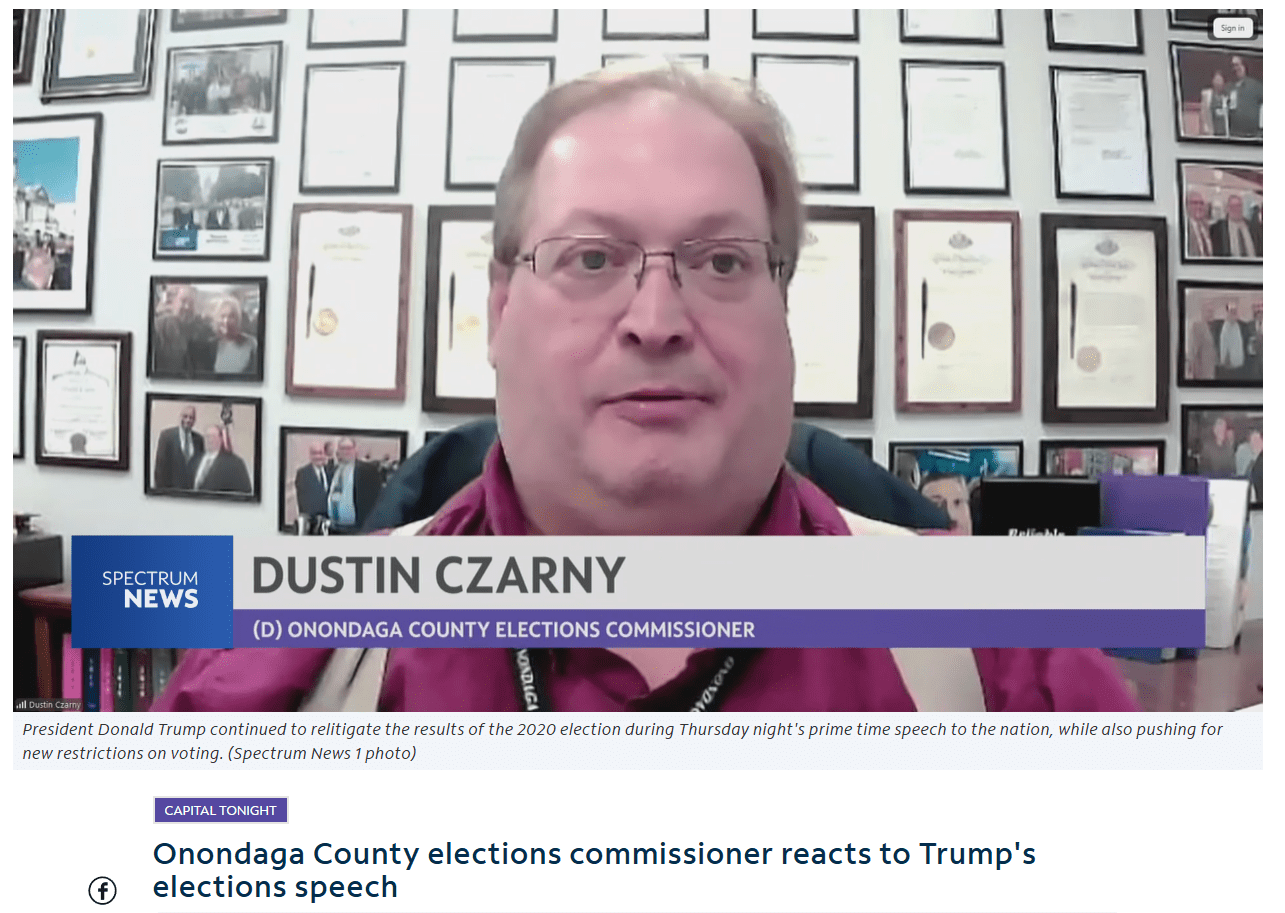
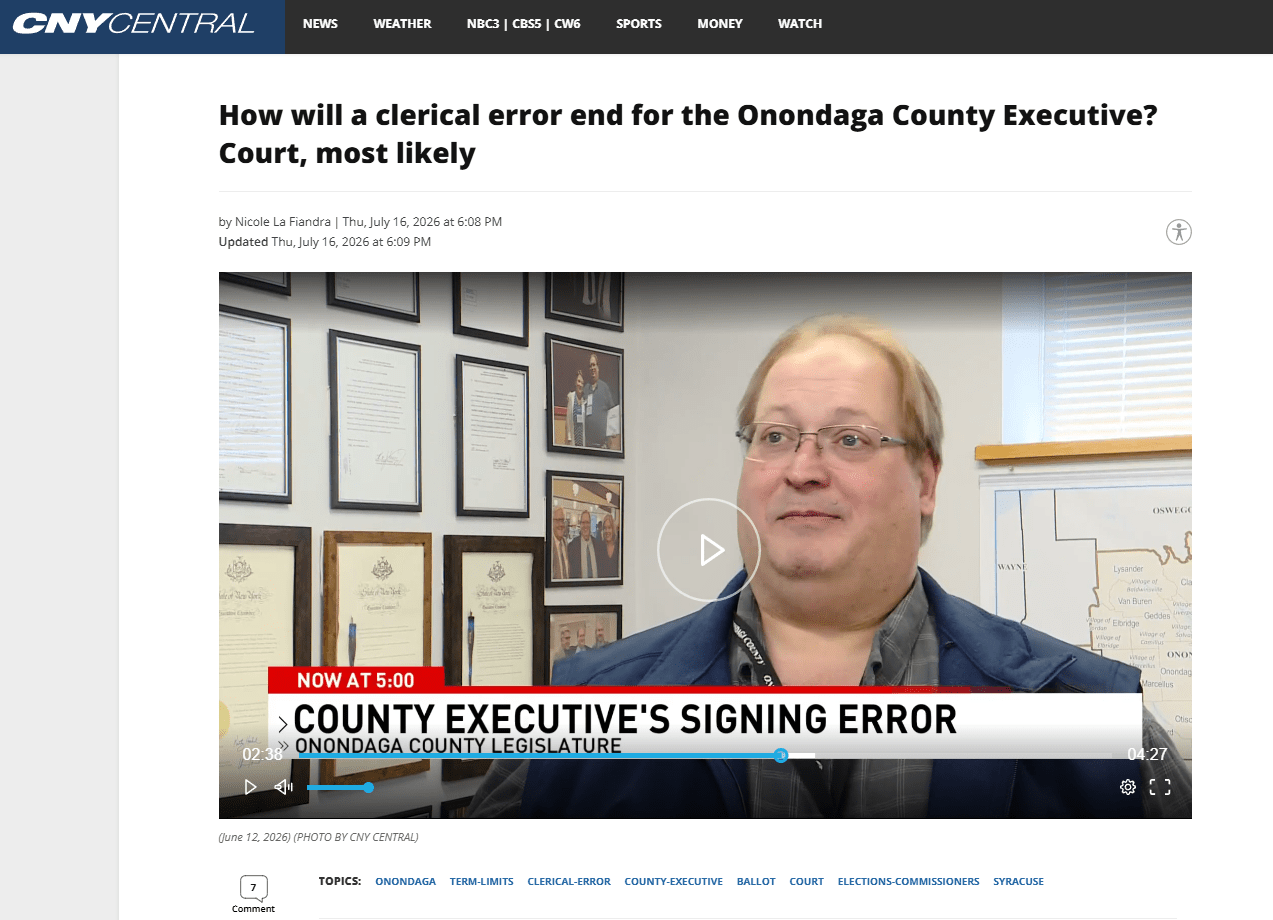
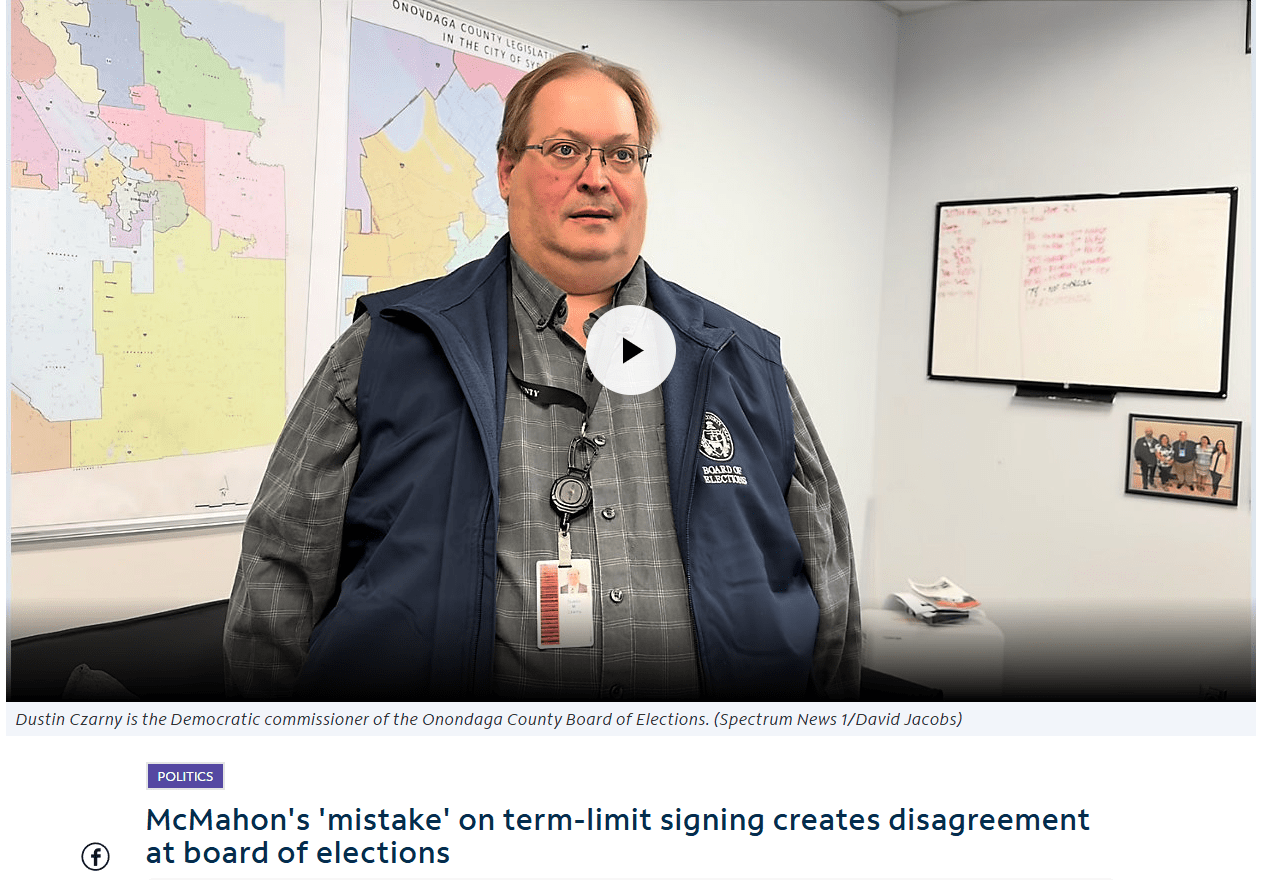
On occasion I appear on feature podcasts and tv shows. These longer programs offer me the ability to discuss complicated election issues on my featured page. Finally I regularly appear in local and statewide media on election related matters. I am compiling all current and past appearances on my interview page.
This website and all programming is entirely paid for by my personal funds. I do not accept donations or advertising. This is all part of my voter education and outreach efforts. If you are interested you can subscribe to my website and get updates when I post content. Thank you for visiting.
Welcome back to the #weeklywonk. This is my weekly article on dustinczarny.com on statistics and data. Each week I look at a political subdivision having a competitive election this fall and analyze the registration, electoral, and other pertinent data that encompasses it. This helps you understand the story behind election results in our home of Onondaga County. This week I start my look at the 4 Assembly districts that represent Onondaga County. NY Assembly district 126th represents the Western and southern towns of Onondaga County as well as the City of Auburn and the middle portion of Cayuga County. It is the only state district where a GOP representative holds office.
NY Assembly District 126th spans two counties, Onondaga and Cayuga, which means this week’s analysis once again relies on data from the New York State Board of Elections. Looking at the enrollment pulls of February 20, 2026, we see the district has 97,042 active voters. The plurality is in the GOP with 33,935 voters (35%). Democrats are second with 28,525 voters (29%) but not by much. Right on their heels are the non-enrolled with 28,106 voters (29%). Rounding out the registration is the other category (3,825, 4%), Conservative Party (2,230 2%), and Working Families (421, 1%). The Onondaga County portion is the lion share of not only land space but active voters with 70% (68,114) of the voters. The Cayuga County portion is just 30% (28,928) of the voters.
The story of redistricting for Assembly districts is a little different than the Senate and Congressional districts. Like the Congressional districts, Assembly members have run on three different maps of the last three cycles, but the Assembly district maps were never drawn by the NY Judiciary as they were never part of the lawsuit in 2022 thus the NY Legislature maps created in 2022 stood until a separate lawsuit required the NY IRC. Though in the case of AD 126 (and most Assembly Districts) there was no change in the 2022 and 2024 map. Still there was a massive change between the 2012 and 2022 map that grew the voter amount as Onondaga County became the biggest portion of the district. Since 2016, mostly because of redistricting, the Assembly district has grown by 10,833 voters, a growth rate of 16.75% far outpacing the growth rate we saw in Onondaga County during that period of 7.63%.
The 2022 redistricting radically reshaped AD 126. It used to span the southern towns of Cayuga, the southwestern towns of Onondaga and portions of Cortland and Chenango counties. The 2022 redraw excised the Cortland and Chenango portions, shifted the Cayuga County towns to the middle of the county (though keeping Auburn) and adding all the southern and west towns, including the populous town of Lysander and Van Buren in the Onondaga County portion. By registration, the Cayuga County portion of the district is the more Democratic portion residing in the borderline GOP +0-4% range on the heat map. The Onondaga County portion is in the lean GOP +5-9% on the heat map.
As we focus more on the two county portions of the district, we see it is not as straight forward as it may have looked on the heat map. The Onondaga County portion shows the GOP have a +7.30% with Republicans outnumbering Democrats by over 5k voters. However, we also see the non-enrolled are in second place also outnumbering Democrats. The Republicans in Cayuga County portion only outnumber the Democrats by less than four hundred voters and only enjoy a +0.63% advantage in the district. The non-enrolled here are solidly in third place. The non-enrolled, especially in Onondaga County, may explain a unique phenomenon in performance of the district we will examine at the end of this article.
Looking at the district’s partisan trends, the major regional changes in 2022 had negligible effect on the balance between Democrats and Republicans. Since 2026, Democrats have gained 2,503 voters and Republicans have gained 2,049. Non-enrolled voters saw the largest increase, rising by 7,855 over that period. When Conservative and Working Families, voters grouped with their ideological counterparts, the district has become slightly less Republican leaning since 2012, shifting from a 9.30% right lean to 7.49% today. Even so, that trend has reversed since the GOP advantage reached its low point of 6.25% in 2022.
When we look at the last five e3lections in NY Assembly District 126, there is an interesting phenomenon happening. When we examined the Onondaga County portion of the district it appeared to be a more GOP friendly land than the Cayuga portion. However, performance wise over the last five cycles, including the last two that the current maps were in place, the Onondaga County portion of the district performed better for the Democrats (though still GOP leaning) than the overall results. This suggests that turnout in the city of auburn Democrats remains low and non-enrolled in Onondaga County tend to be more favorable to Democrats than their Cayuga County counterparts. Last cycle’s matchup, Ian Phillip’s was the closest of the last five races, but still a 10.03% loss which is more than the registration makeup of the district would suggest. Still, it was also the best performance by a Democrat in the Onondaga County portion and suggests that the key to winning this district is to do better in the Onondaga County portion despite its apparent registration disadvantage.
That is, it is for this week’s edition of the #weeklywonk. Next week I will continue my look at the county Assembly districts with AD 127 represented by Al Stirpe. It spans the Northeastern portion of our county and dips into Madison County. As always, you can subscribe to dustinczarny.com for all content and election news updates.
On this week’s episode I talk about two major pieces of mail coming to voters across Onondaga County. The Annual Mail Check Card is already hitting doors. We also have ballots for the June primary going to all Democratic voters in Onondaga County and a few GOP voters in Pompey. Check it out.
Subscribe to dustinczarny.com for all content and election news updates
Welcome back to the #weeklywonk. This is my weekly article on dustinczarny.com on statistics and data. Each week I look at a political subdivision having a competitive election this fall and analyze the registration, electoral, and other pertinent data that encompasses it. This helps you understand the story behind election results in our home of Onondaga County. This week I look at the other Senate district, Senate district fifty encompassing the west, east, and northern suburbs as well as the southern part of Oswego County.
Senate District 50 spans two counties, so this week’s analysis relies on the New York State Board of Elections enrollment files dated February 20, 2026. On that date, the district had 219,485 active voters. Republicans made up the largest group with 71,726 voters (33%), followed by Democrats with 68,177 (31%) and non-enrolled voters with 65,829 (30%). The remaining voters included 8,410 in the “other” category (4%), 4,423 Conservatives (2%), and 920 Working Families Party members (<1%). Oswego and Onondaga counties are the major divides in SD 50. Although the Oswego County portion covers more geographic area, it contains just 56,901 voters, or 25% of the district total. The Onondaga County portion includes the northern towns of Clay and Cicero, the eastern towns of DeWitt and Manlius, and the western towns of Geddes and Camillus. Together, those towns account for 162,584 active voters, or 74% of the district.
The story of NY Senate District 50 revolves around the redistricting of 2022. The district used to be partially in Syracuse (though only a small chunk), then spread north and west into Cayuga County. The 2022 map, drawn by a special master appointed by the NY Supreme court, came about after the NY Appeals court deemed the legislature drawn map unconstitutional. Unlike the Congressional map, the special master map remains the map today. The NY Independent redistricting Commission never redrew them as they did the Assembly and Congressional maps. That is why you see such a large population change between 2021 and 2002, and why you will see stark differences in the partisan makeup later. It is now a more populous district than before, in fact it has gained 29,747 voters since 2016. That resulted in a +15.68% difference, over double the growth Onondaga County saw at the same time (+7.63%).
In the heat map we can really see the stark differences between the two halves of the district. The northern Oswego district is smaller, but decidedly more partisan. All together the district has one of the highest GOP ratings we have, in the strong GOP 15-19% dark red stage. The Onondaga County district has three times more voters than the Oswego portion but not as polarized. The suburbs lean Democrat but not as republican as Oswego County. This puts the Onondaga County portion in the borderline blue +0-4% Democrat range.
When we dive into the details of these two portions of the district we really see how opposite the two halves of the district are. The Onondaga County Portion Democrats outnumber the GOP by 4.76%. However, the non-enrolled outnumber the GOP. In the Oswego County portion, the GOP nearly double the number of Democrats and hold a +19.85% registration advantage. The non-enrolled here outnumber the Democrats as well.
In the partisan trends of SD 50 we can see how the redistricting of 2022 really changed the makeup of the district. As we can see the old, constituted SD 50 under the legislature drawn maps that started in 2012 the district protected Senator John DeFrancisco, a longtime republican representative (Even so much as drawing a small annexation of the City of Syracuse to just encompass his residence). However, as the suburbs grew more blue under the first trump administration, the district started to have not only more Democrats but a growing number of swing vote independents. We see that in 2021 the district was a high-water mark for Democrats in both vote gap and partisan. n. The Special Master map in 2021 altered the regional makeup drastically and “reset” the district back. its traditional republican leans. However, despite the drastic change their effect of the non-enrolled still dominates the district. Si. 2016 Democrats have added 7,116 enrolled voters, Republicans have added 8,697. The. n-enrolled has eclipsed them both together adding 15,849 voters.
We see the growing influence of independents and drastic redraw effect the last 5 Senate races. In 2016, John DeFranciso’s last runs he ran unopposed. Little known teacher John Mannion came remarkably close to beating Onondaga County Comptroller Rob Antonacci in 2018, coming to beat 1.91%. In 2020 John Mannion finally flipped this seat to the Democrats beating Angie Renna by 5.14%. In 2022 John Mannion won re-election but by one of the closest margins ever in a NY Senate race, by just ten votes after a sprawling hand count that lasted until middle of December. John Mannion left to run for Congress in 2024, and the sitting minority leader of the Onondaga County Legislature Chris Ryan beat Salina town Supervisor by a close 0.93%. Overall, the last 4 Senate races Democrats have averaged a 1.27% margin of victory while winning Onondaga County portion by 5.59%. The redraw in 2021 not only made the elections closer, but it also heightened the difference between the Onondaga County portion and the rest of the district. In 2018 and 2020 there was less than a 2% difference between the result and the Onondaga County portion. In 2022 and 2024 that difference grew to over 8%.
That is, it for this week’s Weekly Wonk. Next week we will move onto the Assembly races in Onondaga County. We will start with the only seat held by a republican, the 126th Assembly seat along the southern and western parts of county and stretching into Cayuga County. As always, you can follow along by subscribing to dustinczarny.com to get all content and election news updates.
I appeared on WAER’s CNY Decides program to comment on how the changes to USPS postmarking policy could affect the upcoming Primary and general Election. Enjoy.
This week’s episode I talk about where I have been the last month. I recap the petition process, the objection process and go over the primary ballot in June where Democrats all over Onondaga County have a primary to participate. I also go over my travel representing NY to the U.S. Election Assistance Commission and Project for Election Infrastructure. Enjoy.
Subscribe to dustinczarny.com for all content and election updates
For the bulk of the restored signatures in Laub’s case, Republican Commissioner Kevin Ryan and Democratic Commissioner Dustin Czarny overturned preliminary findings that invalidated entire pages of petitions. Laub brought affidavits that validated uninitialed corrections made to information about the person who collected the signatures.
“Congratulations, Mr. Laub, you’re on the ballot,” Czarny said at the end of the hearing, prompting a shout of joy from the candidate.
“Czarny noted that he supports the elections board staff for its preliminary determination because there was enough of a question to warrant a hearing and final determination by the commissioners themselves.”
I am attending the U.S. Election Assistance Commission this week as a representative of the Local Leadership Council. I had the opportunity to voice my opinion on the pending SCOTUS decision on mail in ballots received after election day. It was covered in Democracy Dockett.
In this week’s episode I talk about the end of the petition season. over 155 petitions and 160 candidates have filed to run in the primary and general elections. I talk about the process and what is next in the petition process. Enjoy.
Subscribe to dustinczarny.com for all content and election news updates.
Welcome back to the #weeklywonk. This is my weekly column on data and statistics that I publish on dustinczarny.com. Each week I dive in the registration and electoral data around a political subdivision or electoral event affecting Onondaga County. I am currently in the middle of my nine-part series of New York State offices running this year. This week I focused on the Syracuse based NY Senate district. The current names NYS #48 has had a tumultuous past 30 years filled with twists and turns, but the data has been there through it all.
This district has had more heel turns than a Martin Scorsese movie. Onondaga County has always had two Senate districts. Since 2010 there have been two districts, the Syracuse based district, and the suburban based district. The Syracuse based district has changed parties, but not by traditional means. Longtime Democratic Senator Nancy Lorraine Hoffman shortly after the 1998 election stunned Democrats by defecting to the Republican party. The district stayed in Republican hands until Dave Valesky’s beat Nancy Lorraine in 2004. The district stayed in Democratic hands until 2011 when Senator Valesky left the Democratic caucus, but not the party, to join the NY IDC which gave effective control of the Senate to the Republicans. Then in 2018 current Senator Rachel May primaried Dave Velesky and won ushering in the death of the DC and giving Democrats full control of the legislature and New York government for the first time since 2006.
The current makeup of NY 48th has 193,989 active registered voters as of February 20, 2026. 72,816 (37%) are Democrat and represent the plurality. In a telltale sign of a Democratic dominated district the non-enrolled are in second place with 55,811 (29%) voters. The Republicans are in third place with 53,777 (28%) voters. Rounding out the district are Other (6,708 3%), Conservative (3,633 2%) and Working families (1,244 1%). The district consists of three distinct sections. The City of Syracuse has 36% (69,986 voters) of the district. The south and west portions of Onondaga County make up the largest portion at 39% (75,539 voters). The entirety of Cayuga County is in the district and makes up just 25% (48,464 voters) of the district.
Like other districts in New York that we will examine, redistricting has played a significant role in shaping this district over the past decade. The district in Syracuse underwent significant changes because of the 2022 redistricting process. Under previous versions the district spread north and east from Syracuse into Oneida and Madison County. However, the so call NY “Independent” redistricting Commission flipped the Onondaga County Based districts, and the Syracuse based one went South and west through Onondaga County and have all of Cayuga County. Though perhaps the biggest change was the number of voters in the district. A new redistricting law mandated equal districts throughout New York State, ending the practice NY Republicans used to keep their shrinking majority bey having upstate districts have fewer voters in it. We see that in the big jump in population after redistricting. This is why the district has added 32,967 voters since 2016, a growth of 20.47% way larger than the Onondaga County average of +7.63%.
The three portions of the 48th district show one of the major dynamics of the district. We see the highly dense City of Syracuse with an overwhelming Democratic lean of over +20%. The rest of the district does lean GOP, but not overwhelmingly so. The remaining Onondaga County portion is in the GOP +5-9% category. The same with Cayuga County which is also in the GOP +5-9% category. While there are towns better than others and the City of Auburn slightly tilts blue on its own, the story of this district is clear. Can the City of Syracuse continue to exert dominance over the rest of the district?
The voter breakdown of the city and county portion also buttresses that story. Democrats dominate the City of Syracuse at +40357% but the non-enrolled are also more than double the GOP. The rest of the Onondaga County portion we see the Gop have a plurality at +5.84% and the non-enrolled slightly outnumber the Democrats. Cayuga County is in between the two, Republicans have a higher percentage advantage at +8.64% but Democrats, barely, outnumber the non-enrolled.
When we look at the partisan trends of the district, we really see the effect redistricting has on the district. Despite a big swing in geography, the district is near the same in makeup. But there are slight differences. Since 2016 Democrats have added 8,767 voters and Republicans have added 8,833 voters. This was mostly after redistricting in 2022. However, the non-enrolled is the big gainer, almost equaling both parties together at +16,661 voters. In fact, the non-enrolled, due to the influence of Syracuse, grew more than the GOP in 2024. When we add in the conservatives and Wp to see the ideological bend of the district, we see there was a drop after redistricting, and a small regression since 20224. However, that is because urban areas tend to fluctuate the most between Presidential elections. Still the non-enrolled are the key to this district now more than ever.
Finally, without the ability to get comparison races that span the entire district because of the radical redistricting in 2021 we are going to look at the last five elections. In 2016 Dave Valesky because of his connections to the IDC and NY GOP caucus had his third straight non-contested election. In 2018 Rachel May beat Dave Valesky in the primary but Valesky remained on the ballot because NY laws about third parties not allowing him to drop off. She easily won election by 14.31%. In 2020 Rachel May won re-election by 10.59%. The closest election was the year after redistricting. One of the worst years for Democrats and a brand-new district had Rachel May only win by 7.21%. Although she was already likely to win a tight race, a third-party conservative candidate also helped her secure victory. In 2024 though Rachel May bounced back with her biggest win at +16.90% after the newer part of her district got to know her during the last ter. It is the Onondaga County portion of the district that consistently votes for May. Rachel May has won her last four elections by +12.25%, but won the Onondaga County portion of the district, including Syracuse by an average of +22.24%.
That is, it is for this week’s edition of the #weeklywonk. Next week I set my sites on the other Senate District in Onondaga County, the suburban based NY Senate District 50. This district fell into Democratic hands in 2020 after generations in Gop hands. We will look at the data as Senator Chris Ryan runs for re-election this year. As always, you can subscribe to Dustinczarny.com to get content and election news updates.