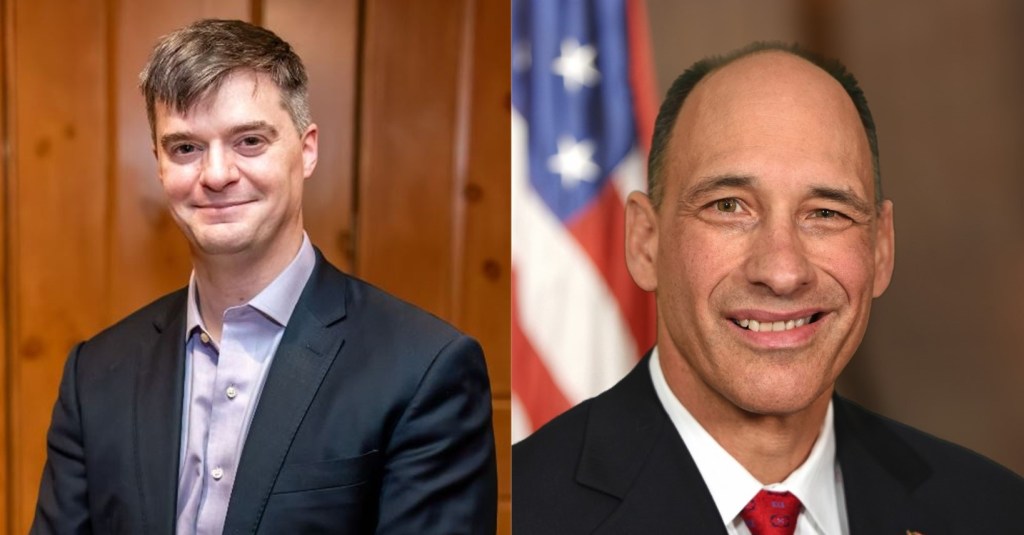
This week I sit down with Tom Speaker of Re-invent Albany. This good government group is focused on transparency in Albany as well as campaign finance and election administration. As legislative director we talk about Tom’s work to move Albany into the light. Enjoy.
Subscribe to dustinczarny.com for all content and election news updates
In a special Monday edition I talk about the annual school district elections happening tomorrow. Every school district will be running an election on Tuesday May 21, 2024, except the City of Syracuse which holds them in odd years in November. BOEs don’t run the elections for school districts so contact the school districts for further information. Enjoy.
Subscribe to dustinczarny.com for all content and election news updates
The new district lines were then projected to add 30,000 registered Democrats to the district, giving the party a nearly “20,000 voter edge,” according to preliminary calculations by Onondaga County Board of Elections Commissioner Dustin Czarny.
Welcome back to the #weeklywonk. In this space I try to shed light on the forces that make up the body politic in New York and Onondaga County. Each week I will look at electoral and registration data that make up a political subdivision or an election event. I continue my look at political subdivisions that will make up the General Election 2024. This week I investigate the most competitive race over the last few elections, NY Senate district forty-eight.
NY Senate district 48 is a decidedly Democratic Senate district. Democrats make up 75,150 voters or 39% of the 193,209 active registered voters of the district. This represents the largest plurality. The GOP makes up just 53,150 voters {27%). The non enrolled are a close third with 51,248 voters (26%). Democrats have a +11.36% advantage. The district itself spans two different counties, but really 4 different distinct regions. The Western and southern portions of Onondaga County are the largest plurality in the district with 38% (74,210) of the active voters. The City of Syracuse is just behind with 37% (71,490) voters. That means Onondaga County makes up 75% of the active voters of the district. The whole of Cayuga county makes up the remaining portion. This county is broken into the city of Auburn at 8% (14,769) and the rest of Cayuga County at 17 % (32,240) of the active registered voters.
The Senate districts in Central New York were radically redrawn under the special master maps of 2022. The old district represented by NY Senator Rachel May spanned east into Madison and Oneida county under the old district name of #SD53. This district was trending Democratic but undersized as it was represented by Senator Dave Valesky of the IDC and treated favorably in the GOP Senate who controlled Senate redistricting. Senator May won a primary in 2018 and the seat as the #SD53 became more and more Democratic and the notion of the IDC giving the GOP Senate control became untenable. The Special Master map in 2022 gave all the City of Syracuse to the newly numbered #SD48. But moved it westward in Cayuga County. Since 2022 the district has remained basically stagnate with Democrats losing 907 voters, the GOP losing 305 voters, and the non-enrolled gaining 635 voters. With two urban cores in the district like Auburn and Syracuse registrations are bound to grow drastically in a Presidential year as cities tend to lose registration between Presidential cycles and gain in the closing months of the campaign.
The four different regions of #SD48 are politically very different. The City of Syracuse is the most polarize region as Democrats have a +42.20% registration advantage and the non-enrolled dwarf the GOP. The City of Auburn is the second-best region for Democrats with a +13.66% advantage, though the GOP remain in solid second place there. The southern and western portions of Onondaga County have a slight GOP advantage with +6.60 registration advantage for Republicans. Though the Democrats and Non-enrolled are almost tied in this portion for 2nd place. The non-Auburn portion of Cayuga County is the most GOP friendly of the district with the GOP having a +15.91% registration advantage. Though even in this portion of the district Democrats are in a solid second place above the non-enrolled.
As far as performance of the district we can only look at three races to see how the district will perform. Thanks to NY Redistricting and You we can see how this district would have performed in 2020 for the Presidential race and Joe Biden won the district by +18.20%. In 2022 Governor Hochul despite facing issues in upstate New York was also able to win this district, though only by +3.30%. Rachel May was able to win this district in her 2022 re-election by +7.53% though she was helped by a conservative party splitter. In fact, all three of her elections there have been a third-party splitter. In 2018 Dave Valesky remained on the ballot on the independence line but she still won by 13.77% and in 2020 a libertarian candidate was on the ballot, and she won by 10.09%. Despite having third party entrants in each race Senator May won her vote between 49 and 52% of the vote making it unlikely the third-party entrants made a deciding difference in the race.
Last year I introduced heat maps as a way of showing the complex makeup of the political subdivisions that will have races this year. #SD48 has some of the highest variety of political polarization of any district we will see this year. The dark blue (DEM +20%) of the City of Syracuse shows the Democratic domination there. That is followed by the solid blue (DEM +10-14%) domination Democrats have in the City of Auburn. Outside of those subdivisions we see only a few borderline towns represented by the light purple (DEM 0-4%) where Democrats have a token advantage and Dark purple (GOP 0-4%) where the GOP have the token advantage. The rest of the towns have a variety of Republicans advantage from the pink (GOP +5-9) with slight advantage, red (GOP +10-14%) where the Republicans have solid advantage, burgundy (GOP +15-19%) where the Republicans have a significant advantage and dark red (GOP +20%) where the Republicans have dominance.
Despite the geographic dominance for the GOP, the plurality of voters resides in the Democratic towns of Syracuse and Auburn with 86,259 voters or 44.5%. The 31 GOP towns band together to have 77,486 voters or 40.0%. The 4 borderline towns of Onondaga, Van Buren, Owasco and Ledyard have 29,964 voters or just 15.5%.
There will be a GOP primary for #SD48 in June. Republicans Caleb Slater and Fanny Villareal. Senator Rachel May will be on the Democratic and Working Families line. The conservative party endorsed Caleb Slater but in a paperwork error he will not appear on the Conservative line. Unless someone files independent nominating paperwork at the end of May that means for the first time there will be a head-to-head contest this fall with Rachel May and the winner of the GOP primary.
That is, it for this week’s edition of the #WeeklyWonk. Next week I will look at the Town of Lysander which is having a GOP primary this fall for the vacant Town Board race. This town has a vacancy this year because of a Democratic win last year and in a Presidential year and a GOP primary this is a possible pickup for Democrats in 2024. As always you can find it on dustinczarny.com where you can subscribe for email notifications for content and election news updates.
This week I sit down with Ben Weinberg of Citizens Union. We talk about the move to have elections for many offices on even years. A recently introduced amendment will move cities and judges around 2030. We will talk about the implications and next steps.
Subscribe to dustinczarny.com for all content and election news updates
In this week’s Commission in the car I talk about the new pieces of litigation that dropped over last week regarding absentee ballots and the legislation I am hoping Albany will pass before the end of session I also talk about absentees being sent out for the June primary. Enjoy.
Subscribe to dustinczarny.com for all content and election news updates
Welcome back to the #weeklywonk. In this space I try to shed light on the forces that make up the body politic in New York and Onondaga County. Each week I will look at electoral and registration data that make up a political subdivision or an election event. I continue my look at political subdivisions that will make up the General Election 2024. This week I investigate the most competitive race over the last few elections, NY Senate district fifty.
The NY senate district, drawn by the special master in 2022, is about as even a district as you can find on paper. There are 68,764 Democrats (32%), 70,921 GOP (33%), 62,226 non-enrolled (28%), 10,166 Other (5%), 4,327 Conservatives (2%), and 837 Working Families (<1%). There are two counties in the #SD50. The Onondaga County portion spans from the northeast including Dewitt, Manlius, Cicero and walking westward including Salina, Clay, Geddes, and Camillus. Onondaga County makes up 74% (160,076 voters) of the active registered voters of the district. The Oswego portion is the southern part of the county with the cities of Fulton and Oswego in it with a host of rural towns. The Oswego County portion makes up 26% (57,165) of the district.
Unlike the congressional districts and assembly districts, the Senate districts in New York have not changed since the Special Master ruling in 2022. The NY Senate districts that the Special Master drew were never re-challenged and for 2024 at least will remain the same as 2022. There was quite a wild switch in this district under the Special Master as before. Instead of a district that had part of the City of Syracuse and spanned west into Cayuga County, the special master map moved the district north for the first time into Oswego and out of the City of Syracuse all together. We can see the effect of the registration on the district in our registration graph. Before 2022 the district had been trending Democrat with democrats taking the plurality in 2018 and growing each year. After 2022 we see a large influx of Republicans into the district and stagnation of Democrats. The major parties in the district have stayed basically the same over the last few years. Democrats have lost 686 voters since 2022, The Gop have lost 387 voters. The substantial change and x-factor in the district remains the non-enrolled voters who are growing at a rapid rate. There are 2351 more non-enrolled voters in the district now than 2022, and that growth seems to be accelerating.
The two individual county portion’s partisan rankings could not be more different. Onondaga County makes up not only the most populous portion of the district with a +5.25% enrollment advantage for Democrats> This slight advantage is buttressed by the non-enrolled outnumbering the GOP. The polar opposite is Oswego County where the GOP have a 18.46% enrollment advantage and the non-enrolled outnumber the Democrat. The blood red Oswego portion is much smaller than the slightly blue Onondaga portion, but that high partisanship and regional polarity is what makes this a basically even district.
There are only two common races that we can use to compare how the SD 50 votes; 2020 US President & 2022 New York Governor. Thanks to NY Redistricting and You we see that Joe Biden carried this district by 7.20% points in 2020 based on the new lines. However, Joe Biden carried the old #SD50 district by 13.2% so we can see the shift rightward. That shift right allowed Lee Zeldin to carry this district in 2022 by 4.45%. The district seems to vote differently based on higher turnout and polarization in a presidential election. I included the 2022, 2020, and 2018 senate race in this slide as a comparison. In 2020 and 2018 the race results were on the old #sd50 lines. In 2018 the GOP candidate Antonacci won the race by 1.9%. In 2020 John Mannion won the Senate district by 4.96%. Despite the shift right, John Mannion was able to win re-election in 2022, however it was just by ten votes.
Last year I introduced a new feature, the heat map. In this graphic I try to show the different kaleidoscope of registration states inside a particularly political subdivision. For #SD50 I break the registration down by the town and/or city registration advantage for either of the major political party. The heat map really shows the polarity of this district. The towns in Oswego County have the most GOP friendly towns of any district we will analyze this year with little to balance it out. Only the city of Oswego is not a definitive GOP advantage, and it is a borderline town with a very slight Democratic advantage. The towns in Onondaga County are the opposite. The town towns of Dewitt, Manlius and Salina make up the best area for Democrats with the rest being borderline towns with Clay, Geddes, and Camillus on the Democratic side and Cicero on the GOP.
When I introduced the heat maps last year there was always a general reaction. There was an illusion that the GOP, because of the larger land area where they had partisan advantage were the dominant force in any race. That is just not always true. In a new feature I look at the number of voters in a political subdivision in Democratic, Borderline, and Republican controlled areas. There are three towns in #SD50that have a 5% Democratic enrollment or better and they represent 64,771 voters or 29.8% of the district. 5 Towns make up borderline areas with less than 5% enrollment advantage for each party for 105,711 or 48.7%. Finally, twelve towns have a GOP enrolment advantage of 5% or more, but they only make up 46,729 voters or 21.5% of the district. The race for #sd50 will most likely be won in the borderline towns that make up so much of the district. The key may come down to being able to boost turnout in those borderline towns in the Onondaga County portion of the district.
Democrats will have a primary on June 25th between Onondaga County Legislator Christopher Ryan and former Oswego County legislator Tom Drumm. The winner of which will go on to face Salina Town Supervisor Nicholas Paro on the GOP side. Whoever the Democratic candidate is, they will have to beat Paro who has been elected in a Democratic town of Salina. Democrats will have to negate this perceived strength and look to maximize in other parts of the district inside and outside of Onondaga County.
That is, it for this edition of the #weeklywonk. Thank you to Dave’s Redistricting, NY Redistricting and you, the NYS Board of Elections, and the Onondaga and Oswego County Board of elections for providing the data within this week’s article. Next week I will take a look at NY Senate district forty-eight. #NY48 is the opposite of this week with an incumbent senator Rachel May and a GOP primary to challenge her. As always you can subscribe to dustinczarny.com for all content and election news updates.
In this week’s Zoom with Czarny I visit with our resident SCOTUS expert, Syracuse University Professor Tom Keck. We talk about the rulings we have gotten, the arguments we have heard, and the rulings to come later in June. Enjoy.
Subscribe to dustinczarny.com for all content and election news updates
Onondaga County Democratic Elections Commissioner Dustin Czarny explains a new state effort to centralize election data and outlines bills to improve local election administration.