(As Chair of the Democratic Caucus of NYSECA I will from time to time issue Memorandums of Support on Election bills before the NYS Legislature. I am posting them on my website for lawmakers and the public to know our positions. You can see my caucus’ legislative priorities here as well as the Bi-Partisan Legislative agenda for NYSECA here. If you agree with this bill consider contacting your local representative and asking them to support the bill.)
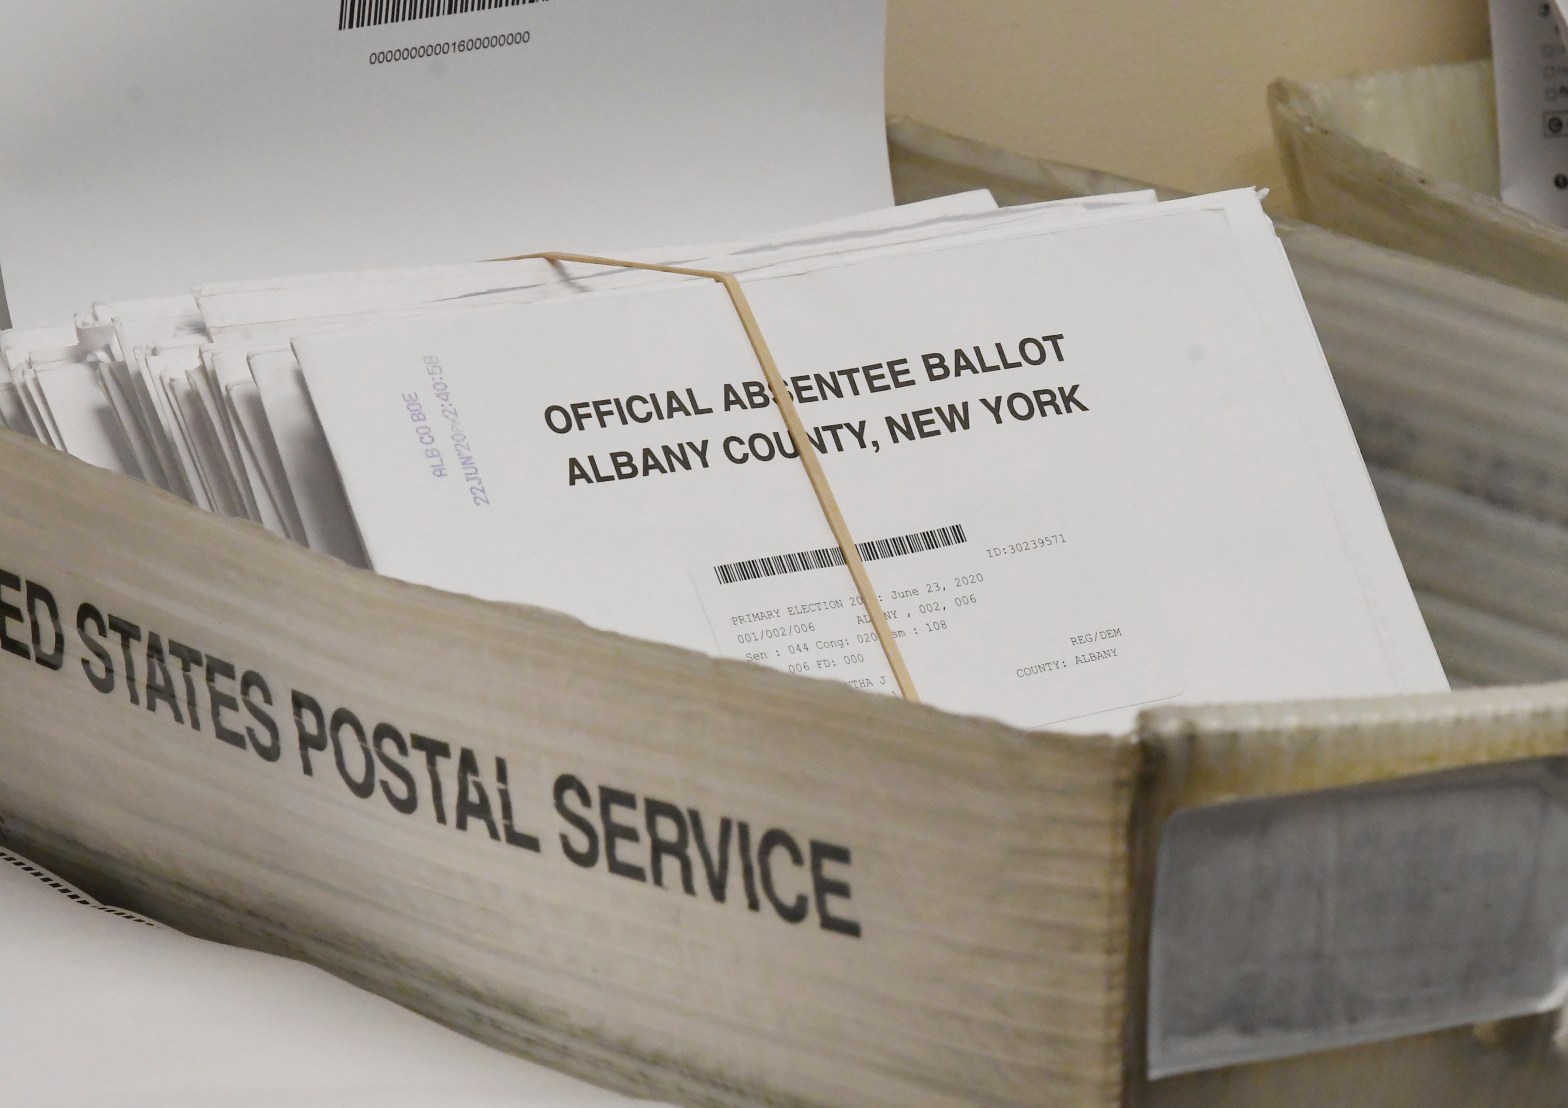
Summary: Allows delivery of an application for an absentee ballot to the board of elections through and on the day of the election.
The NYS Election Commissioners Association Democratic Caucus supports A1111 which would allow for the issuance of absentee ballots on Election Day. Currently the deadline for in-person absentee applications is the day before Election Day. One of the lessons of the last few years is that medical emergencies can happen after Boards of Elections close the Monday before Election Day or on Election Day itself. A voter can test positive for COVID or suffer another medical emergency that will cause the voter to choose between their own health, or in the case of a communicable disease, society’s health and their right and responsibility to participate in our Democracy.
Currently Boards of Elections are split on how to handle situations like this. Some issue absentees with both commissioners’ consent, some make the voter, or their representative, get a court order. Removing the ambiguity in the law by enacting this bill will not only protect the rights of the voters but give clear direction to Boards of Elections as well.
(As Chair of the Democratic Caucus of NYSECA I will from time to time issue Memorandums of Support on Election bills before the NYS Legislature. I am posting them on my website for lawmakers and the public to know our positions. You can see my caucus’ legislative priorities here as well as the Bi-Partisan Legislative agenda for NYSECA here. If you agree with this bill consider contacting your local representative and asking them to support the bill.)
Summary: Relates to school session days; adds general election day to the list of days when school will not be in session; allows a school district to elect to require staff attendance on a general election day or to schedule a professional development day.
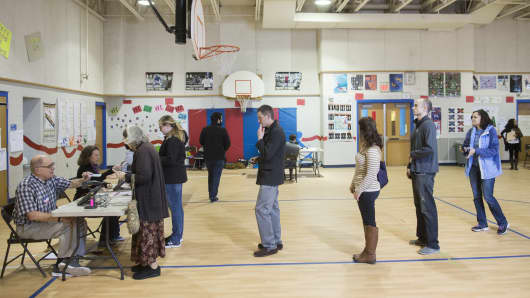
The NYS Election Commissioners Association Democratic Caucus supports S2024A/A4294 which would mandate a non-student attendance day for each General Election. It has become increasingly hard for Boards of Election to find HAVA acceptable buildings for use as polling places. Schools in many urban, suburban, and rural communities are the only acceptable buildings for voters to gather in. The COVID pandemic has exacerbated this problem, as traditional polling places such as churches and nursing homes have either closed or refused to be polling places.
With the rise in school safety issues, parents, teachers, and administrators have raised concerns related to locating poll sites in schools. To alleviate this problem, many school districts across the state have already adopted calendars that move their late October, early November staff development days to the General Election Day. However, some schools have refused to do so. Doing so statewide would eliminate the concern for student safety during elections. Additionally high school seniors would be available as Election Inspectors, filling another major need of our Democracy.
This week I sit down with Jane Rice who is running for Fayetteville Village Trustee and Anny Henry running for Manlius Village trustee. They talk about why they are running for village board and what it is like running for election in march. Village elections are March 21, 2023 6am to 9pm.
Subscribe to dustinczarny.com for all content and election news updates
(As Chair of the Democratic Caucus of NYSECA I will from time to time issue Memorandums of Support on Election bills before the NYS Legislature. I am posting them on my website for lawmakers and the public to know our positions. You can see my caucus’ legislative priorities here as well as the Bi-Partisan Legislative agenda for NYSECA here. If you agree with this bill consider contacting your local representative and asking them to support the bill.)
Summary: Relates to recounts of ballots conducted by the board of elections or a bipartisan committee appointed by the board
Justification
The NYS Election Commissioners Association Democratic Caucus supports A1014/A1259 which would alter the statewide manual hand count threshold put into effect in 2021. It is the experience of our county boards that only the closest of races where voter intent on the ballot comes into play can result in a lead change. We believe allowing for an alternative scan on races under ,5% but over .25% is sufficient to determine the machine counts are correct. This will allow Boards of Elections to expend their limited resources on the races that are truly deserving of the hand count, those races that are .25% or less separating the vote leader and those trailing. The same logic applies to the minimum vote count of 20 being reduced to 10. This keeps races that are not likely to flip away from the hand count at the end of the election.
This week I give a preview of the village elections happening on March 21, 2023 in Onondaga County. I also talk about the budgets released by New York State Assembly Majority & New York State Senate Democratic Conference today that each has assigned millions of dollars for County Board of Elections.
Subscribe to dustincarny.com for content and election news updates
(As Chair of the Democratic Caucus of NYSECA I will from time to time issue Memorandums of Support on Election bills before the NYS Legislature. I am posting them on my website for lawmakers and the public to know our positions. You can see my caucus’ legislative priorities here as well as the Bi-Partisan Legislative agenda for NYSECA here. If you agree with this bill consider contacting your local representative and asking them to support the bill.)
Summary: Makes commissioners full time employees of the board.
The NYS Election Commissioners Association Democratic Caucus supports S611/A10919 which would mandate that NYS Election Commissioners be full time employees of their Board of Elections. In 2019 the New York state legislature drastically changed the political calendar in New York by moving the September primary in June. This move created a full calendar’s worth of work for Boards of Elections. We now hold election events in March (Village), May (School Boards), June (Village & Primaries) and November (General election. Each event will have 6 months of preparation work along with year-round voter database management.
Full time commissioners are a must even in the smallest of our counties. Decisions need to be made year-round and often daily by the appointed officers of the Board. Often Elections Commissioners who are now part-time end up working full time hours without pay to carry out the reforms the NYS legislature has enacted. It will also help us recruit better candidates for open commissioner positions by offering full time employment in their county of appointment.
(As Chair of the Democratic Caucus of NYSECA I will from time to time issue Memorandums of Support on Election bills before the NYS Legislature. I am posting them on my website for lawmakers and the public to know our positions. You can see my caucus’ legislative priorities here as well as the Bi-Partisan Legislative agenda for NYSECA here. If you agree with this bill consider contacting your local representative and asking them to support the bill.)
Summary: Requires every board of elections to employ a minimum of four full time employees in addition to the appointed commissioners and two additional employees for every twenty thousand active registered voters beyond forty thousand active registered voters.
The NYS Election Commissioners Association Democratic Caucus supports S644/A1258 which would establish a minimum level of staffing for Boards of Elections throughout New York State. Under this bill over 20 counties will receive a mandatory boost in staffing as we prepare for the 2024 Presidential election. This staffing is desperately needed this year as online and automatic voter registration adds to our ever-increasing voter registration requirements.
By establishing a minimum staffing level counties can prepare their budgets next year and beyond. This will also provide basic support to every county in New York. By removing the wide disparity in staffing levels citizens will be able to avail themselves of the same basic level of services and speed no matter where they live in New York State. It will also inoculate Boards of Elections from irresponsible staffing cuts made by County governments that could disenfranchise voters.
(As Chair of the Democratic Caucus of NYSECA I will from time to time issue Memorandums of Support on Election bills before the NYS Legislature. I am posting them on my website for lawmakers and the public to know our positions. You can see my caucus’ legislative priorities here as well as the Bi-Partisan Legislative agenda for NYSECA here. If you agree with this bill consider contacting your local representative and asking them to support the bill.)
Summary: Increases the term of office of an election commissioner from two to four years beginning January first of each odd numbered year.
The NYS Election Commissioners Association Democratic Caucus supports S6933/A4777 which would mandate 4-year terms for Elections Commissioners in New York. We believe Elections Commissioners should be judged on the 4-year cycle of elections we have in New York. The Presidential and Gubernatorial election years are separated by two local years. Having a four-year cycle will allow election commissioners to navigate the challenges of each year before having to stand for re-appointment. It will also allow elections commissioners to make proper decisions based on Election Law, precedent, and proper equity in their Board decisions without having the shadow of a 2-year term hanging over their employment. It will also help recruit better commissioners by giving them a minimum of four-year job security.
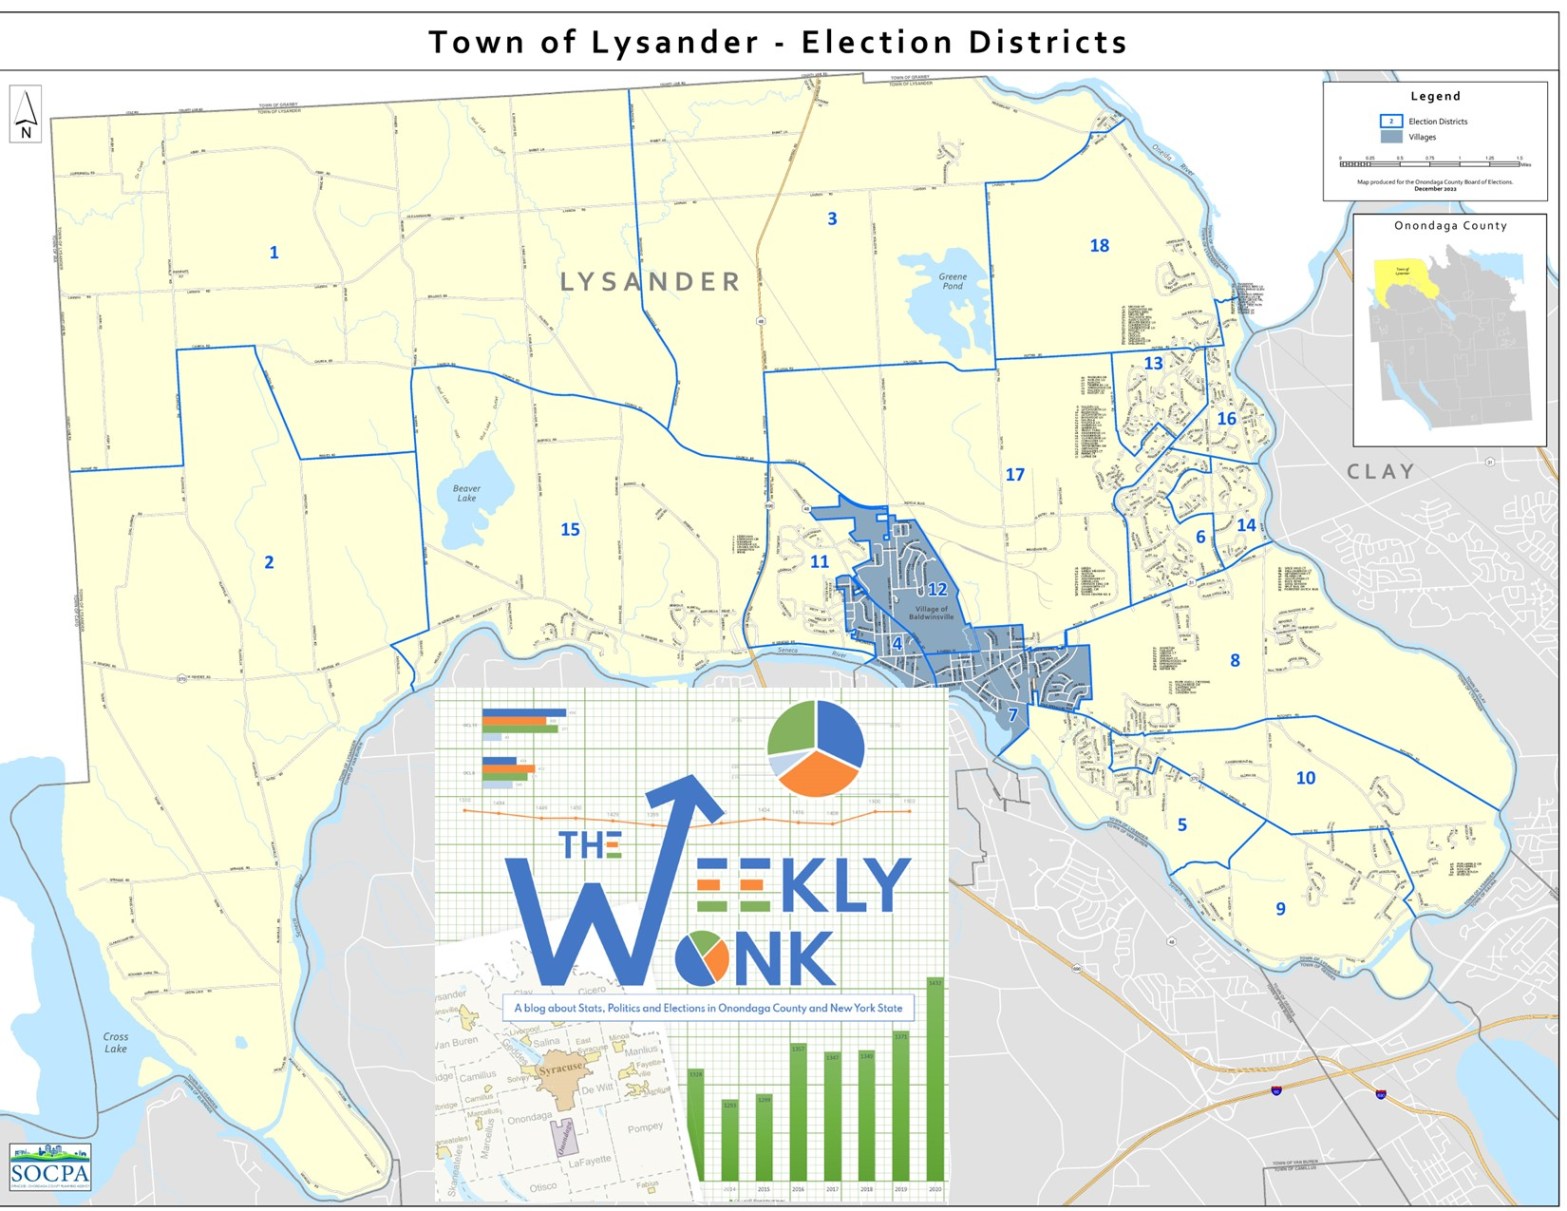
Welcome back to the #WeeklyWonk. Each weekend I release an article on a subject relating to elections in Onondaga County and New York State. Often these articles will have detailed stats to consume but sometimes they will be a recap of a prominent issue or on relevant election law. I am turning my eye to the 2023 elections. This week I take a break from looking at the political subdivisions and focus on a work item from the Onondaga County Board of elections. Today I look at the Town of Lysander who will have competitive races this fall
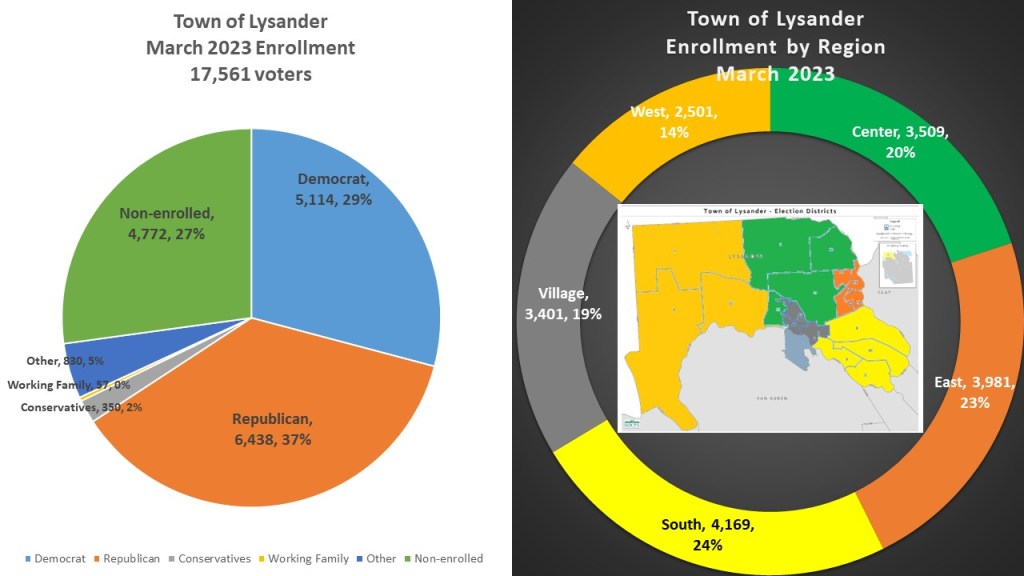
The Town of Lysander sits in the Northwestern most point of our county and is seen as one of the more GOP leaning towns. The Town of Lysander has 17,561 voters. The Town of Lysander partisan breakdown shows a strong GOP lean. The GOP has 6438 37%) of the active registered voters, 5114 (37%) are registered Democrats, and in third place 4772 (27%) are registered non-enrolled. While a strong GOP plurality, Democrats are ahead of non-enrolled which indicates they have a fighting chance in this town. I have split the Town into 5 different distinct regions (Center, East, South, Village, and West. The Center are the eds from north of the village of Baldwinsville to the Oswego border and have 20% of the voters. The East are smaller denser eds bordering the town of Clay and have 23% of the voters. South are a set of eds in the southeastern corner of Lysander between Clay and Van Buren and touching Salina and has 24% of the voters. The village section is the northern half of the village of Baldwinsville that is part in Lysander and part of Van Bure with 19% of the voters. The West are the western most rural Eds that have 14% of the voters.
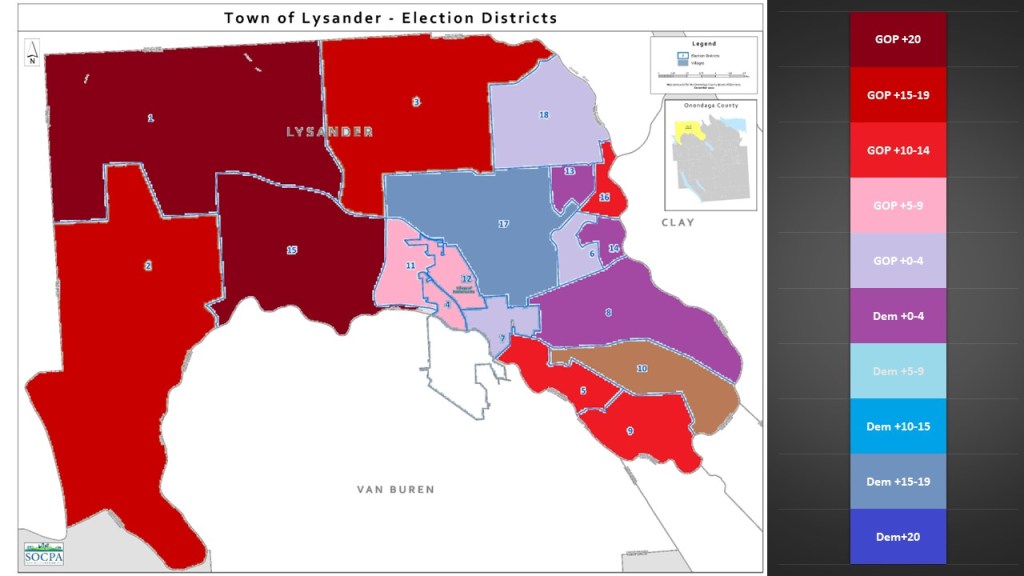
In a new feature I am bringing to the #weeklywonk this year I am doing a heat map for each political subdivision. I will be looking at the current partisan makeup of each individual ED and heat mapping its partisan lean based on the advantage for the Democrats and GOP. Lysander is a GOP town but there are eds where Democrats do have some advantage. The rural eds in the western part of the district are heavily GOP but as we move east it gets a little better. There are just 4 eds with actual Democratic advantage, we have slight leans in EDS 8,13,14, and a major advantage in ED 17. The other EDS have a variety of GOP advantages with slight leans in EDS 6,7, & 18, standard advantages eds 4,11, & 12, substantial advantage in eds 5,9, & 16, major advantages in eds 2 & 3, and overwhelming advantages in eds 1 & 15.
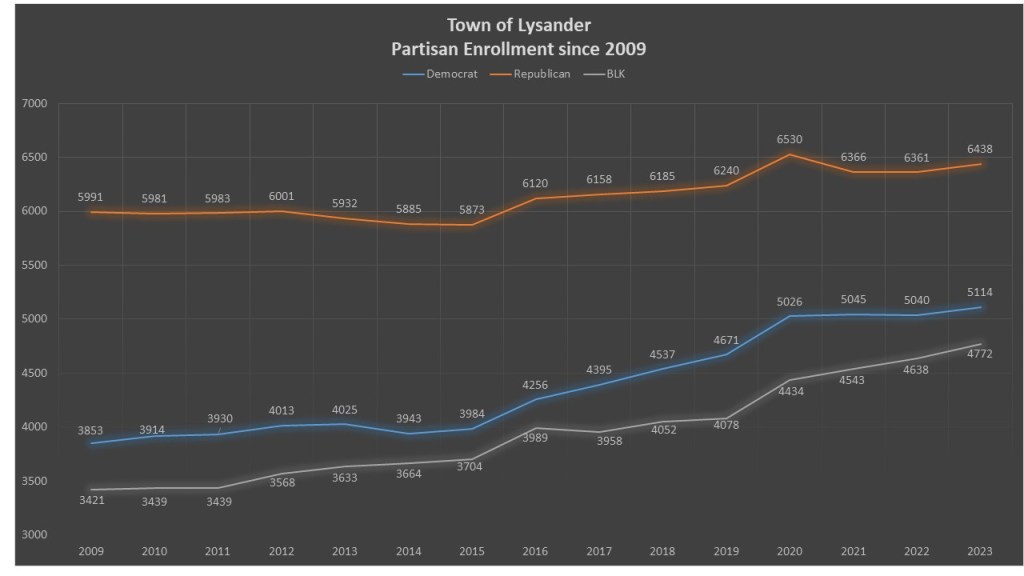
The Democrats in the Town of Lysander as well as the non-enrolled are making significant in-roads into the GOP plurality. This is partly due to a reaction to Trump in 2016 as we saw in other communities but really an ongoing process as the town grows. Since 2009 Democrats have gained 1261 voters. The Non-enrolled has grown the most with 1351 voters. The GOP has grown as well since 2009, but at a smaller rate gaining just 447 voters. This means the Democrats and non-enrolled have gained at 3 times the rate as the GOP.
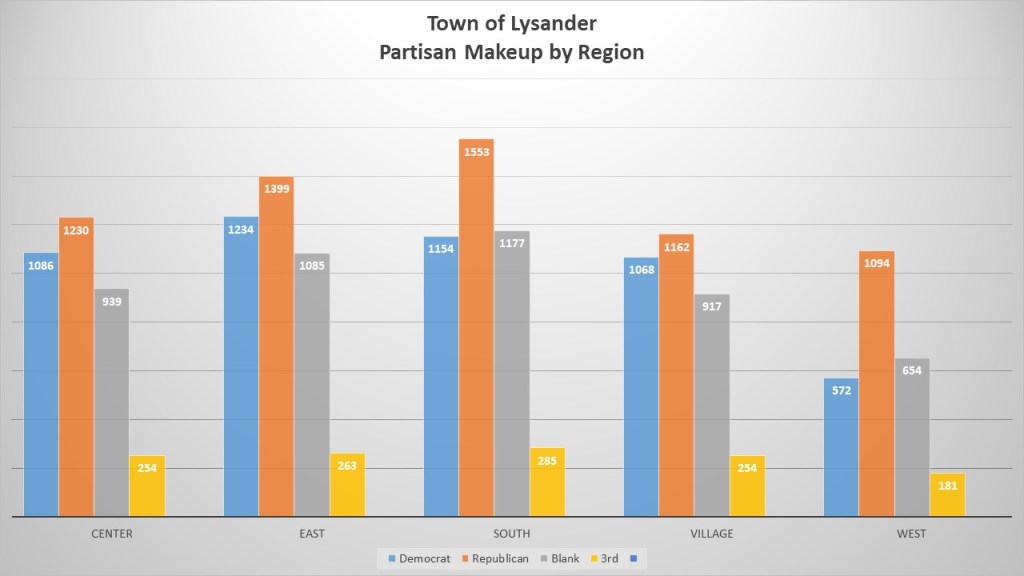
When we look at the partisan breakdowns in the regions, despite the g=inroads Democrats have made, they do not have a plurality in any of the regions. The closest they are to the GOP are in the village section where they only slightly trail the GOP. They are also faring well in the Center and eastern portions of the district, as they are behind the GOP but just by a little more than the Village portion. In the southern and western portion not only do the Democrats trail the GOP, badly, they are also in 3rd place to the non-enrolled.
Looking at the growth of voters since the last redistricting cycle, 2012, we see that the regions are all growing, but at a different rate. The southern portion or Lysander is growing at twice the rate of the other regions gaining 1091 voters. The Center, East, and Village regions are all growing at a moderate pace. The Center grew by 599 voters. The East grew by 575 voters. And the Lysander portion of the Village of Baldwinsville grew by 554 voters. The rural western portion of Lysander grew the least gaining just 350 voters.
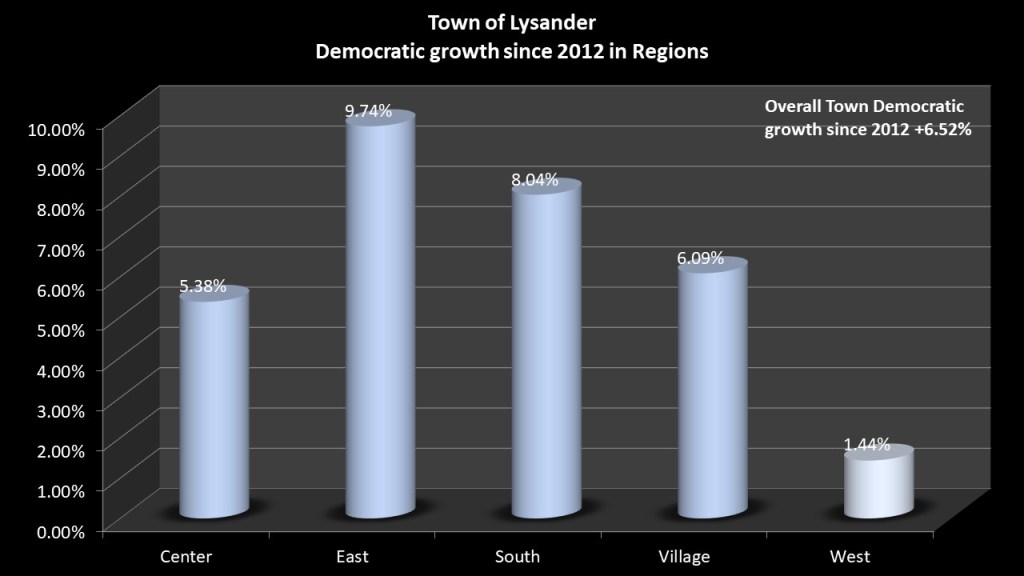
As noted, Democrats have been gaining and we can see that Democrats since 2012 have gained in every region. When we look at the partisan divide Democrats have closed the gap most aggressively in the East, gaining 9.74%. The South, despite being the most dominant GOP region, Democrats have grown as the region grows gaining 8.04%. The Village portion of Lysander has seen Democratic gains of 6.09%. The Center portion also saw modest Democratic gains of 5.38%. The Western portion Democrats have only made small gains, 1.44%.
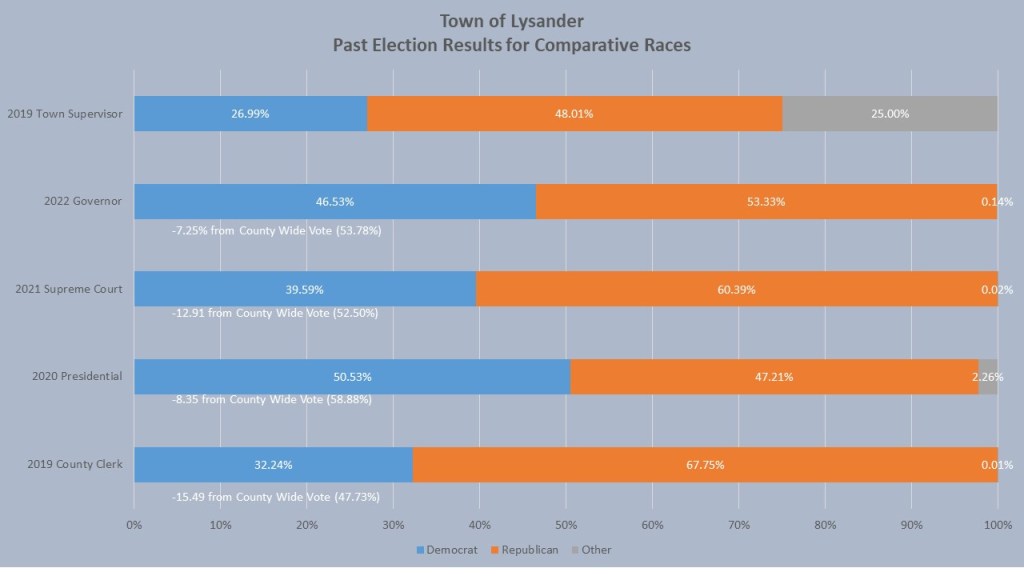
When we look at the comparative races, we see a Town that solidly votes GOP in November with few exceptions. In the 2022 Governor’s Race the Town of Lysander voted for Governor Hochul’s opponent Lee Zeldin with 53.33% of the vote, 7.25% less than the rest of Onondaga County. In 2021 the town of Lysander voted for the GOP candidate by 60.39%, 12.91% less than Onondaga County as a whole. The only Democratic win was President Biden, carrying Lysander with just 50.53% of the vote, which was 8.35% than his countywide results. Lisa Dell, the GOP candidate for County Clerk, was able to win largely because of her performance in Lysander, where she was Town Clerk, with 67.75% in the 2019 County Clerk race, 15.49% more than the countywide results. The last local race of note was the Supervisor race in 2019. While the GOP candidate won the race, they only managed to get 48.01% f the vote in a 3-way race. The Democrat was second with 26.99% and the independent was third with 25.00% of the voter.
In 2023 the Lysander Town Democrats are currently passing petitions to challenge the supervisor race again. Kevin Rode was the Democrat who came in second in 2019 and subsequently won a seat on the Town Board is looking to challenge the supervisor again, this time one on one and he has the Conservative party endorsement. William Stowell is running for Town Board on the Democratic line and Ken Christopher is for Town Justice. It is noted in the past the Democrats had a coalition of GOP and Democratic voters gave them control of the Town Board and Supervisor before losing it in a caucus snafu in 2013. Past results show it is possible to form such a coalition, specially if turnout can be boosted, to achieve victory. Contact Vicky Freylue the Lysander Democratic Chair if you want to help at vickie.freyleue@gmail.com or find them on Facebook here.
That is, it for this week’s edition of the #WeeklyWonk. Next week I will dive into the Town of Manlius, one of the Democratic superstars of the last few election cycles, As always go to dustinczarny.com and subscribe to get all your content and election news updates. I run that website, along with these series of articles, as part of my voter education. I never take ad money or charge subscriptions paying for the site with my own personal funds. Subscribe here.
In this week’s episode I interview Joanna Zdanys of the Brennan Center for Justice. We talk about the push for funding the Public Campaign Finance board as well as the Brennan Center’s other work on making Democracy better in New York and throughout the US. Enjoy.
Subscribe to dustinczarny.com for all content and election news updates