Democratic commissioner Czarny says they can detect tampering with ballot envelopes and other questionable activity.
“If there is any deficiency, whether intentional, or most often unintentional, we have a cure process that notifies the voters of the deficiency in their ballot and gives them a chance to contact us to correct it. Or, if they didn’t request the ballots and let us know about that.”
Czarny says it’s quite easy to catch those who purposely commit voter fraud, and the penalties are quite severe.
Today I talk about the Court of Appeals ruling upholding Early Vote by Mail that has been in place this year. This is the end of the road for the GOP lawsuit and this new option for voters is here to stay. Also the Democratic National convention is ongoing and i recap the unique nature of this convention. Enjoy.
Subscribe to dustinczarny.com for all contents and election news updates
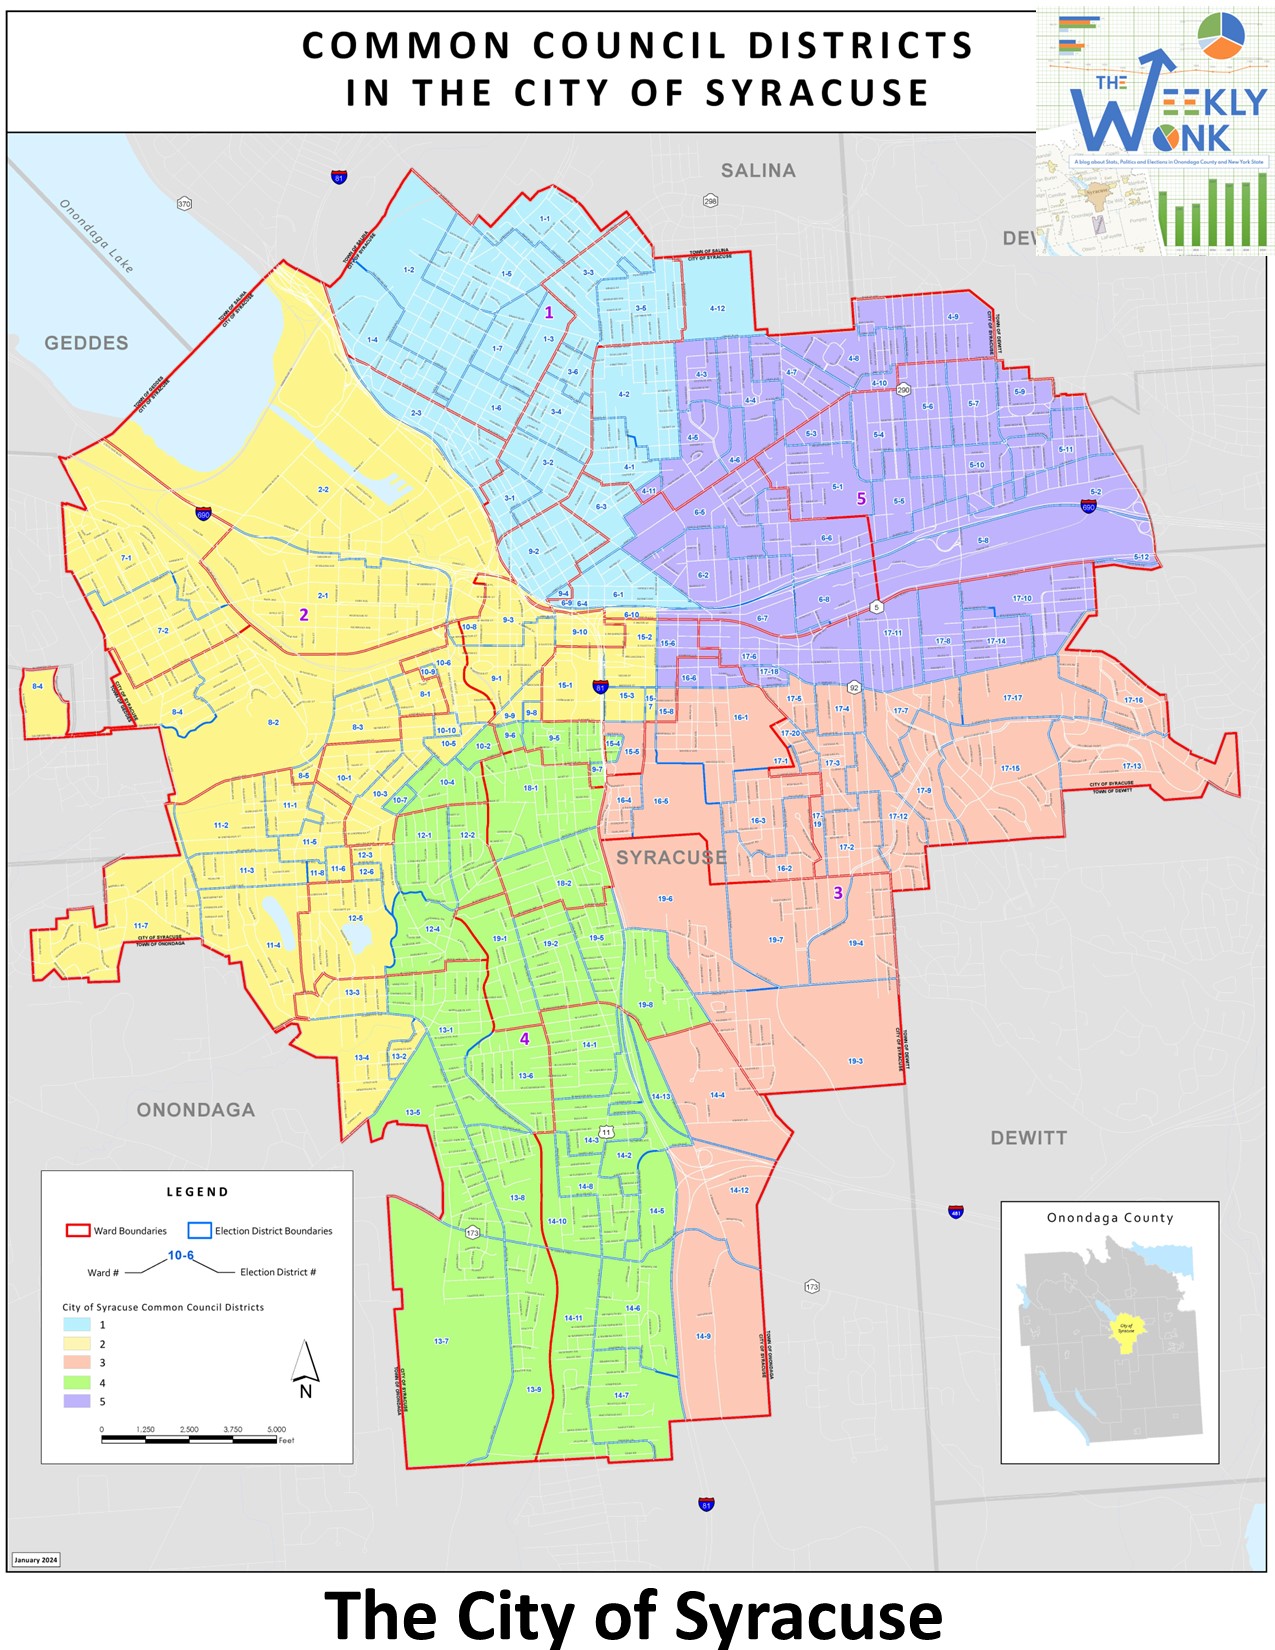
Welcome back to the #weeklywonk. This is my weekly article on election statistics and related topics. These articles give insight into the data and statistics that make up our home, Onondaga County and New York State. Each week I investigate a different election event or political subdivision that can give us clues into our rich and diverse electoral tapestry. Now that the June primary has been certified we turn our attention to the General Election. We continue our look at Onondaga County overall with our final piece of the puzzle, the City of Syracuse. Today we will look at the 19 Wards and 5 Common Council districts that make up the center of Onondaga County.
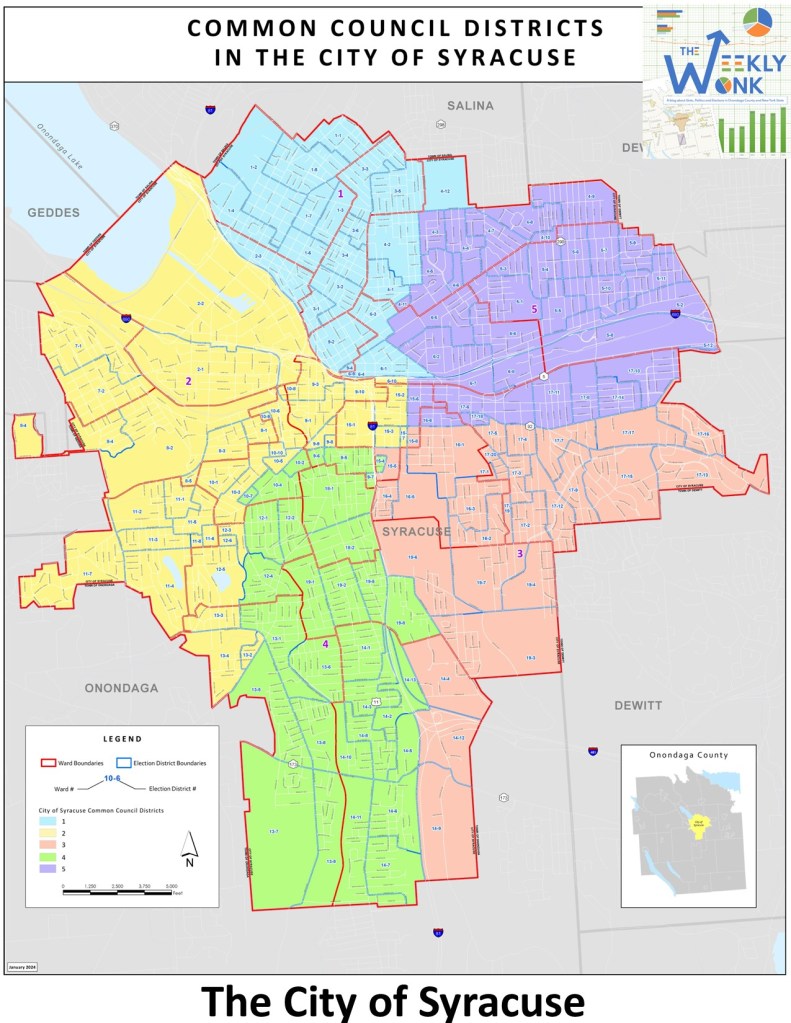
The City of Syracuse has 71,574 active registered as of August 2024. Democrats make up 39,181 (55%), Republicans 9,113 (13%) non-enrolled 19,437 (27%), Conservatives 658 (1%) Working Families 593 (1%) and 2,594 (3%) are in various other not recognized parties. The City of Syracuse has 5 Common Council districts that divide the city. The city radically redrew the maps following the 2020 census and now these districts tend to fall along neighborhood lines. Since they are drawn on population numbers, the active voters can vary. The smallest is the 1st Common Council makes up 16% of the active voters (11,670). The 3rd Common Council has 18% (12,4880 of the voters. The 2nd Common Council has 21% (15,164) of the voters. The 4th Common Council has 22% (15,864) of the voters. Finally, the 5th Common Council has 23% (16,343) of the voters.
When we look at the partisan trends in City of Syracuse the story is the atrophy of the Republican party and rise of the non-enrolled. The Democrats have remained surprisingly stable. Since 2009 the Democrats have just added 109 voters. In the same time period, the non-enrolled have added an outstanding 2,853 voters. The big loser here is the GOP. Echoing trends, we have seen across the nation that the GOP has lost 3,871 voters since 2009. One of the things I am tracking this year is how subdivisions have changed since the last Presidential election. Democrats have lost 2143 voters in the City of Syracuse and Republicans have lost 558. The non-enrolled continued to gain, adding 1476 voters. While this is a bit of an alarming trend, there is a caveat. There is a long trend of falling registrations in between Presidential years with a massive rally in the Presidential year itself. A good deal of that comes in the last few months of the year. We will follow up on those 2020 numbers right before the November 2024 general election.
Taking a look at the partisan makeup of the common council districts we can see why all Democrats now represent the Syracuse Common Council. The last common council district to be represented by the GOP is the 1st Common Council, which flipped to Democrat in 2021 though it was redrawn as all districts were for the 2023 elections. The 1st Common Council is now a solidly northside district and has a +30.27 Democratic lean. The 2nd Common Council district representing the west side has a +37.94% Democratic lean. The 3rd Common Council district representing the University and east side has a +51.95% Democratic lean. The 4th Common Council district representing the southside and valley has a +53.47% lean. Finally, the 5th Common Council representing Eastwood and Sedgewick neighborhoods has a +35.44% lean. These overwhelming Democratic numbers not only lead to the representation we see, but the more frequent primaries inside the city.
With that we check in on the heat map for City of Syracuse. For the heat map we look at the nineteen wards inside the City of Syracuse. The City of Syracuse presents a special challenge for our heat map. In the past we identify a top level of Democratic advantage of over 205. Every Ward in the City would have fallen into that category to make a very boring heat map. There is value though to show the intensity of the Democratic advantage inside the city. To that end I have added three more categories of Democratic advantage to this heat map. The 1st, 3rd, 5th, and 7th Wards fall into the 2029% Level. The next level of 30-40% Dem advantage exists in the 2nd, 4th, 6th. Eighth, and 11th wards. The 9th, 13th, 14, 15th, and 16th wards fall into the 40%-50% range. Finally, the biggest Democratic advantage in the city of over 50% Dem advantage belongs to the 10th, 12th, 17th, 18th, and 19th wards.
The domination of the Democrats inside the City is reflected even when we look at the effect of third parties on the enrollment advantages. One of the analyses I have added this year is how the Conservative and Working Families parties affect the ideological tilt of a political subdivision. Usually, the conservatives outnumber the working families by 3 to 1 or more and thus shift the subdivision to the right. They are virtually tied in the. y of Syracuse registration wise and that is reflected in the individual wards as well. This chart shows percentage of each ward when we add enrolled Democratic and Working Families voters together and compare it to Republicans and Conservatives added together. The colored totals above the advantages show the shift when adding in Conservative and Working Families numbers. This may be the only place inside the county where there are actually shifts to the left. Eight wards represented with blue numbers, shift to the left. Nine wards represented with red numbers shift to the right. Two wards represented with white numbers stay exactly the same. In general, though no shifts are less than 1% and in general.
Finally, we look at the comparative races and how they perform in the City of Syracuse vs. the county overall. In general, the city of Syracuse in general reacts around 20% more Democratic than the county as a whole. In 2022 Governor Kathy Hochul win the County due to her 7.51% performance inside the City, +19.72% from her county wide vote (53.78%). In the 2021 Supreme Court race Anthony Brindisi got 73.78% of the city of Syracuse vote +21.28% than his Onondaga County total (52.50%). President Biden’s 2024 race performed the best of our comparative race inside the City of Syracuse with 76.96% of the vote but that +18.08% better than his Onondaga County total (58.88%). County Clerk Emily Essi’s win in 2023 was largely propelled by her performance inside the City of Syracuse winning 72.50% of the vote which was +22.36% better than her narrow county win total of 50.14%. Finally, I added the 2021 Mayoral race results into the mix as a preview for next year’s Mayoral race. Mayor Ben Walsh, an independent, won 6052% of the vote, compared to Democrat Khalid Bey’s 27.68% and 11.80% for Republican Janet Burman.
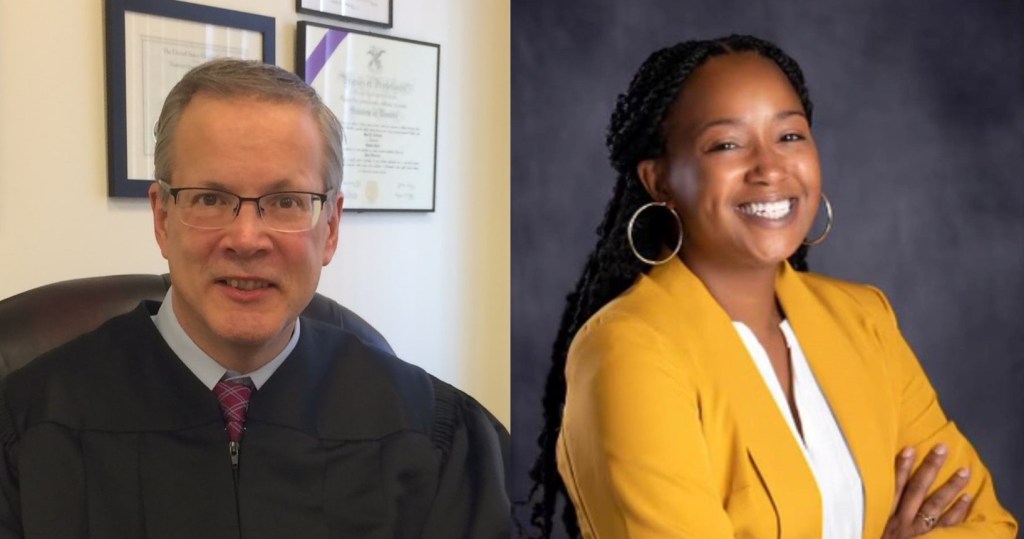
The only races inside the City of Syracuse this year are City Court judges. Judge Ross Andrews is running for re-election and newcomer Staci Dennis-Taylor is running for the second seat caused by the retirement of Judge Vanessa Bogan. There are no other declared candidates for these seats. They are running on the Democratic line. The City of Syracuse though will play a large part in potential victories for Democrats running for Congress, State Senate, Assembly, and Family Court.
That is, it for this edition of the #weeklywonk. Nest week I will look at the first political subdivision that is having a competitive election this fall. The Town of Clay, the largest town in Onondaga County. As always you can subscribe to dustinczarny.com for all content and election news updates.
In this weeks episode I sit down with Senator Rachel May. She represents the 48th Senate district representing Syracuse, The western and southern towns in Onondaga County and all of Cayuga County including Auburn. We talk about her time on the Senate and her re-election campaign. Enjoy.
Subscribe to dustinczarny.com to get email notifications of content and election news updates
“I think, telling people where you live is actually kind of a low threshold where to cross. It’s an easy question to answer for most people and I think that’s something that Mr. Kennedy should have taken into account before he filed his paperwork,”
This week I am pulling a little of an audible and addressing the new ruling by NYS Supreme Court that RFK Jr. will not appear on the ballot for President. I read from the ruling and detail why I think this is a significant ruling if upheld, beyond the electoral chances of RFK Jr. himself. Enjoy.
This week I sit down with Chris Ryan. Chris is the current Onondaga County legislature minority leader and sitting 7th district legislature. He is the Democratic and Working Families candidate for NYS Senate district 50. This is poised to be one of the most competitive seats in NYS. Enjoy
Today I talk to you from the NYSECA summer Conference, So a little Commissioner from a conference action. I give my first instant reaction to the strength of he Tim Walz pick and the way he will get on the ballot in all 50 states. Enjoy.
Subscribe to dustinczarny.com for all content and election news updates
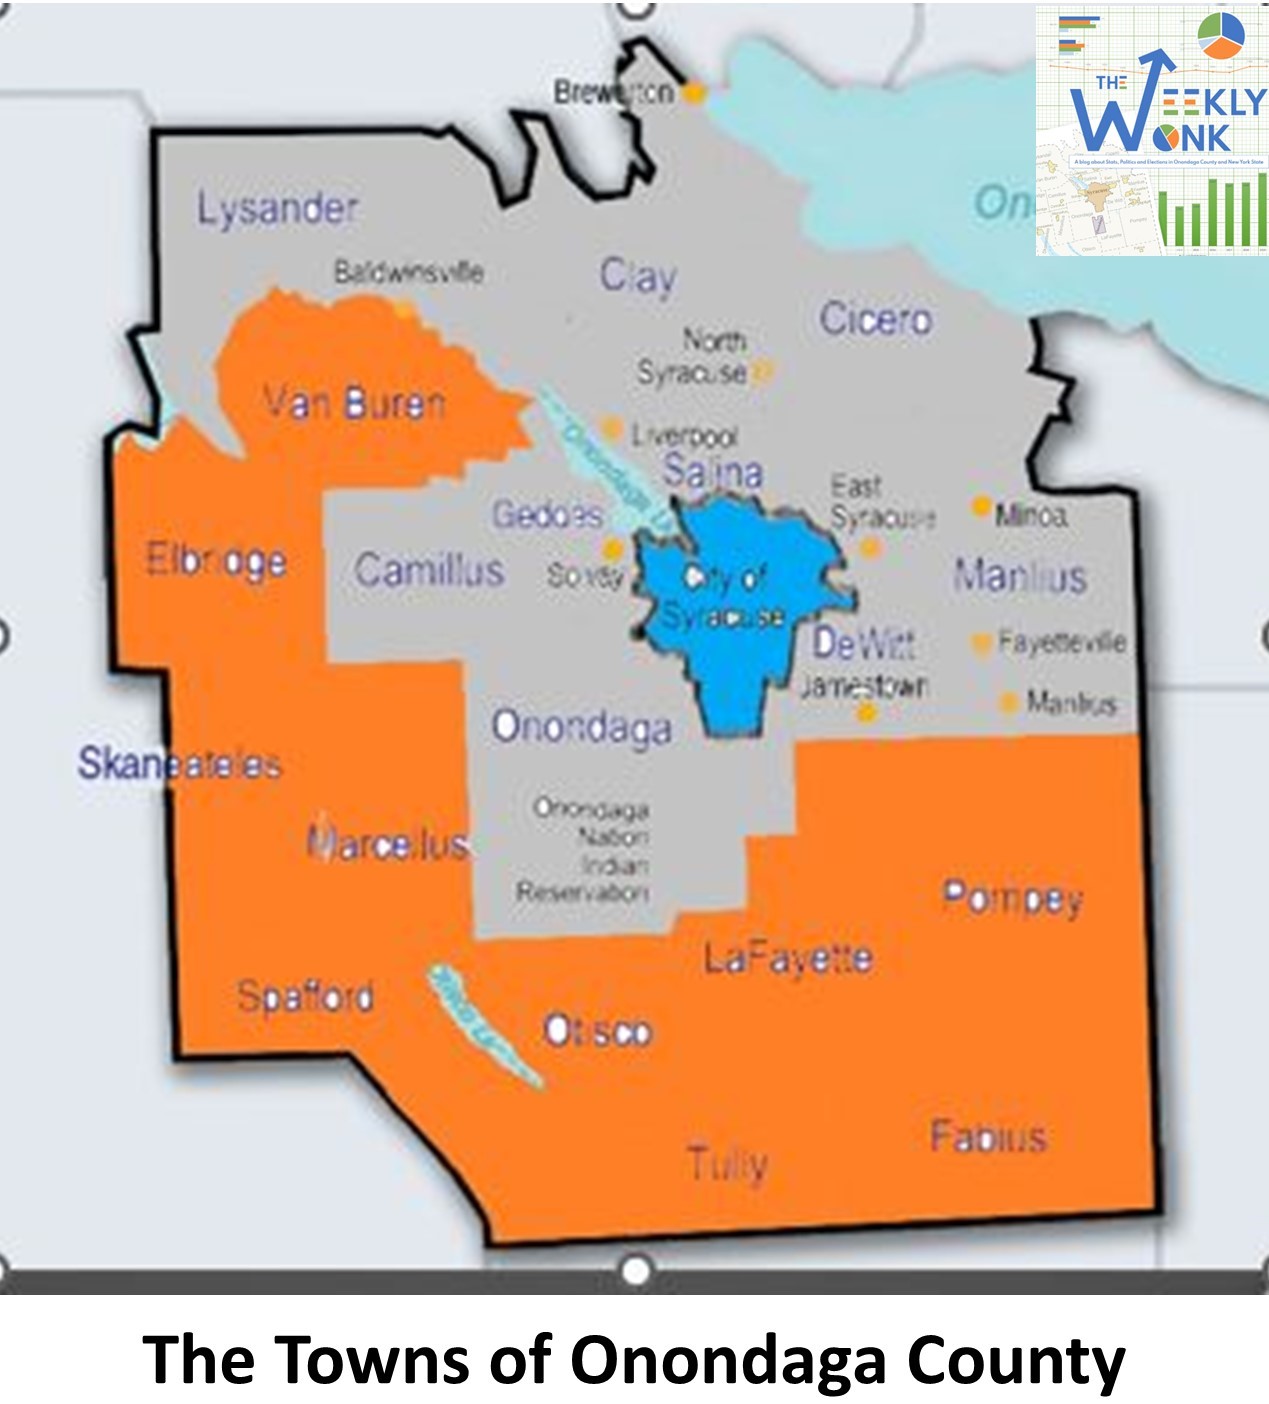
Welcome back to the #weeklywonk. This is my weekly article on election statistics and related topics. These articles give insight into the data and statistics that make up our home, Onondaga County and New York State. Each week I investigate a different election event or political subdivision that can give us clues into our rich and diverse electoral tapestry. Now that the June primary has been certified we turn our attention to the General Election. We continue our look at Onondaga County with a focus on the suburbs. We look at the seventeen towns that surround the City of Syracuse.
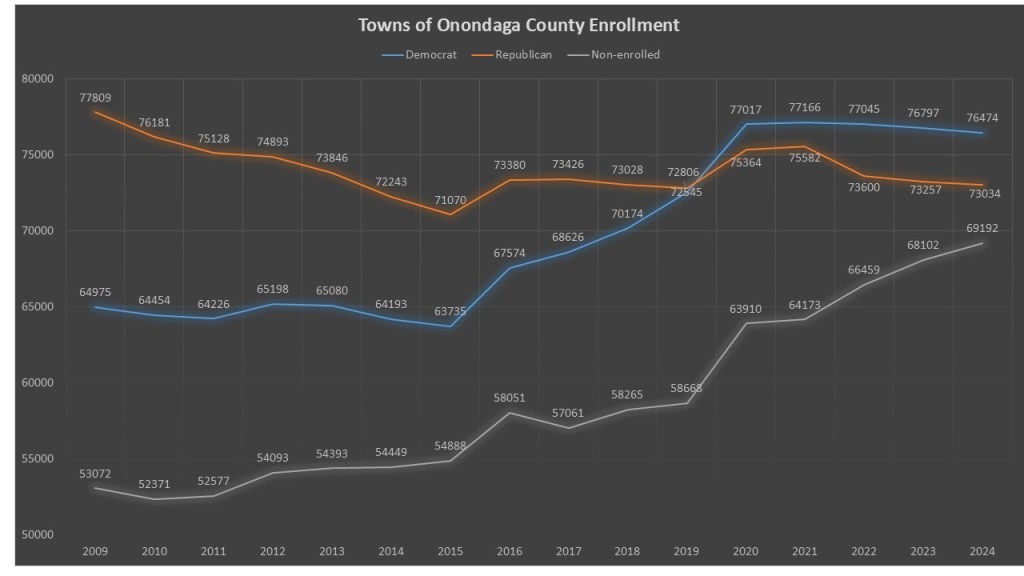
We have 234,608 active registered voters in the suburbs of Onondaga County as of the close of July 2024. Democrats make up 76,474 (33%), Republicans 73,034 (31%) non-enrolled 69,192 (29%), Conservatives 4,407 (2%) Working Families 830 (<1%) and 10,671 are in various other not recognized parties (5%). The City of Syracuse only makes up 23% (71,098 voters) of the active voters of Onondaga County. The rest belongs to the suburbs. The suburbs can essentially be broken into two distinct types of towns. We have large suburban towns and small agrarian towns. The large suburban towns make up 64% (194,273 voters) of Onondaga County. The small agrarian towns make up just 13% (40,335 voters despite being roughly equal in acreage.
When we look at the partisan trends in Onondaga county, we see now familiar term trends since 1996 and also short-term trends since the last presidential election. Since 1996 Democrats in the suburbs have added 11,499 voters, & the non-enrolled have added 16,120 voters. The GOP though has lost 4,775 voters. However, since the 2020 election we are seeing a new trend. Democrats have lost 543 voters, and the GOP have lost 2,330 voters. However, the non-enrolled has exploded, adding 5,282 voters. It will be interesting to see whether this trend changes at all as registrations come in for the fall Presidential election.
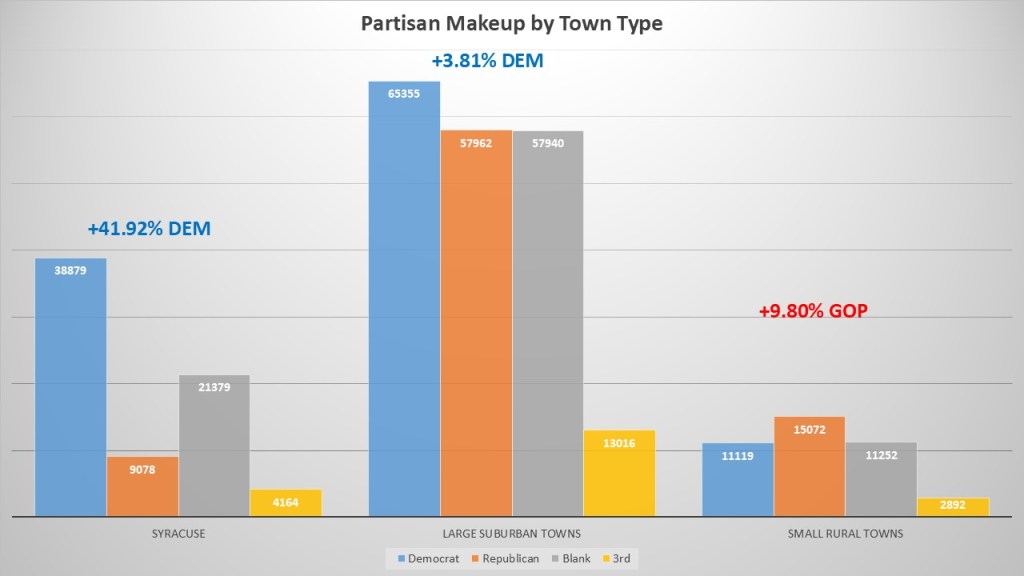
Taking a look at the partisan makeup of the suburban regions of Onondaga County we can see why a pretty strong polarization. The City of Syracuse is the most Democratic with Democrats having a +41.92% enrollment advantage. The large suburban towns end up having a borderline Democratic advantage of 3.81%. The rural towns have a moderate GOP lean of 9.80%. The heavy Democratic lean of Syracuse and small lean of the large suburban towns is what is driving the partisan lean of Onondaga County as the shear numbers overwhelm the small agrarian towns to give Onondaga County its slight blue lean. In fact, the sheer numbers of the suburban towns alone allot the Democrats to have a small advantage even outside of the City of Syracuse.
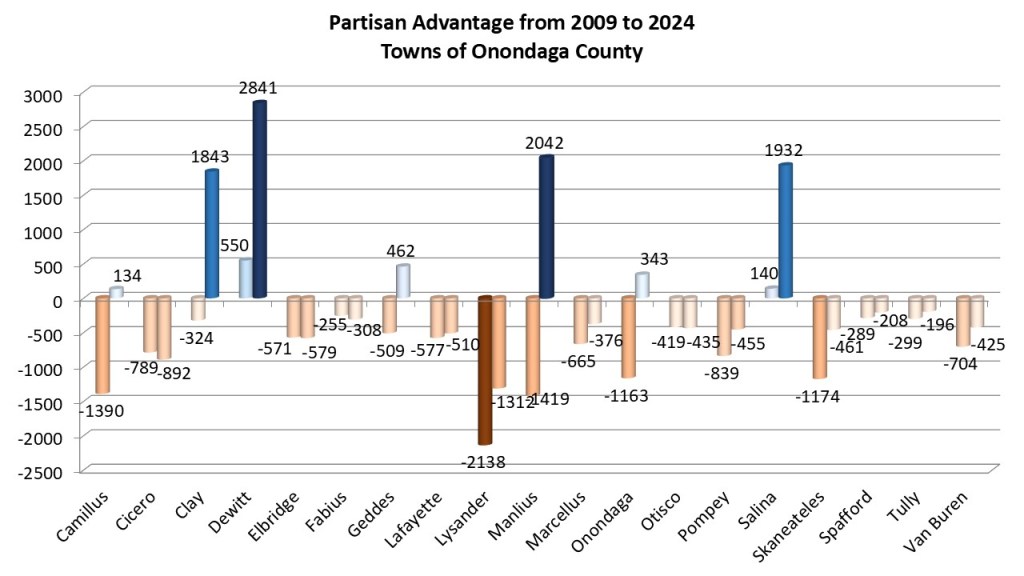
We will take a look at most of these towns individually throughout the rest of the year, especially if they are having competitive races. However, this graph shows how towns have changed since 2009. Almost every town has gotten more Democratic over time. Since 2009 2 towns were slightly Democratic (Dewitt and Salina) and expanded their Democratic advantage. % towns (Camillus, Clay, Geddes, Manlius, & Onondaga) flipped from Republican advantage to Democrat, with Manlius being the biggest swing. We have had eight towns (Lafayette, Lysander, Marcellus, Pompey, Skaneateles, Spafford, Tully, & Van Buren) reduce their GOP advantage though remain Republican. Finally, four towns (Cicero, Elbridge, Fabius, & Otisco) have increased the GOP advantage over the last 15 years.
With that we check in on the heat map for Onondaga County. This has essentially remained unchanged since 2020. You have your bright blue dominant City of Syracuse in the middle of the county. You then see the easter direct suburbs with the dark solid democratic lean of Dewitt, followed by the slight leans of Manlius & Salina. The borderline Democratic towns of Clay sit to the north, and Camillus, Geddes, and Onondaga County to the direct west of Syracuse. Borderline GOP towns of Van Buen sit in the northwest and Cicero in the northeast. Slight GOP towns in Lysander, Marcellus, Skaneateles, Pompey, and Tully are scattered as we get farther out from Syracuse. Moderate GOP towns like Elbridge and Lafayette make up the next group. Spafford is in the next group with a strong GOP lean. Finally, you have the dominant GOP towns of Otisco and Fabius in the dark red.
An analysis of the suburbs cannot be complete without a look at how third parties affect the towns. While Conservatives are small county wide, they are mostly existing outside the City of Syracuse. With the Working Families having such a small number, this means every town shifts a bit to the right. This represents about a 2-3% shift per town. This is most evidently in play in the borderline towns from the heat map. Cicero and Van Buren become slight right ward leaning instead of borderline. Camillus flips from a borderline Democratic town to a borderline right lean. Onondaga Geddes, and Clay get remarkably close to evenly registered towns when you take the conservative effect on their enrollment.
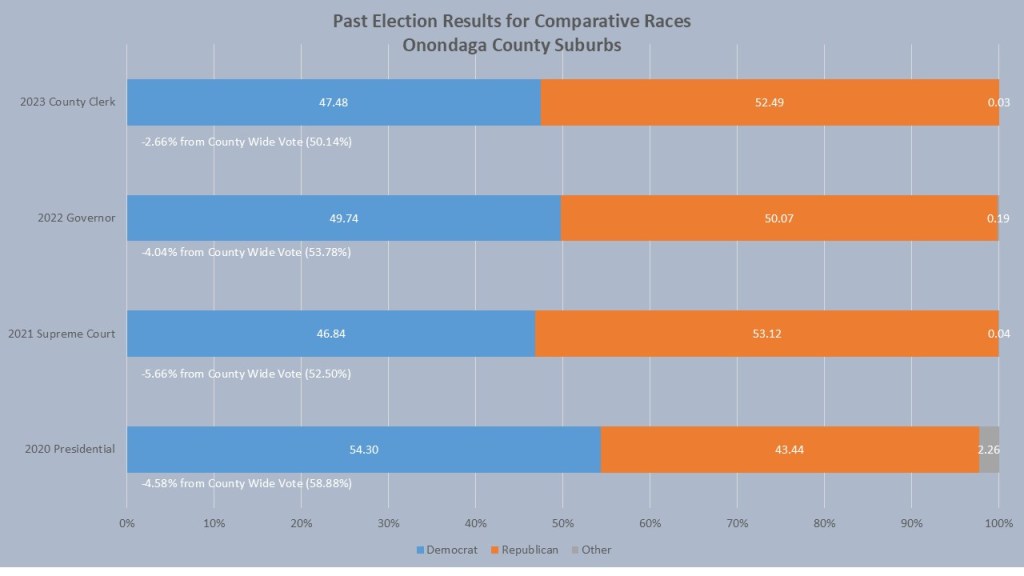
Finally, we look at the comparative races and how they perform in the suburbs vs. the county overall. In general, the suburbs react about 4-5% more republican than the county as a whole. In 2022 Governor Kathy Hochul lost the suburbs and was only able to get 4.974% of the suburban vote which is 4.04% less than her win in Onondaga County. In the 2021 Supreme Court race Anthony Brindisi only got 46.84% of the suburban vote, 5.66% less than his Onondaga County total. President Biden’s 2024 race was the only comparative race that won the suburbs with 54.30% of the vote but that still trailed his county wide total by 4.58%. Finally last year Emily Essi was one of the closest races in Onondaga County but bucked the trend in the suburbs somewhat. Though she lost the suburbs with just 47.48% but that was only 2.66% lower than her Onondaga County total.
That is, it for this edition of the #weeklywonk. Nest week we will continue to look at the political subdivisions in our county holding elections. We will investigate the city of Syracuse which not only has two City Court races this year, but it will also play a vital part in the Congressional and Family Court races this fall. As always you can subscribe to dustinczarny.com to get all my content and election news updates.
This week I sit down with Al Stirpe, longtime assemblyperson of the 127th Assembly District. he is running for re-election again this year to represent Clay, Cicero, Manlius and Cazenovia. We talk about some of the success in this year’s legislative session and unachieved goals to work toward in the future. Enjoy. Find out more about Al at https://alstirpe.org/
Subscribe to dustinczarny.com for all content and election news updates