
Welcome back to #WeeklyWonk. Each weekend I publish an article on a subject relating to elections in Onondaga County and New York State. Often these articles will have detailed stats to consume but sometimes they will be a recap of a prominent issue or on relevant election law. I am turning my eye to the 2023 elections. Today I look at the Town of Tully, a seemingly rural red town with surprising voting history.

The Town of Tully sits in the most direct south portion of our county. It is surrounded by Spafford to the west, Otisco and Lafayette to the north, and Fabius to the east. It is a smaller rural town with 2,075 voters, ranking 15th out of 19 towns at the upper end of the rural towns. The makeup of Tully is 28% Democrat (582 Voters), 37% GOP (771 Voters), and 28% non-enrolled (575 voters). The Town of Tully is broken up into 3 different election districts. Election District 1 comprises of the village of Tully and has 602 voters (29%). Election District 2 comprises of the Eastern half of the Town of Tully and has 787 voters (38%). Election District 3 is the western portion of the Town of Tully and has 686 voters (33%).

In a new feature I am bringing to the #weeklywonk this year I am doing a heat map for each political subdivision. I will be looking at the current partisan makeup of each individual ED and heat mapping its partisan lean based on the advantage for the Democrats and GOP. Looking at the heat map we really see that the Town of Tully is a solidly GOP town. ED 3 has a moderate GOP lean (-10-14%). ED 1 & 2 have slight GOP lean (-5-9%).

Since 2009 The Town of Tully has seen unusual changes for a rural town. The GOP has held steady only losing 18 voters since 2009. The Democrats gained 92 voters since 2009. The Non-Enrolled however has held steady gaining only 18 voters since 2009. Democrats have gained the most since 2009 but those gains are with in the 5-year Trump period (2016-2020). The pattern in Tully is unusual as unlike other areas the GOP and N/E have held basically steady. The Democrats before Trump were losing ground, gained dramatically in the Trump years, and have held steady since. It is a unique pattern unlike any of the other towns I have investigated.

All three election districts have a GOP lean. The village of Tully in ED 1 is the most favorable to Democrats with only a 5.98% lean to the GOP, however the Democrats outnumber the non-enrolled here. It is also worthy of note the last two mayors of Tully have been registered Democrats, though they run on non-partisan lines. Election District 3 is the second most favorable to Democrats. Here the partisan difference is less of just a 5.69% GOP lean, but the non-enrolled slightly outnumber the Democrats which is usually a sign of weakness for a major party. Election District 2 is the most GOP of all the election districts with a 14.49% GOP lean and the non-enrolled significantly outnumbering the Democrats.
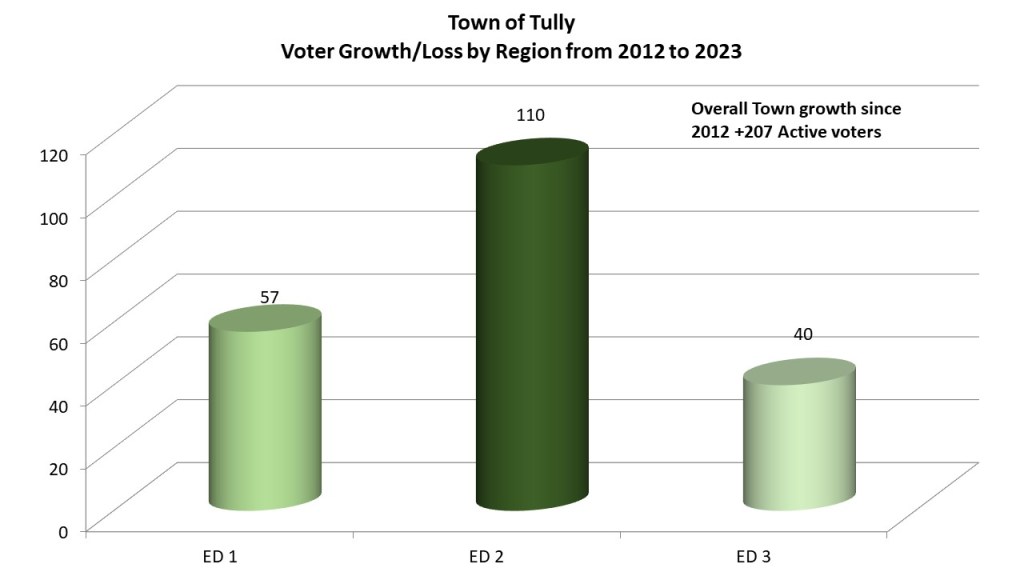
Looking at the growth of voters since the last redistricting cycle we compare it with date from right before redistricting of 2012, the Town of Tully grew by 207 active voters since 2012. The largest growth, by far is in Election District 2 gaining 110 voters. The village of Tully in election district 1 gained 57 voters. Election district 3 gained the least with just 40 voters.

Every election district in the Town of Tully has trended towards the Democrats since the last redistricting and the town itself grew more Democratic by 6.26%. The village of Tully, like most villages and urban centers, gained the most becoming 8.70% more Democratic since 2009. The rest of Tully grew at similar rates. Election District 2 grew more Democratic by 5.60%. Election district 3 grew more Democratic by 5.31%.
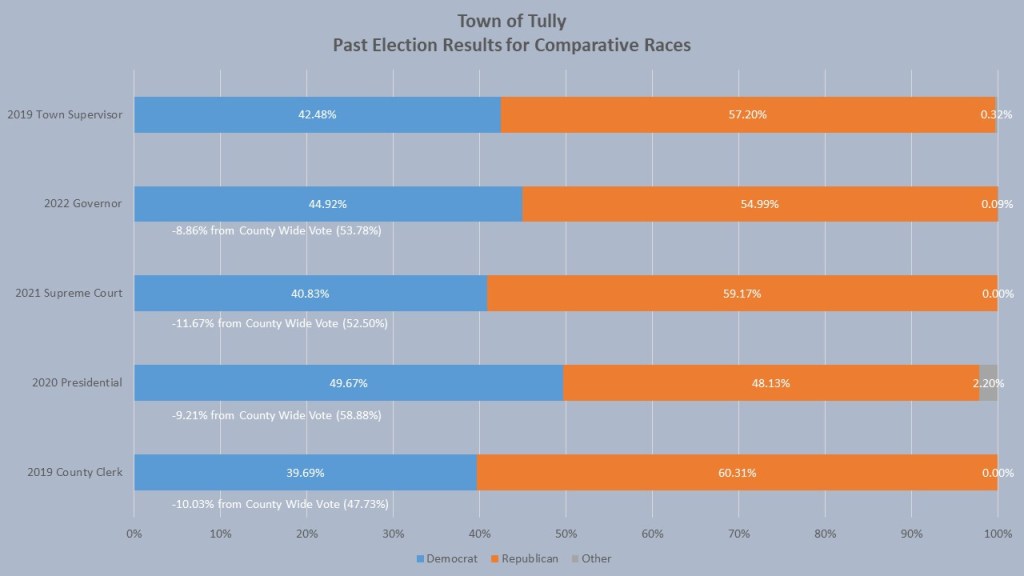
When we look at the comparative races, the Town of Tully, while voting almost solidly GOP, has some surprises. Tully registration is significantly more GOP than Onondaga County, but President Biden won the Town in 2020 by 1.54, though that was 9.21% worse than his county win total. The other comparative races, though won by the GOP, were favorable results when compared to other towns with similar GOP registration advantage. Governor Hochul only garnered 44.92% in Tully, 886% less than her county win total. In his supreme court race in 2021 Anthony Brindisi won 40.83%, 11.67% worse than his Onondaga County totals. In 2019 democrat Mark Kolinski running for Town Clerk faired the worst with just 39.69% of the voter, 10.03% off his Onondaga County total. In 2019 then mayor of Tully Melissa Flint-Morgan challenged Town Supervisor John Masters. Though she did not win, garnering only 4248% of the vote, she did better than the other comparative races in odd number years.
In 2023 the Town of Tully Democrats have already caucused. They only have one candidate running for town council, Carrie Edinger. If you are interested in helping these candidates or joining the Tully Democratic committee, contact their chairperson Elizabeth Weinstein at elizabethsweinstein@gmail.com.
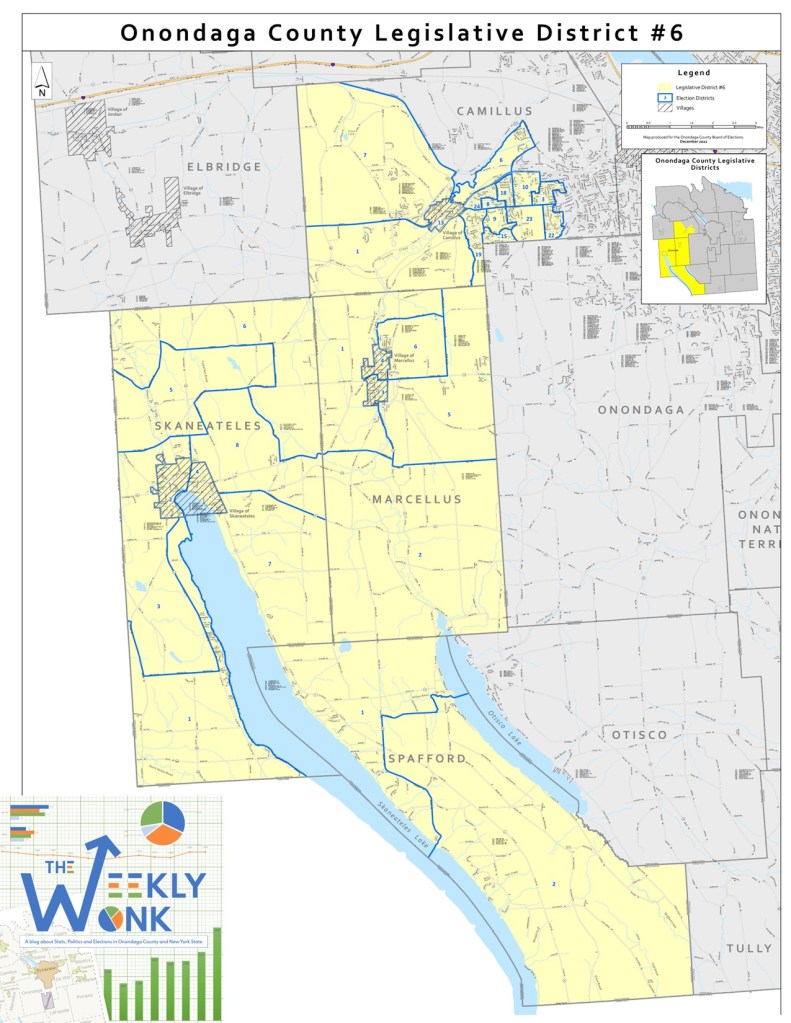
That is, it for this week’s edition of the #WeeklyWonk. I have finished my investigations into the Towns of Onondaga County. The towns of Elbridge, Fabius, Lafayette, and Otisco have no Democratic candidates this year so I will save their investigations for future years. Next week I will dive County Legislative seats in competition this year starting with OCL 6. As always go to dustinczarny.com and subscribe to get all your content and election news updates. I run that website, along with these series of articles, as part of my voter education. I never take ad money or charge subscriptions paying for the site with my own personal funds. Subscribe here.

