The machines used in Onondaga County will still require paper ballots, but it will allow for faster processing at the polls, according to the Elections Commissioner for Onondaga County, Dustin Czarny.
Czarny said these new county machines are a 20-year leap in technology, and they will be ready to use for voting in the fall.
This week I sit down with Justin Polly & Noelle Clarry Relles Candidates for for Town of Onondaga Town Board about their campaigns. They also talk about how the Town of Onondaga Democrats are trying to bring competition and diversity to this purple town. I also talk briefly about the indictments of former President Trump and the certification of New Equipment for the OCBOE.
Today starts New Machine Month at the Onondaga County Board of Elections. I talk today about the beginning of our hopeful change over to a new voting system, the path to certification of new voting systems at the NYS Board of Elections. Check in weekly for our progress.
Subscribe to dustinczarny.com for all content and Election News updates
Welcome back to the #WeeklyWonk. Each weekend I release an article on a subject relating to elections in Onondaga County and New York State. Often these articles will have detailed stats to consume but sometimes they will be a recap of a prominent issue or on relevant election law. I am turning my eye to the 2023 elections. This week I take a break from looking at the political subdivisions and focus on and look at Party Changes and New Voter Registration in Onondaga County for 2023.
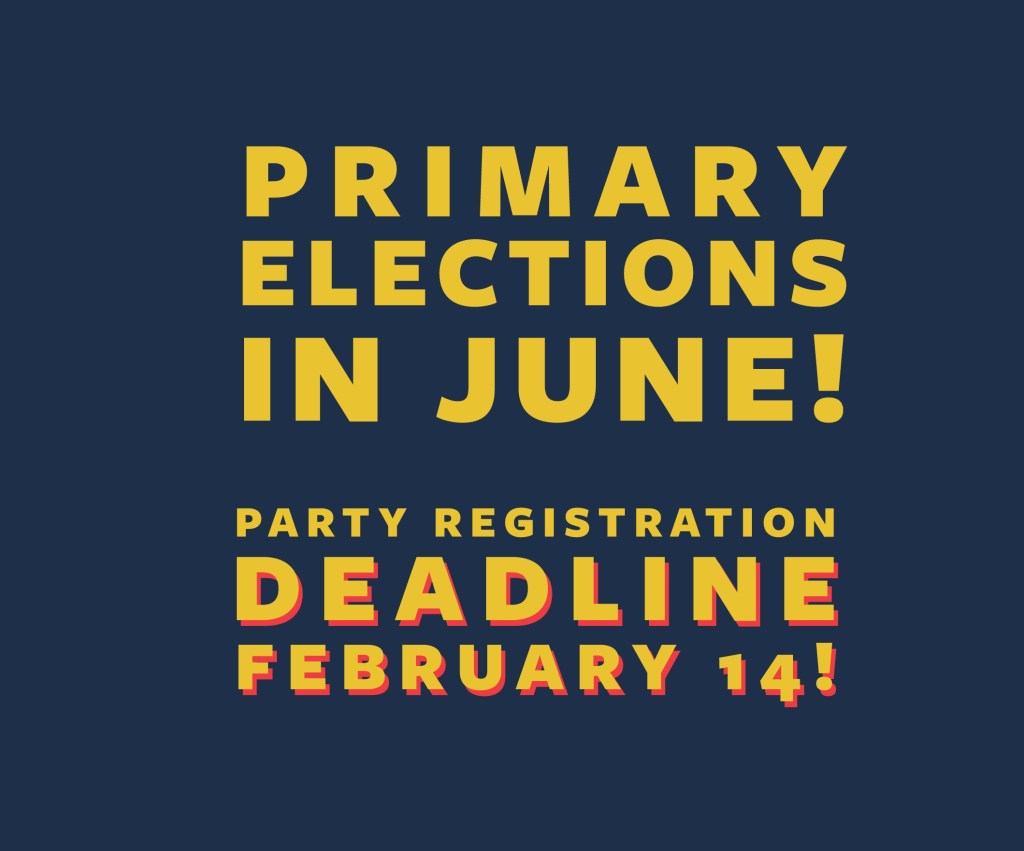
Each year New York has a freeze on party enrollment changes. For over 100 year that freeze started 25 days before the previous General Election and lasted until 7 days after the primary. The primary then was in September so that essentially meant an 11 month freeze in party changes. When the political calendar was changed in 2019 to move the primary to June that shortened the window by 3 months, however that was still one of the longest in the nation. In 2020 the Mew York State Legislature moved the party enrollment deadline to a single date each year, February 14th. Coincidentally that is Valentine’s Day, so I have named it Fall in Love with Your Party Day. These 4 months sequester now allows voters to switch their parties ahead of the June primary if they wish to vote in it. However, for those who don’t their party changes are held a virtual lock box until 7 days after the primary.
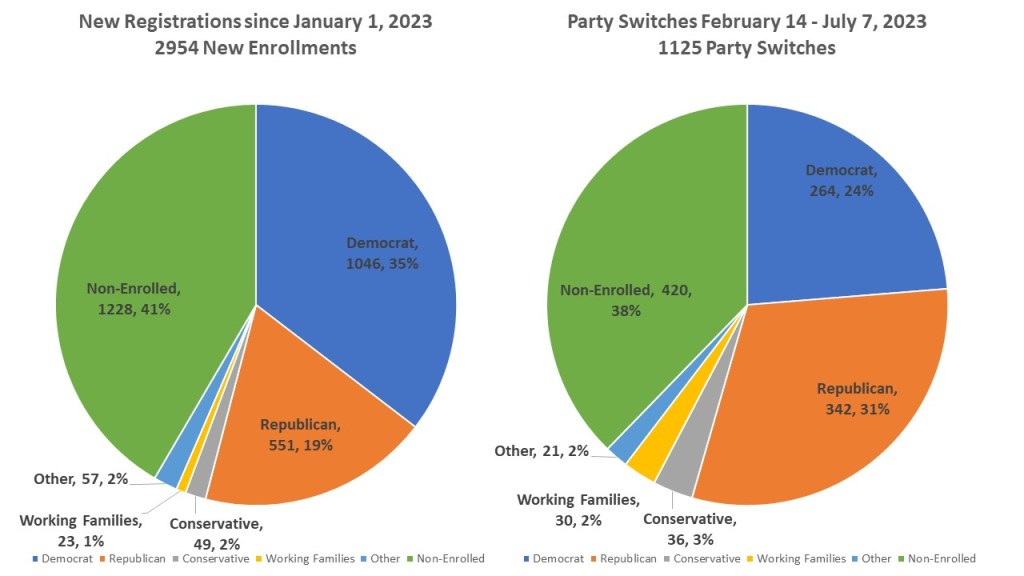
For the first time in my time as Commissioner we can now get date on newly enrolled voters and party changes thanks to our new registration system. The old system we had to compare before and after enrollment numbers that could not give out as accurate information as I would like. As of July 7th, we had 2954 New Enrollments in Onondaga County. Of those new enrollments 1228 (41%) chose not to enroll in any party, 1046 (35%) enrolled in the Democratic Party, 551 (19%) enrolled in the GOP, 57 (2%) enrolled in the other party category, 49 (2%) in the Conservative party and 23 (1%) in the Working Families Party. We had 1,125 Party switches between February 14th and July 7th, 2023. 420 (38%) chose not to enroll in a party, 342 (31%) enrolled as Republicans, 264 (24%) enrolled as Democrats, 36 (3%) enrolled as Conservatives, 30 (2%) enrolled as Working Families, and 21 (2%) in the other category. Clearly the Non-enrolled are continuing to gain ground in our county. Though the GOP had a small edge in party switches that is wiped out by the Democrats gain in newly enrolled voters.
While our system now allows us to track how newly enrolled voters in Onondaga County register, what it can’t tell us is if they are brand new enrolled voters or just new to Onondaga County. I decided to break down the newly enrolled by age groups. We can assume many of the younger voters 18-30 are new or first-time voters where the older groups are likely transfers from other parts of the country. No matter the age group the pattern is clear. Non-Enrolled voters is the biggest growing segment among newly registered voters in Onondaga County. Democrats are also gaining nearly 2 to 1 over the GOP in each category as well. The only exception is the 65+ group. Here Democrats outnumber both N/E and GOP, but the differences are smaller.
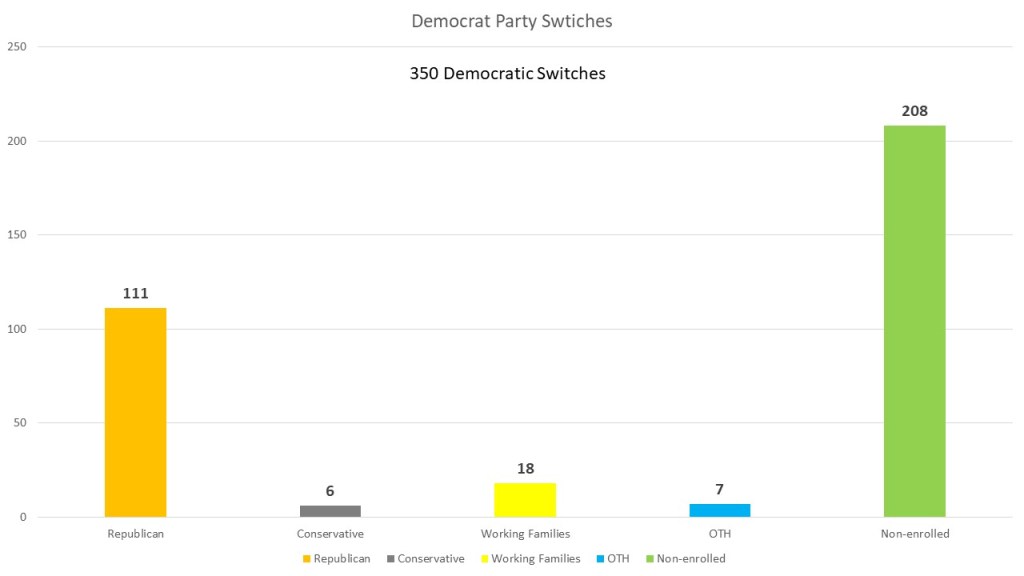
350 people chose to leave the Democratic Party. Of those that left 208 chose not to be enrolled in any party. 111 Switched to the Republican Party, 18 to the Working Family Party, 7 enrolled in the other party category, 6 enrolled in the Conservative Party. Once again, the non-enrolled dominates this category as more voters are choosing not to be part of a party.
209 people switched from the GOP. While less in number that the Democrats, there are significantly less GOP in the county. Once again, the largest number of former GOP, 131, decided to unenroll from any party. 58 decided to switch parties to the Democrats, 18 switched to conservative party, and 1 to Other, and 1 to Working Families. As a percentage 27% switched to the Democrats while 31% switched from Democrat to GOP.
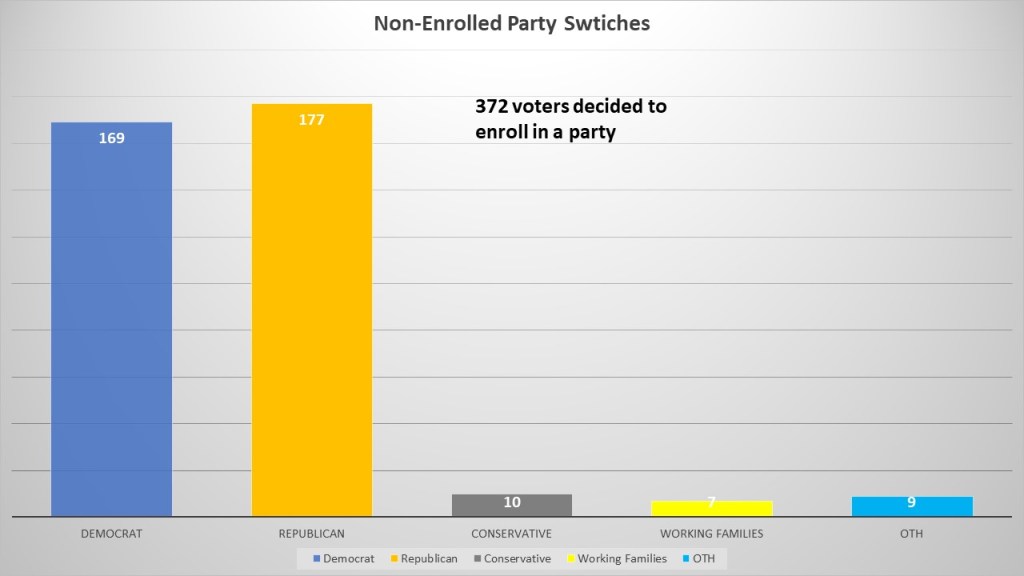
The largest party switch though was non-enrolled deciding to enroll in a party. New York is a closed primary state so often those not enrolled in a party will choose to enroll in a party to take part in the primaries. 177 decided to enroll in the GOP and 169 enrolled as Democrats. Only 28 decided to enroll in other parties (10 Conservative, 7 Working Families, and 9 Others). It seems during this party change period the non-enrolled broke evenly between the GOP and Democratic party.
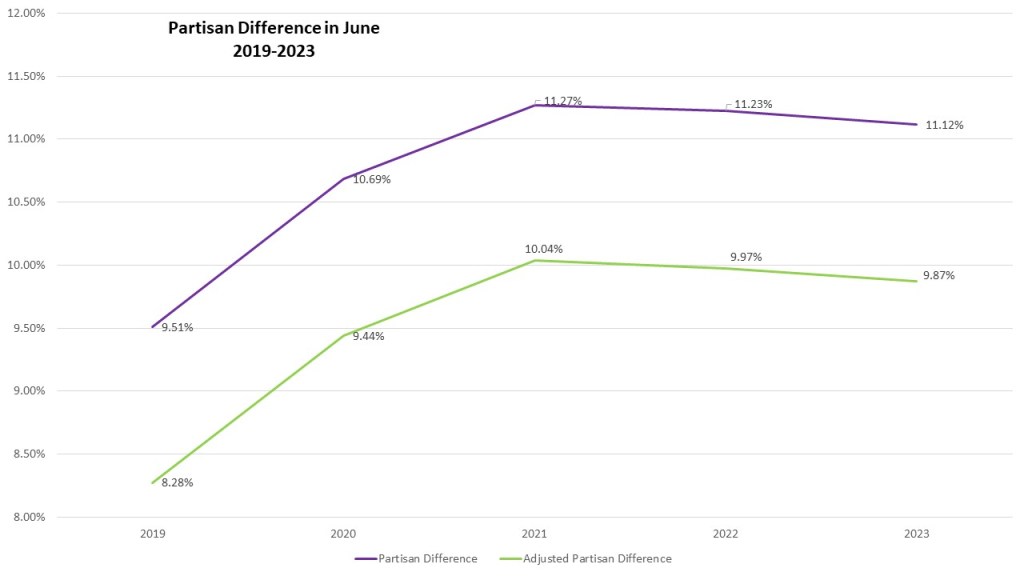
The June primary was established in 2019 so we only have data for where Onondaga County stood in June going back to them. Still, we are seeing more evidence of a leveling off in partisan advantage for the Democrats. During the Trump years the October registration levels showed significant increases for the Democrats, until 2022. We are seeing that in the June registration numbers The Partisan difference (Democrats vs Republican percentage) as well and Adjusted Partisan Difference (Democrats & WFO vs Republican & Conservatives) grew significantly in 2019 and 2020. However, in 2021, 2022, and 2023 we saw a levelling off. Trump being out of the Whitehouse is one of the reasons for this.
However, another reason for the slowing of and tepid decrease in Democratic partisan advantage is the rise of the percentage of the Electorate that is non-enrolled is taking up in the total population of Onondaga County voters. The Non-enrolled grew from 25.74% of the electorate to 28.19% since 2019, +2.45%. Democrats have remained steady during this time, gaining in 2019 and 2022 but slightly failing since then for a +0.16% gain. Republicans have still steadily lost ground, losing 1.46% since 2019.
This is my final look back at data stemming from the June primary. I will now start to refocus my #WeeklyWonks on the remaining Political subdivisions having contests in this fall’s election. I will restart my town series looking at the Town of Geddes. Comeback each week to look at the data that makes up our home in Onondaga County. Remember to subscribe to dustinczarny.com for all election news and content updates.
This week I sit down with the Town of Manlius Democratic Town slate. We talk about what its like to flip a red town to blue, and hold it. Give them a follow here:
I talked about my trip last week to represent New York in the local leadership council for the Elections Assistance Commission. It was a good trip with a lot of learning from the brightest election minds in the United States as well as the history of the EAC and the many ways they help voters throughout the United States.
Welcome back to #WeeklyWonk. Each weekend I publish an article on a subject relating to elections in Onondaga County and New York State. Often these articles will have detailed stats to consume but sometimes they will be a recap of a prominent issue or on relevant election law. I am turning my eye to the 2023 elections. This week I take a break from looking at the political subdivisions and focus on breaking down the 2023 Primary Election. This is the second in a two-part series focusing on all aspects of the 2023 primary. This week we finish with Election Day & Affidavit voting as well as Overall Turnout.
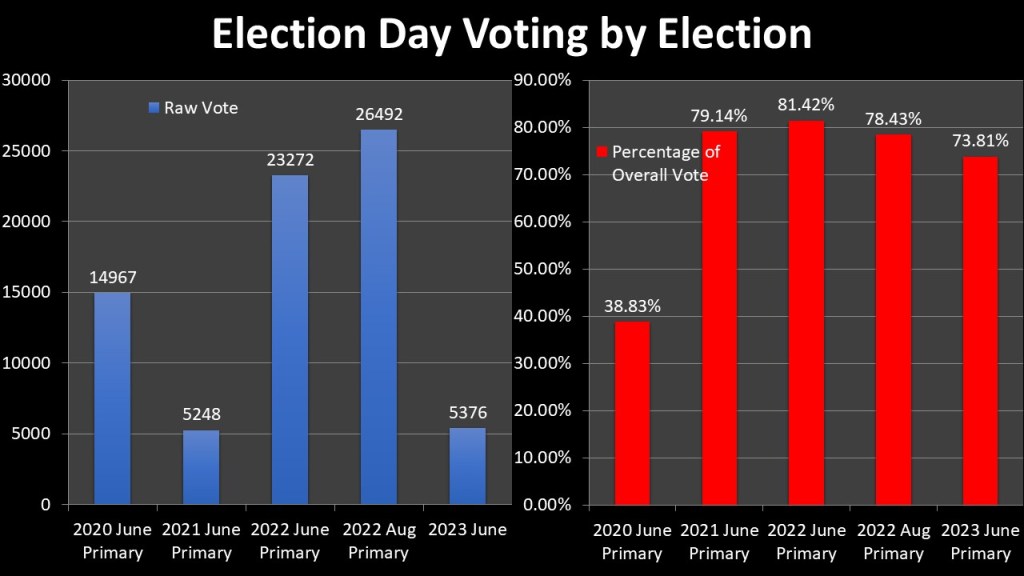
In Person Election Day voting remains the most popular form of voting. 5,376 voters (74%) voters chose to vote In-person on Election Day. 1,113 (15%) Early Voters followed this, 724 (10&) Absentee voters, 69 Affidavit voters (1%), and a single court order voter. Of the voters who voted on Election Day 3,977 (74%) were Democrat. 932 Republican (17%), and 467 (9%) Conservative. The seeming domination of Democrats on Election Day is a bit of a mirage. Because we are analyzing a primary, we must recognize the fact that Democrats had far more voters eligible for this primary than the GOP. Thus, the raw total was always going to be skewed to the Democrats.
As noted, the 2023 June Primary had a limited scope with only Democrat. n Syracuse, Republicans in Pompey and Salina, and Conservatives county wide. This results in a small number of voters (5376) showing up on Election Day when compared to the County Wide primaries of 2020 and two primaries in 2022. However, it is similar to the 2021 June Primary which had a similar number of eligible voters. We are seeing though an interesting pattern in Election. voting as a percentage of the overall primary vote. The 2020 Pandemic primary forced many voters to Absentee. Early Voting showing the smallest amount of Election Day votes. It seemed as if Election Day was going to make a major com. ck with 2021 and 2022 June primaries. However, with the August 2022 primary and 2023 primary we have seen a steady decline in percentage of voters waiting for Election Day and we could see this being a slow steady pattern over time.
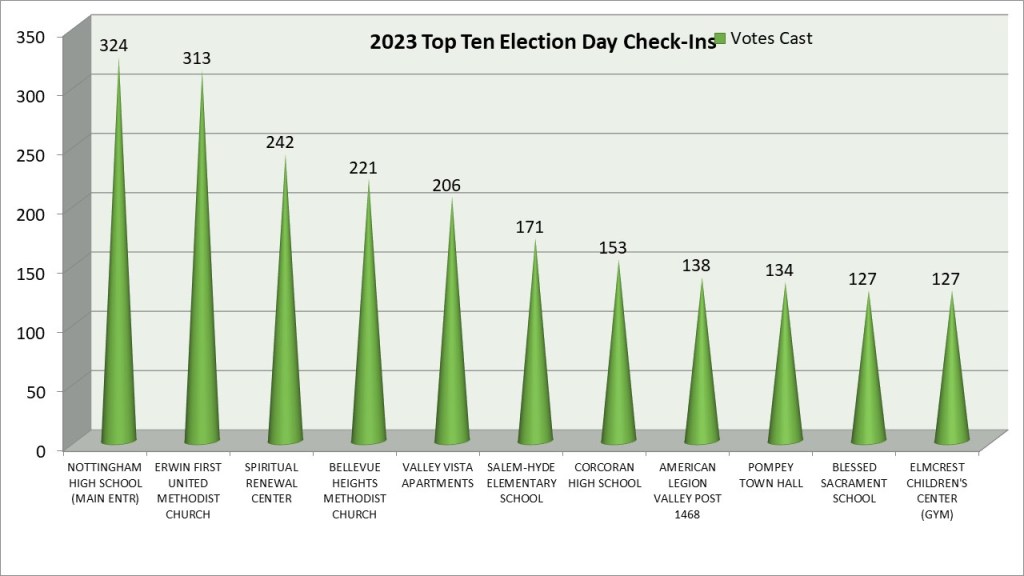
When we look at the ten top polling places for Election Day an interesting pattern emerges. We actually have eleven polling places here as there is a tie for tenth place. Of the eleven top polling places seven of them (Nottingham, Erwin, Spiritual, Bellevue, Valley Vista, Corcoran, & American Legion) were located in the OCL 15th district lines. This primary showed a larger than average turnout. Salem Hyde and Blessed Sacrament are larger polling sites and Pompey Town Hall was part of the Pompey GOP primary. It is also noted the top three polling places (Nottingham, Erwin, Spiritual) are part of the east side 17th Ward/University area where a large number of Democrats live and are activated by the Democratic Primary there.
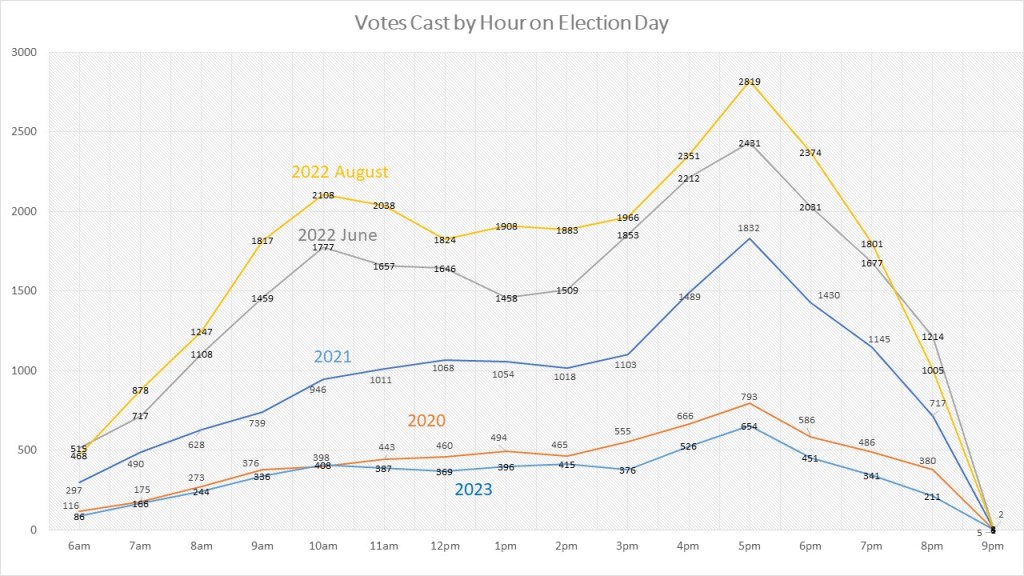
This graph shows the voter check-ins by hour. Before 2020 we could not capture this data as the image cast voting machines only tracked totals by day, not hour. Our Knowink Poll Pads tracks the times of voter check-ins, so we get a decent feel for how voters ebb and flow throughout the day. All five primaries we have been able to track show a similar pattern regardless of turnout. Voters tend to increase in rate per hour until 10am. Then turnout tends to level off until 4pm. We see the biggest hours in 4-6pm as voters get out of work and vote on their way home. We then see a steep decline in the last few hours of voting until the close of polls.
Another form of voting is Affidavit voting. This is when voters show up at the polls and either do not show up in the poll book or have incorrect information such as an address that is not updated. One of the major election myths out there is that affidavit ballots are routinely thrown out. New York has done an excellent job of loosening technical violations that threw out previous ballots. In fact, 78.4% of all absentee ballots in 2023 Primary were valid and counted. Democrats took the most advantage of this with sixty-seven using this method, 5 GOP, three conservatives, eleven non-enrolled voters, and two voters enrolled in the other category. You may ask how voters not enrolled or in other parties participated in the primary, and the short answer is, they did not. The overwhelming reason for an affidavit ballot to be denied is that they were not enrolled in a party or enrolled in the wrong party for the ballot they requested with fourteen voters being disqualified because of that. Another three voters were not registered at all. And two voters returned an absentee ballot to the Board of Elections and thus we counted the absentee and not the affidavit.
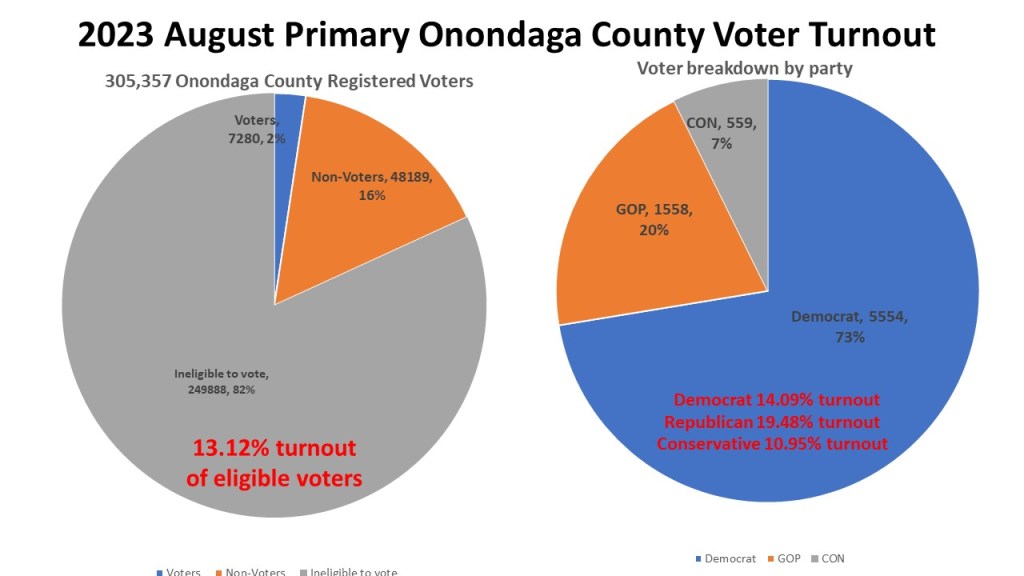
As we start to look at the overall turnout, we really see just how small in scope this primary was. Onondaga County had 305,357 registered voters going into the June 2023 primary. 249,888 (82%) voters were not eligible by geography or party to vote in the primary. Another 48,189 (16%) voters were eligible but did not come out to vote. Just 7,280 (2%) of voters in Onondaga County participated in the June primary. Of those who participated Democrats had 555f (73%) voters made up the voter population. 558 (20%) were from the GOP. 559 (7%) were Conservative. When we look at turnout as a percentage of eligible voters, we saw a final turnout % of 13.12%. Democrats had 14.09% turnout, Republicans 19.48%, and Conservatives were the drag of the election with just 10.95% turnout.
When we look at primary elections going back to 2009, we see that Democrats not only have more primaries, but they are usually larger than the GOP in raw turnout. We have had nineteen primaries since 2009 with only one year, 2011, with no primary from a major party. 2 years there was only a GOP primary, 8 years there was a GOP and Dem Primary, and eight had just a Democratic primary. However, the last five primaries we have seen that there Are Democratic and GOP contests indicating more of a willingness of GOP candidates to challenge their party nominees. When it comes to turnout in a primary another pattern seems to be emerging. Early on the normal GOP advantage in turnout percentage was also represented in primaries. From 2013 2021 it was rare that the GOP had a primary and their turnout was usually lower than Democrats. However, in the last three primaries GOP turnout in primaries has tied or surpassed Democratic turnout in primaries.
Finally, we also can look at turnout in terms of regions. The normal thought on turnout in regions is that the City of Syracuse lags behind the suburbs. However, in primaries, when the primary may be the only election that matters, the City of Syracuse has often surpassed the suburbs ibn turnout, until recently. Of the nineteen primaries since 2009, 5 primaries were solely inside the City of Syracuse. Of the remaining fourteen the City of Syracuse beat the suburbs in eight of these elections. However, the last three primaries saw a correlation with the declining Democratic turnout in primaries with the decline in City turnout in primaries as Syracuse has trailed the suburbs in turnout.
That is, it the last part of my look back at the 2023 June Primary. Next week we will look at the Party Changes and New Voter Registration happening in Onondaga County. In the coming weeks, I will return to the analysis of political subdivisions having elections in 2023. Remember to subscribe to dustinczarny.com for all election news and content updates.
This week I sit down with Carrie Wood who is running for Onondaga County Legislature 10th district. We talk about what its like to be a first time candidate in what is historically one of the most competitive districts in the county. We also talk aquarium, transparency, and her vision for her district. Enjoy.
Subscribe to dustinczarny.com for content and election news updates
The U.S. Election Assistance Commission (EAC) is an independent, bipartisan commission whose mission is to help election officials improve the administration of elections and help Americans participate in the voting process. The Local Leadership Council was established by the EAC in June 2021. This new FACA board is made up of 100 local election officials who are current or former officers in each state’s local election official association. This is the first in-person meeting of this advisory board as previous meetings were virtual.
While in the Nation’s Capital Commissioner Czarny will participate in elections for EAC Local Leadership Council leadership and bylaws as well as discussions on how to make the LLC an effective advisory board. He will attend the EAC Data Summit as well as the LLC meetings on Thursday and Friday. At the LLC meeting he will participate in sessions looking ahead to 2024 challenges, training and workforce development, election technology, and other breakout sessions.
“I am honored to be able to represent New York State on this new advisory board. I look forward to working with bi-partisan representatives from across the country to improve elections for election officials and voters. I commend the U.S. Election Assistance Commission for creating this new advisory board and leading the way in bringing us all together this summer.” – Dustin M. Czarny Chair, NYS Elections Commissioner Association Democratic Caucus and Elections Commissioner (D) Onondaga County
Commissioner Czarny will have limited availability for phone and zoom interviews while on this trip however will return to Syracuse on Monday July 24th. Media inquiries can be emailed to dustinczarny@gmail.com or 315-383-4318.
Welcome back to the #WeeklyWonk. Each weekend I release an article on a subject relating to elections in Onondaga County and New York State. Often these articles will have detailed stats to consume but sometimes they will be a recap of a prominent issue or on relevant election law. I am turning my eye to the 2023 elections. This week I take a break from looking at the political subdivisions and focus on breaking down the 2023 Primary Election This is the first of a two-part series focusing on all aspects of the 2023 primary. This week we will focus on Early and Absentee voting and next Election Day and Overall Turnout.
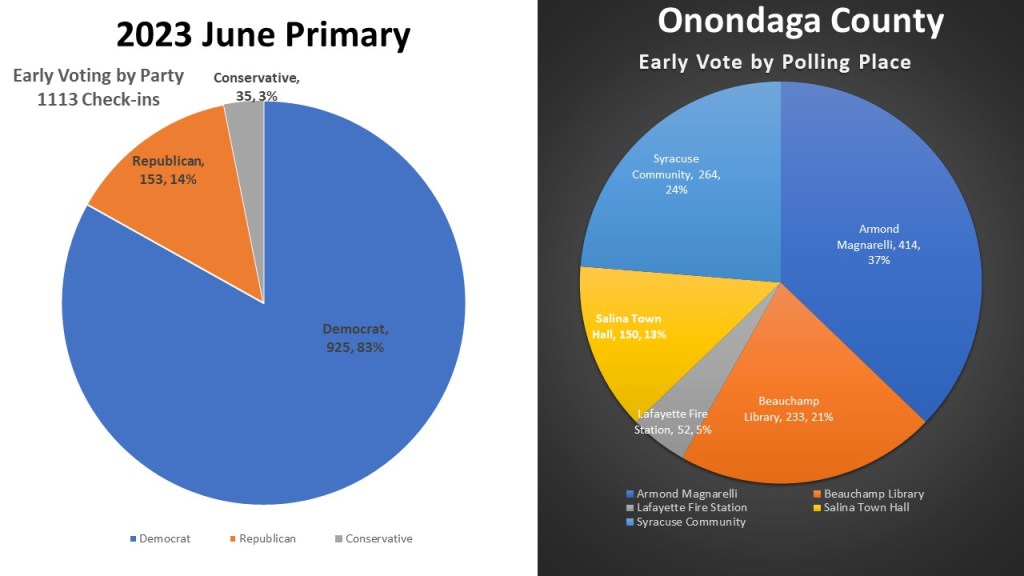
The June 2023 primary was smaller in scale than most primaries. Only Democrats in the City of Syracuse, Republicans in the Towns of Pompey and Salina, and Conservatives County wide. 1,113 Voters checked in to vote Early in the 2023 primary. 925 Democrats, 153 Republicans, and 35 Conservatives showed up to the five open Early Voting sites. Since the primary was smaller in scope both in number of voters and geographic locations. The three locations in the City led all Early Voting with 414 voters going to Armond Magnarelli Center (37%), 264 at Syracuse Community Connections (24%), and 233 at Beauchamp Library (21%) The suburban sites did not do as well with Salina Town hall chosen for proximity to the GOP primary there having 150 voters (11%) and Lafayette Fire station just next door to the Town of Primary at 52 voters (5%).
Diving into Early Voting by site we can compare how the sites do over time. As noted above Salina Town Hall appears as a site for the first time. It essentially took the place of Lysander Town Hall as the Northwest suburban EV site, so their figures are listed there. Traditional EV sites Clay Town Hall and Dewitt Town Hall were not opened for this action as newer sites like OCC Mulroy Hall and North Syracuse Community Center were closed as well. The difference in the 2021 primary and 2023 is the three City sites spread the small voter load out more equally. Even so the Armond Magnarelli center leads city sites in every Primary election we have had.
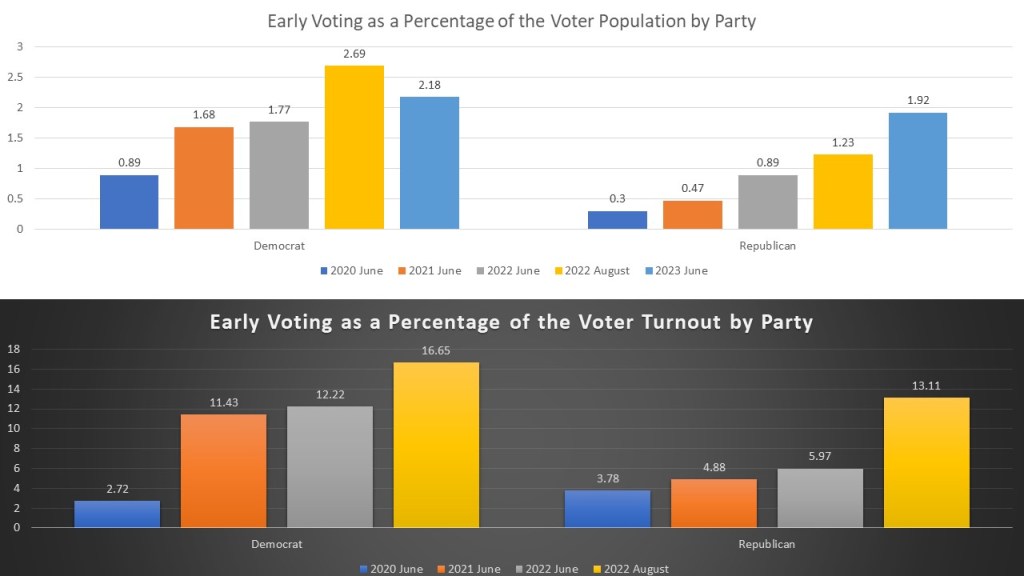
When looking at Early Voting it is important to now just look at the raw numbers but compare it to similar elections. We have now had five primary elections with Early Voting and 2023 1113 voters is bigger than the similar primary in 2021, though the 2023 primary was the least populous in terms of eligible voters. However, when you look at the percentage of the voting population Early Voting continues to grow. In 2023 15.29% of voters chose to vote early, this is the highest percentage in any primary so far. In fact, each year more of the overall turnout has been represented in the Early Voting numbers regardless of scale and scope of the primary.
One of the reasons why Early Voting is growing as a share of the population is that we are seeing more adoption of Early Voting by the GOP as opposed to just Democrats. The GOP performed better than Democrats when looking at overall voter population eligible for this election. Democrats saw a fall in participation at 2.18% of the eligible population Early Voting, down from 2.69& in the august primary last year. The GOP was just 1.92% of their voting population, which represents a rise from last year and previous years. In fact, when you look at the percentage of the turnout Democrats did have the larger percentage of the voters who chose to turnout show up at 16.65% Early Vote. However, the GOP came closer than ever to matching the Democratic voter share with 13.11% of their voters choosing to Early Vote.
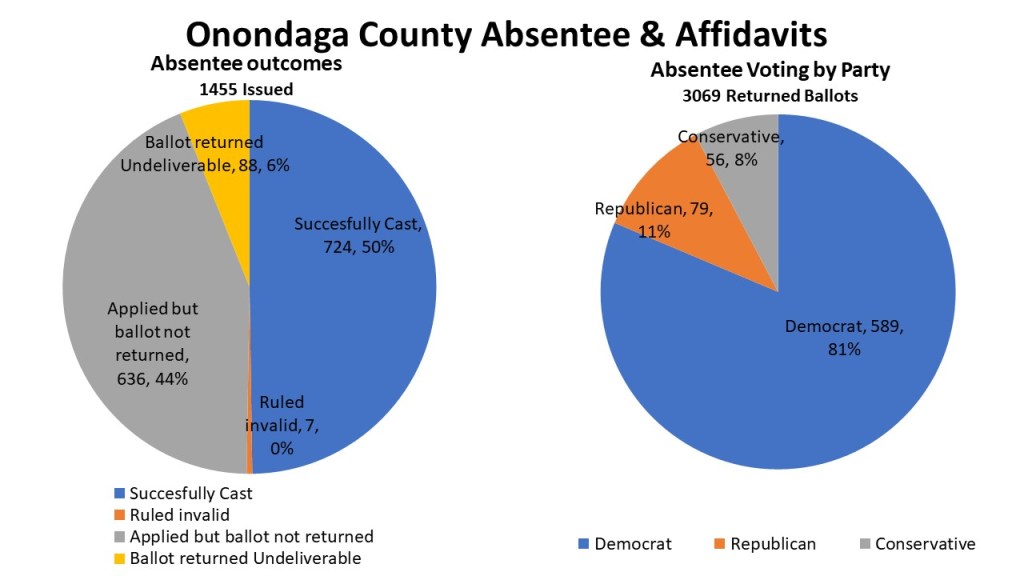
The other form of pre-Election Day voting is Absentee. 2023 is the first year since 2019 where the pandemic excuse for absentees is not in effect. We only issued 1455 absentee ballots in 2023724 ballots (50%) were accepted and counted, 637 ballots (44%) were unreturned, 88 (3%) Ballots were returned undeliverable by the US Mail, and just 7 ballots returned (<1%) were rejected. Democrats dominated the absentee ballot returns with 589 ballots back (81%), Republican s returned 79 (11%), and Conservatives 56 (8%).
Absentee ballot usage for this primary in terms of actual applications received and ballots returned was one of the least in recent history. The 1455 absentee ballots issued is second least to 2019. The same is true for the ballots returned. However, when looking at percentage of actual votes at 9.95% is comparable to what the primaries were in 2022. With the pandemic easing voter’s reliance on absentees has dropped, however it is still well above the pre pandemic years of 2017-2019.
That is, it the first part of my look back at the 2023 June Primary. Next week we will look at the Election Day, Affidavit voting and overall turnouts for the June Primary. In coming weeks, I will return to the analysis of political subdivisions having elections in 2023. Remember to subscribe to dustinczarny.com for all election news and content updates.