In this week’s episode I try to honor Martin Luther King Jr. and reflect on his role as a voting rights champion. I collected a few of my favorite quotes of his and talk about his work in Selma and the Voting Rights Act of 1965. I think his story of peaceful non violent but confrontational protest is something we can look to today in this tumultuous time. Enjoy.
Every year the Democratic Caucus of the NYS Election Commissioners Association identify a list of legislative and budget priorities to present to our legislative and executive leaders in New York to continuously improve voter experience and election administration. We denote the current bill numbers, legislative status, and whether this is a shared goal of the GOP caucus of NYSECA or the NYS Board of Elections.
Give Boards of Elections the ability to properly serve the voters of New York.
Four-year terms for all boards of elections commissioners. (S2050/A7289) (Bi-partisan support)PASSED SENATE
Minimum staffing requirements set based on voter enrollment for full-time permanent employees for each Board of Election. (S843/A6069)
Require all Commissioners in New York outside of the City of New York to be full time commissioners (S1087/A5056)
Support Mandatory Training and certification for Commissioner and Deputies. (S1035/A1228) (Bi-partisan support) (NYSBOE support)PASSED SENATE
Mandate County nominations for Commissioners occur no later than the party reorganization meeting or October 15th in years where a reorganization meeting does not occur.(Bi-partisan support)
Since 2019, long awaited election reform has changed local Boards of Elections’ responsibilities without making the structural changes needed for accurate implementation that meets the needs of our voters. These proposals will give County Commissioners the ability to strategically plan and bring year-round, full-time management to the Board of Elections in every county. We also support required training and certification for all Election Commissioners and deputies to ensure professional operations of each Board of Elections. We must also ensure proper transitions when new Commissioners are elected, so we are advocating for limiting late calendar nominations that can cause chaos with respect to the political calendar.
Invest in our election system by providing the following funding streams in the New York State Budget.
Aid to localities funding of $35 million for distribution to County Board of Elections of unbudgeted expenses.(Bi-partisan support)
Properly fund the New York State Board of Elections and give the NYSBOE proper authority to promulgate regulations and enforce responsibilities outlined in state law. (NYSBOE support) (Bi-partisan support)
The cost of running elections is mainly the responsibility of county governments. With the added responsibilities that the NYS Legislature has required of Boards of Elections, our staffing needs and equipment purchases continue to rise significantly. Each county has different needs; therefore, we are asking for a annual, dedicated Aid to Localities funding stream, replacing the various postage, equipment, and staffing grants. This is the best way for New York to meet its obligation to help county boards properly operate. We also support the NYS Board of Elections in their budget request to meet the increased regulatory and functionality services they are required to provide.
Provide flexibility for County Board of Election operations.
Allow for flexibility for designating non-enrolled inspectors to serve as Republican or Democratic inspectors. (Bi-partisan support)
Grant county Election Commissioners independence and flexibility with respect to determining hours of operation. (Bi-partisan support)
Altering the highest municipality early voting law to lower the highest city threshold to at least 10,000 voters. (Bi-partisan support)
County Board of Elections need flexibility to meet the modern needs of the electorate. Each individual county has different needs. Allowing the county boards flexibility in designating election inspectors can help in rural and urban communities. Boards of Elections often need to operate at different hours than their county hosts. They also need flexibility in selecting Early Voting sites that are more suitable for their counties.
Reform the Automatic Hand Count to work more efficiently.
Reduce the threshold for triggering recounts in close elections to .25% and allow for alternative scan within the .25-50% range, while also reducing the minimum vote threshold to ten. (Bi-partisan support) (S3290/A1091)
Exempt all party position contests from the manual hand count including judicial delegate and county committee contests. (NYSBOE support) (Bi-partisan support)
Allow candidates with less votes to opt out of a hand count. (Bi-partisan support)
The automatic hand-count has been in place for several election cycles. We have learned that the precinct scanners are accurate. Lowering the threshold for the hand-count will allow the Board of Elections to only focus on the truly close races that have a chance of changing hands. We must also stipulate that the hand-count should only start after initial certification allowing boards to properly prepare and sort ballots for counting. We should exempt party positions from the hand count rule as these elections are routinely close but not close enough to switch winners and draw resources away from publicly held offices. Finally, we can also give candidates with lesser votes the options to bypass the hand count if they don’t wish to participate.
Enhance our Ballot Access laws to provide protections for parties and to give access to candidates.
Extend the General Election Post Primary drop off date until after the certification of the June Primary or last day to caucus for town races. (Bi-partisan support)
Protect Town Caucus from party raiding by requiring party authorization for candidates not enrolled in a party to receive designation.
Allow county parties to have direct ballot access with their nomination process outside of NYC (Bi-partisan support) (S7401/A583)
Encourage legislation denoting that all public offices within the state of New York be referred to in gender neutral terms on Primary and General election ballots. (Bi-partisan support)
Our ballot access laws need modern protections and adjustments to ensure competitive and free elections. Over the last few cycles, we have seen an increase in those wanting to exploit weaknesses in ballot access functions in order to steal party lines, aka party raiding. We urge the legislature to close these loopholes by extending the party change deadline until after the last day to caucus and to protect caucuses from party raiding in the same way we do other ballot access methods. As petitioning has been scheduled to start earlier throughout the years, we urge the legislature to give county parties the ability to have direct ballot access in the same way state parties have. Lastly, we encourage the passage legislation to refer to all elected offices in New York using gender neutral terms.
Enhance and invest in our Vote by Mail options
Design a uniform paper and online application and oath envelope for all Vote by Mail options in New York including military and overseas voters.
Allow County Board of Elections the option to continue to scan vote by mail ballots during the Early Voting Period (Bi-partisan support)
Authorize the issuing of same-day absentee ballots in those instances when commissioners agree that health-related exigencies on or immediately prior to Election Day create hardship. (A5043) (Bi-partisan support) (NYSBOE support)
One of the fastest growing methods of voting in New York is vote by mail. We should build upon this success. Voters should be presented with a uniform application for both Absentee and Vote by Mail so voters can [properly choose the method right for them. We also want county Board of Elections to have an option to scan vote by mail ballots during the Early Voting period if the Board of elections has the resources to do so. Finally, we would like the ability for Elections Commissioners to issue emergency same-day absentee ballots for health-related emergencies on election Day.
Emphasize the importance of Election Day on the State and National Level
Designation of Election Day as a non-attendance day for public school students. (Bi-partisan support) (A2041/S9552) (NYSBOE support) (Bi-partisan support)
Support a Federal Holiday on Election Day (Bi-partisan support)
New York State and the Federal Government have the ability to place an importance on Election Day and should do so. Mandating a non-student attendance day throughout New York will not only ensure the availability of public buildings that are HAVA compliant poll sites, but also alleviate student safety concerns. A federal holiday will go even further, freeing up public workers for use as inspectors as well as giving voters the freedom to take part in our Democracy.
Strengthen our Boards of Elections and our Democracy by enacting these reforms
Support of the Democracy During Detention Act.(S440/A2121)
Allow for Vote Centers on Election Day as well as Early Voting on a permissive basis. (Bi-partisan support) (S569/A6449) PASSED SENATE
All Election Inspectors should be paid at least minimum wage for hours worked throughout New York State.
Allow elected officials to act as Election Inspectors upon bi-partisan agreement of the Board of Elections Commissioners(Bi-partisan support)
Repeal sections of 4-118, 4-119, 4-120 and 4-122 election law eliminating the requirement to publish legal ads prior to each election(Bi-partisan support)
In favor of proposing a statewide comprehensive voter registration and election management system with input from counties and stakeholders funded by New York State.(Bi-partisan support)
These reforms will allow Boards of Elections to operate more efficiently and focus on serving the voters. Bringing Democracy to all citizens through the Democracy During Detention Act is an important next step in the reforms we have embarked on in New York since 2019. Allowing vote centers on Election Day as we do for Early Voting is convenient for voters, leading to increased participation. Establishing a minimum wage for inspectors will help with recruitment and workforce development, which has been an ongoing struggle for every county in NYS. Giving the Boards flexibility to allow public officials to serve as inspectors when needed can help fill gaps. Repealing outdated publishing laws will save money while reducing workloads at County boards. Finally, a state-wide voter registration system paid for by NYS will save county dollars and provide an additional resource to County Boards to ensure their voter rolls are as accurate as possible.
The Democratic caucus of NYS Elections Commissioners stand ready to assist any legislator willing to take up one of our priorities that does not yet have a bill number. We also encourage legislators to co-sponsor the bills we have included in our priorities as well. If you have any questions or wish to meet on any of these proposals, please reach out to our Caucus Chair, Dustin Czarny, at dustinczarny@gmail.com or 315-383-4318.
(Bi-partisan support) Indicates a common goal with the NYS Elections Commissioner Association Overall Legislative Agenda as Approved by bi-partisan Elections Commissioners in January 2026.
(NYSBOE support) Indicates a common goal with the NYS Board of Elections as part of their Election law proposals.
It is time for another edition of the #weeklywonk. This is my weekly look at electoral and registration data in Onondaga County and New York. I am currently in the middle of a four-part series taking an overall look at our home Onondaga County heading into 2026. Part 1 Onondaga County Overall and Part 2 Onondaga County Suburbs can be found here (https://dustinczarny.com/weekly-wonk/) as well as all my now weekly episodes. This week I bring you part 3 in this series with a focus on the City of Syracuse which will elect an at-large member of the Common Council in 2026.
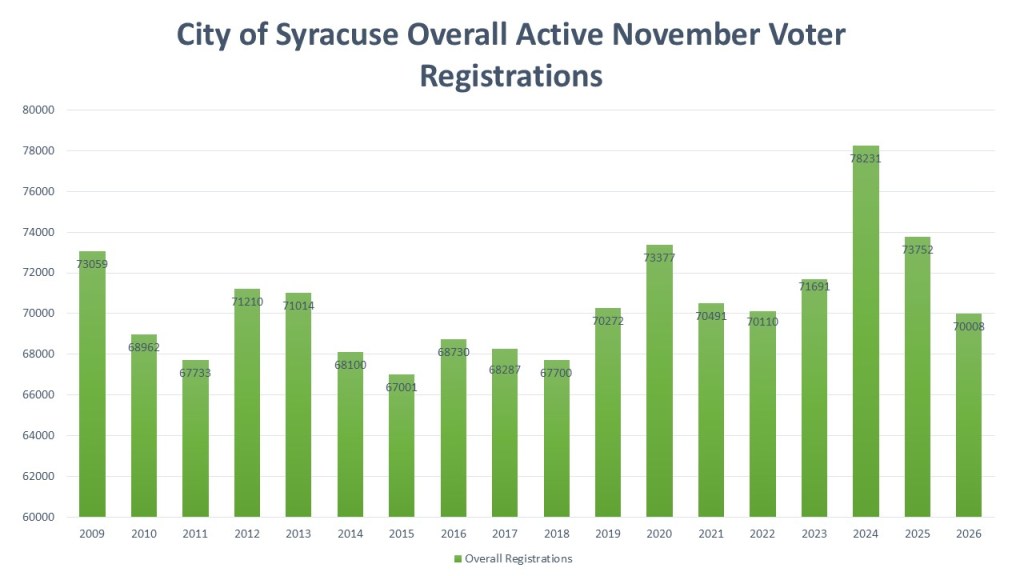
Unlike the county, the City of Syracuse voter population has remained stagnant. The Onondaga County Board of Elections only has enrollment data readily available going back to 2009. If we compare 2009 to 2025, which are both November collections in the year after the Presidential election, the difference is Syracuse has only grown by 693 voters. The city of Syracuse has behaved the same, large gains in a Presidential election, then large drop offs in between. The reason for that is obvious, Syracuse University. Younger college voters tend to register in the Presidential years and then leave the area after graduation resulting in a fall off voters.
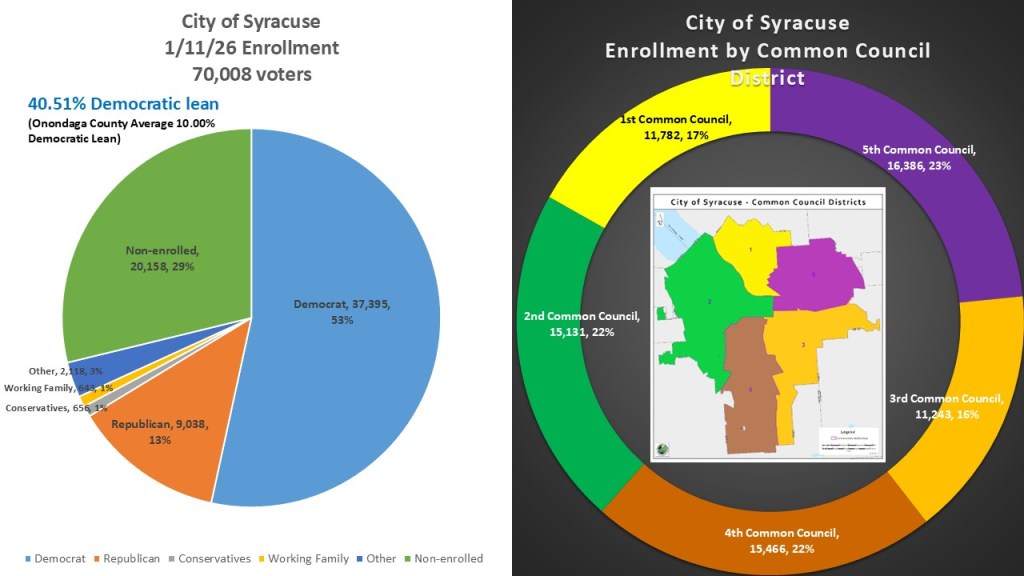
According to registration data pulled on January 11, 2026, the City of Syracuse currently has 70,008 voters. 37,395 (53%) are Democratic, giving Democrats a rare straight majority. The non-enrolled are second with 20,158 voters (29%) and the Republicans are a distant third with just 9,038 voters (13%). Democrats have a whopping 40.51% advantage in the City of Syracuse. The City of Syracuse has 5 Common Council districts drawn by the Citizen led independent redistricting board in 2022. District lines are drawn based on the number of residents, not on how many people are registered to vote. So, this leads to a substantial change in registered voters. The 3rd Common Council District on the east side is the lowest registered voters with 11,243 (16%) mainly because of Syracuse University and Lemoyne College being inside its borders. Up next is the first common council district with just 11,782 (17%) on the northside, known for a large refugee non-citizen community. The west side second common Council (15,131 22%), inner city and vallfourth4th common council (15,466 22%), and Eastwood based 5th Common Council (16,386 23%) are close together at the top.
The story of the City of Syracuse is not so much Democratic dominance, but the rising tide of the non-enrolled. Democrats are the majority party but have remained stagnate since the watershed election of 2016 losing 540 voters. The Republicans on the other hand have lost over twice as many with 1213 less voters. This is especially troubling considering how much of a deficit they had to begin with. In many ways 2016 signaled the beginning of this non-enrolled wave we are seeing, especially in the city. The non-enrolled have grown by 3,993 voters since 2016. We can see why Ben Walsh had a path to victory in 2017 and 2021 despite not being a Democrat. We also see why Sharon Owens his former deputy mayor was able to win so largely as she was able to bring his strength with non-enrolled and add her party affiliation of Democrat to the mix.
No matter which commo council district you pick, the Democrats dominate every corner to varying degrees of intensity. The most democratic in terms of percentage is the east side third common council district with the mighty 17th ward anchoring a +52.90% partisan gain for Democrats. However, the inner city/valley 4th Common Council district (+50.89%), West side 2nd Common Council (+360.40%) and Eastwood based fifth common council (+34.28%) have statistically more Democrats. The least Democratic district is the north side first which has +28.99% democratic lean. In all five districts Democrats had significant advantage doubling, tripling, and even sextupling them. IN every district the non-enrolled more than doubled the GOP as well.
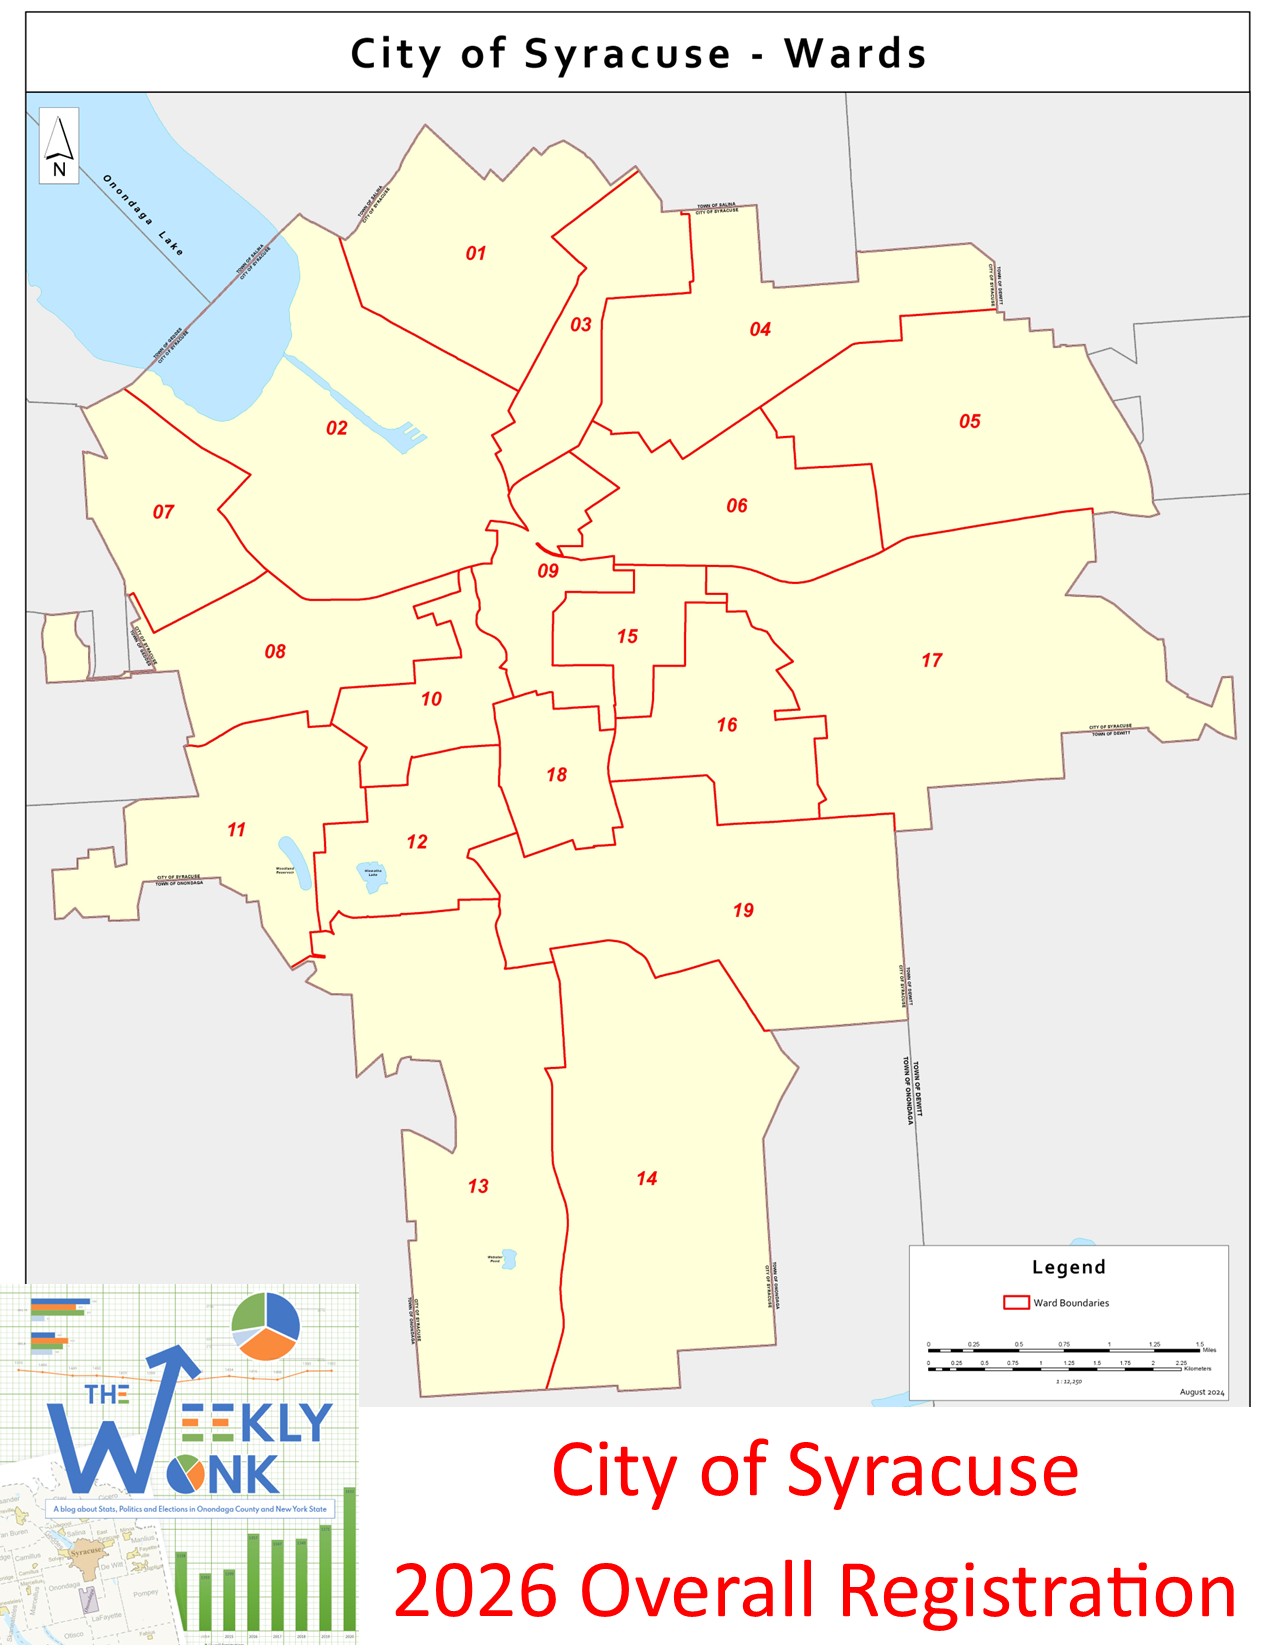
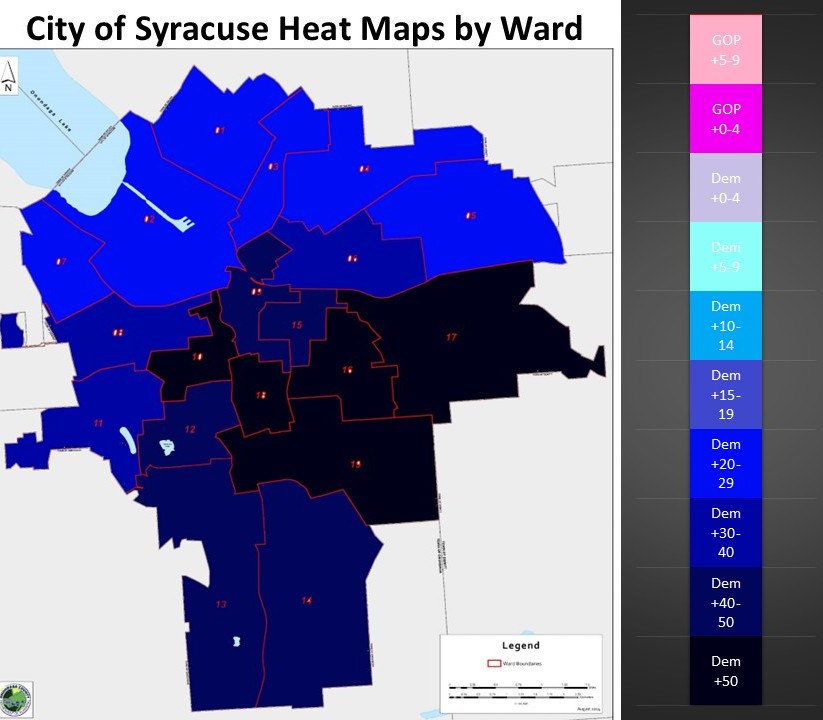
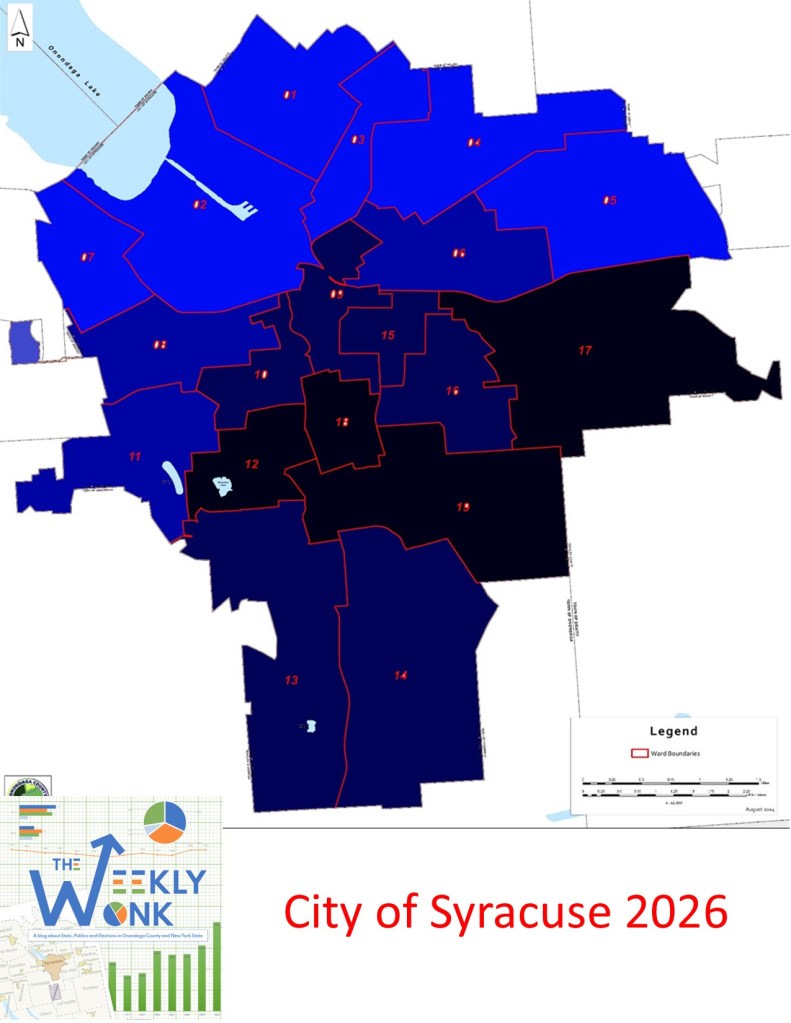
We can see this dominance by the Democrats reflected on the heat map. For this map I wanted to look at the individual words of the City of Syracuse. The sizes of these nineteen wards differ, as their boundaries were established when the city expanded and incorporated what were once farming communities. I had to amplify my normal heat map as there was not one word in the city that was not in the highest category I used to look at other parts of the county. Wards 1, 2, 3, 4, 5, & 7 are in the 2029% Democratic advantage range. Wards 6,8, & eleven are next in the 30-39% range. Wards 9, 12, 13, 14, & 15 are in the 4049% Democratic range. The most Democratic wards ate10, 16, 17, 18, & 19 in over 50% Democratic range.
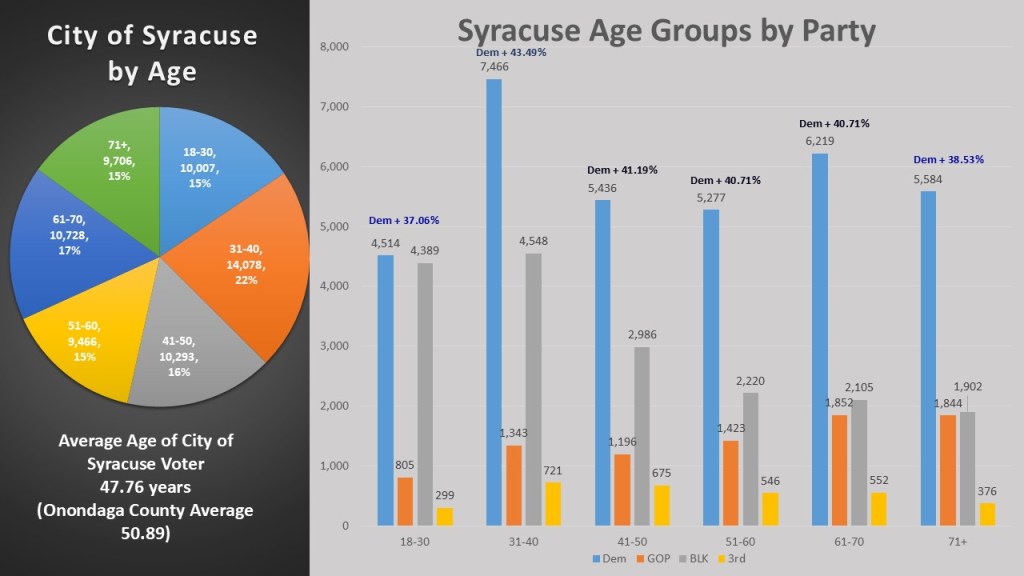
I decided this year to try and do some analysis of age when it comes to voting Demographics. The average age of the City of Syracuse voters is 47.76 years. This is significantly down from Onondaga County Average of 50.89 years. When we look at the age block the age range of 31-40 is significantly larger (14,078 22%) than the rest of the age groups, so it is not just university students bringing down the average age. Not only is it younger it is way more Democratic in every age group. Across the county as a whole and in the suburbs, non-enrolled individuals make up the largest group among the youngest age brackets. However, within the city, Democrats have the highest numbers in all age groups—including those aged 18 to 30. We also see the non-enrolled outnumber the GOP in every age group whereas the Gop performed better in the 51+ in the suburbs and county.
All this registration data eventually leads us to the performance of the city, which has been predominately and overwhelmingly Democratic. The City of Syracuse had a city-wide election I could compare to in 2025, the Syracuse mayoral race. Here we saw Sharon Owens have one of the more lopsided victories any Democrat has ever had in the city with an over 55% victory over her Gop opponent. In our comparative races it is consistent that a Democrat will get between 72 and 77% of the vote coming out of the city. John Mannion in 2024 Congressional race got the largest share in our comparisons with 76.93% of the vote. Emily Bersani in the county clerk race in 2023 got the lowest share of 72.50% but also had one of the closest races in Onondaga County history. Her overperformance in the city from her county wide totals of +22.36% led to her victory in that low turnout year.
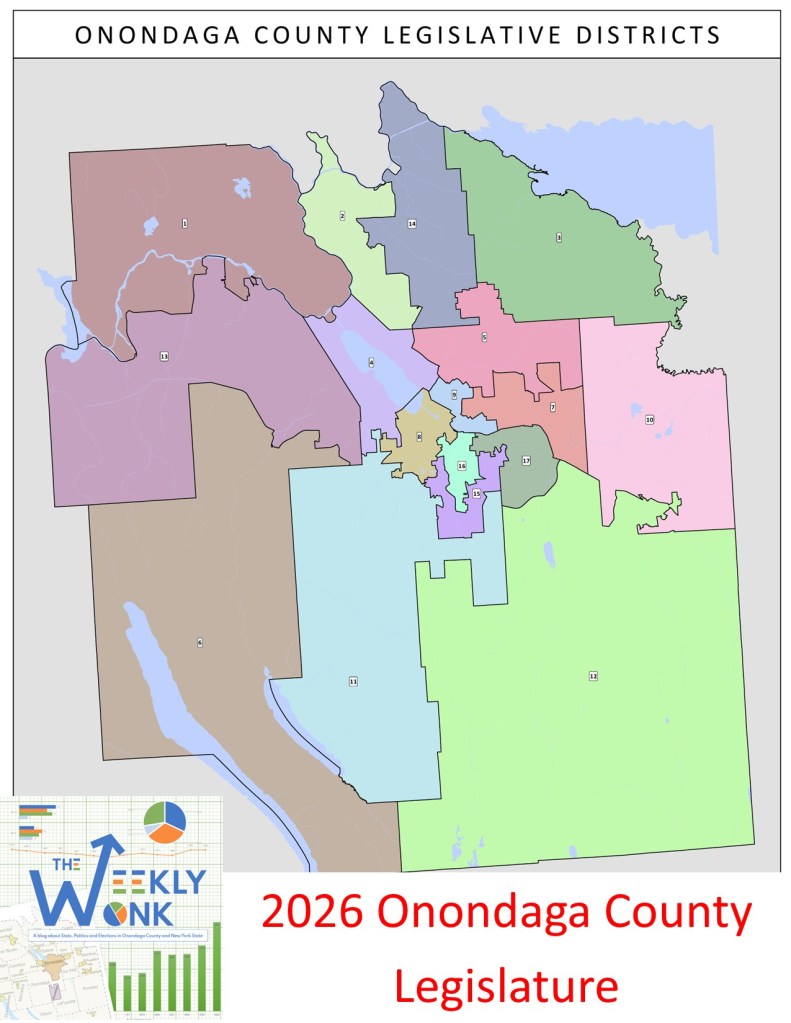
That is, it is for this week’s edition of the #weeklywonk. Nest week I wrap up my four-part series looking at Onondaga County heading into 2026 with an overview of the County Legislature which will hold election in even years for the first time in NY State history. Then after that I will start looking individually at the towns in Onondaga County. As always you can subscribe to dustinczarny.com for all content and election news updates.
This week I focus on the winter conference of the NYS Elections Commissioner Association. Held this last week it is one of our main training opportunities for Lead Election Officials in NY or as we call them, County Election Commissioners. And a special shout out to the Buffalo Bills and Josh Allen for their win this week. Enjoy.
Welcome back to the #weeklywonk. This is my weekly column reporting on electoral and registration data for Onondaga County and New York State. This column was on a bit of a break in late 2024 and 2025 with only occasional postings but is now back with vengeance. We are in the middle of my four parts looking at Onondaga County as we head into the new year. Last week I covered Onondaga County as a whole (found here https://dustinczarny.com/2026/01/01/the-weekly-wonk-onondaga-county-overall-2026/). This week I continue with part 2 of my look at Onondaga County with a focus on the suburbs and towns outside the City of Syracuse.
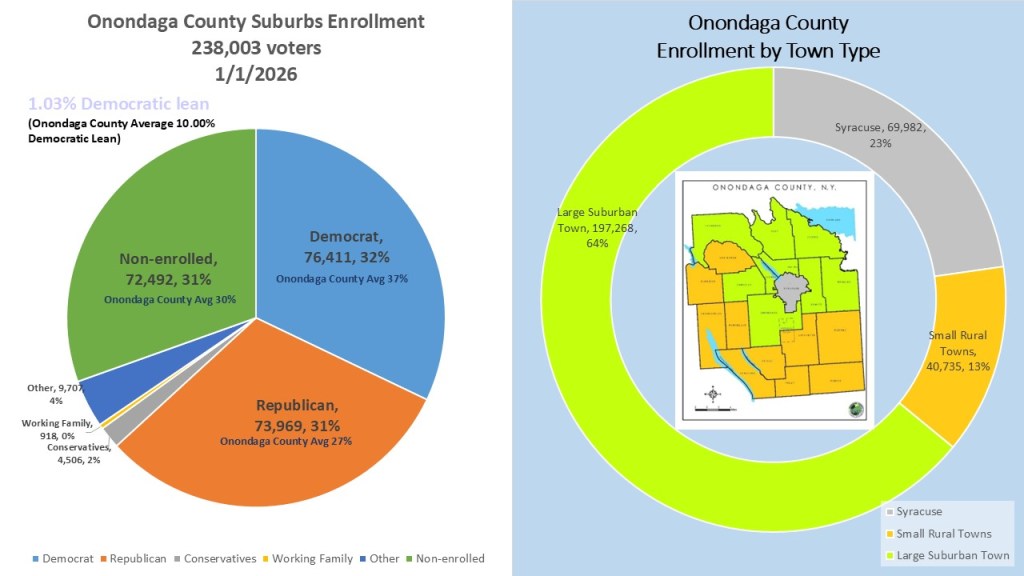
The voters outside of the city of Syracuse are evenly split. Of the 234,608 voters that live outside the City of Syracuse 32% are Democrat (76,411), 31% Republican (73,969), 29%, non-enrolled also 31% (72,492), the third parties make up about 6% (9,707 Other, 4,506 Conservatives, 918 Working Families). This means the areas outside the city of Syracuse have a 1.03% Democratic lean, which is down 10.00% Democratic lean in the county. I tend to look at Onondaga County in three distinct groups. The nine large suburban towns (Camillus, Clay, Cicero, Dewitt, Geddes, Lysander, Manlius, Onondaga, & Salina) with over 10k active registered voters, the 10 small rural towns (Elbridge, Fabius, Lafayette, Manlius, Otisco, Pompey, Skaneateles, Spafford, Tully, & Van Buren) with under 10k registered voters, and the City of Syracuse. The large suburban towns make up the majority of Onondaga County with 197,268 voters (64%), the City of Syracuse is second with 69,982 voters (23%), and the smaller rural towns make up the smallest voter count with just 40,735 voters (13%).
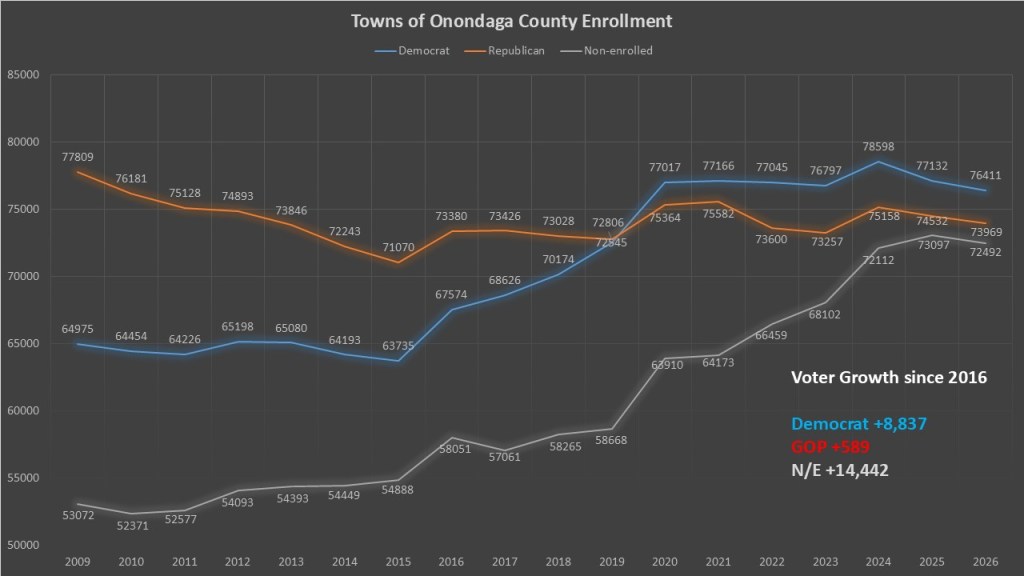
The Democratic rise in the voters outside of Syracuse is the driving factor that has turned our county blue. We see in this chart the rise was dramatic during the first Trump term (2016-2020) and since then the parties have leveled off. However, the rise of the non-enrolled in the suburbs is the most 2016 is the sea change year. Democrats grew by 8,837 voters outside the City of Syracuse since 2016, while the GOP gained just 589 voters. The non-enrolled explosion in Onondaga County can also start in 2016 and it has added 14,442 voters to their ranks. They are the biggest growing segment and the only segment significantly growing since 2020.
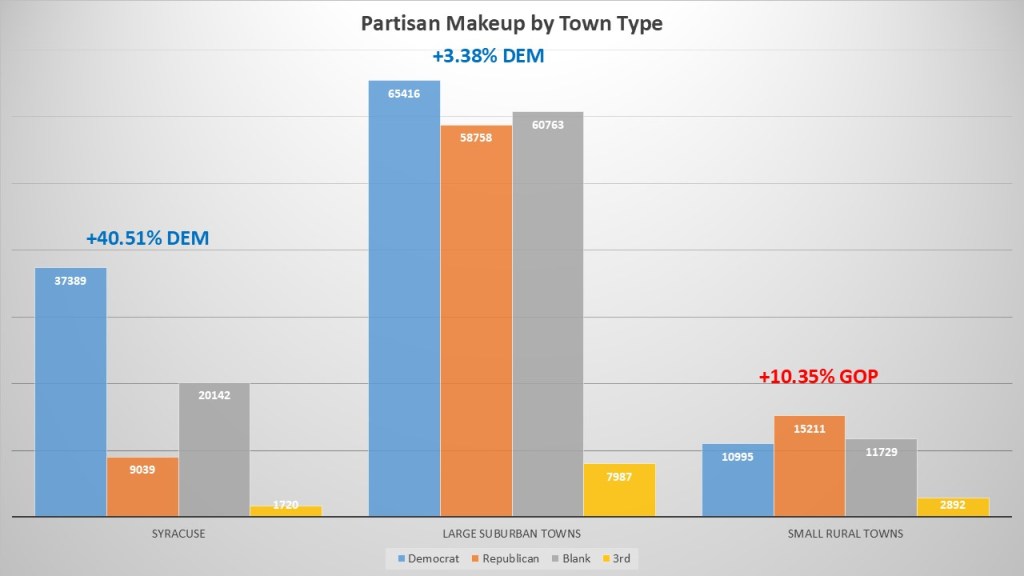
The partisan makeup of the three portions of our county is vastly different. Democrats dominate the City of Syracuse with a +40.51% enrollment advantage. Democrats also have a slight registration advantage in the large suburban towns with a +3.38% enrollment advantage. Republicans dominate the small rural towns with a +10.35% enrollment advantage. The non-enrolled dwarf the GOP inside the city adding to their disadvantage there. They also slightly eclipse the GOP in the large suburban towns while slightly overtaking the Democrats in the small rural towns. This pattern of the n/e mimics the growth and parity in these regions overtaking a major party in all three regions.
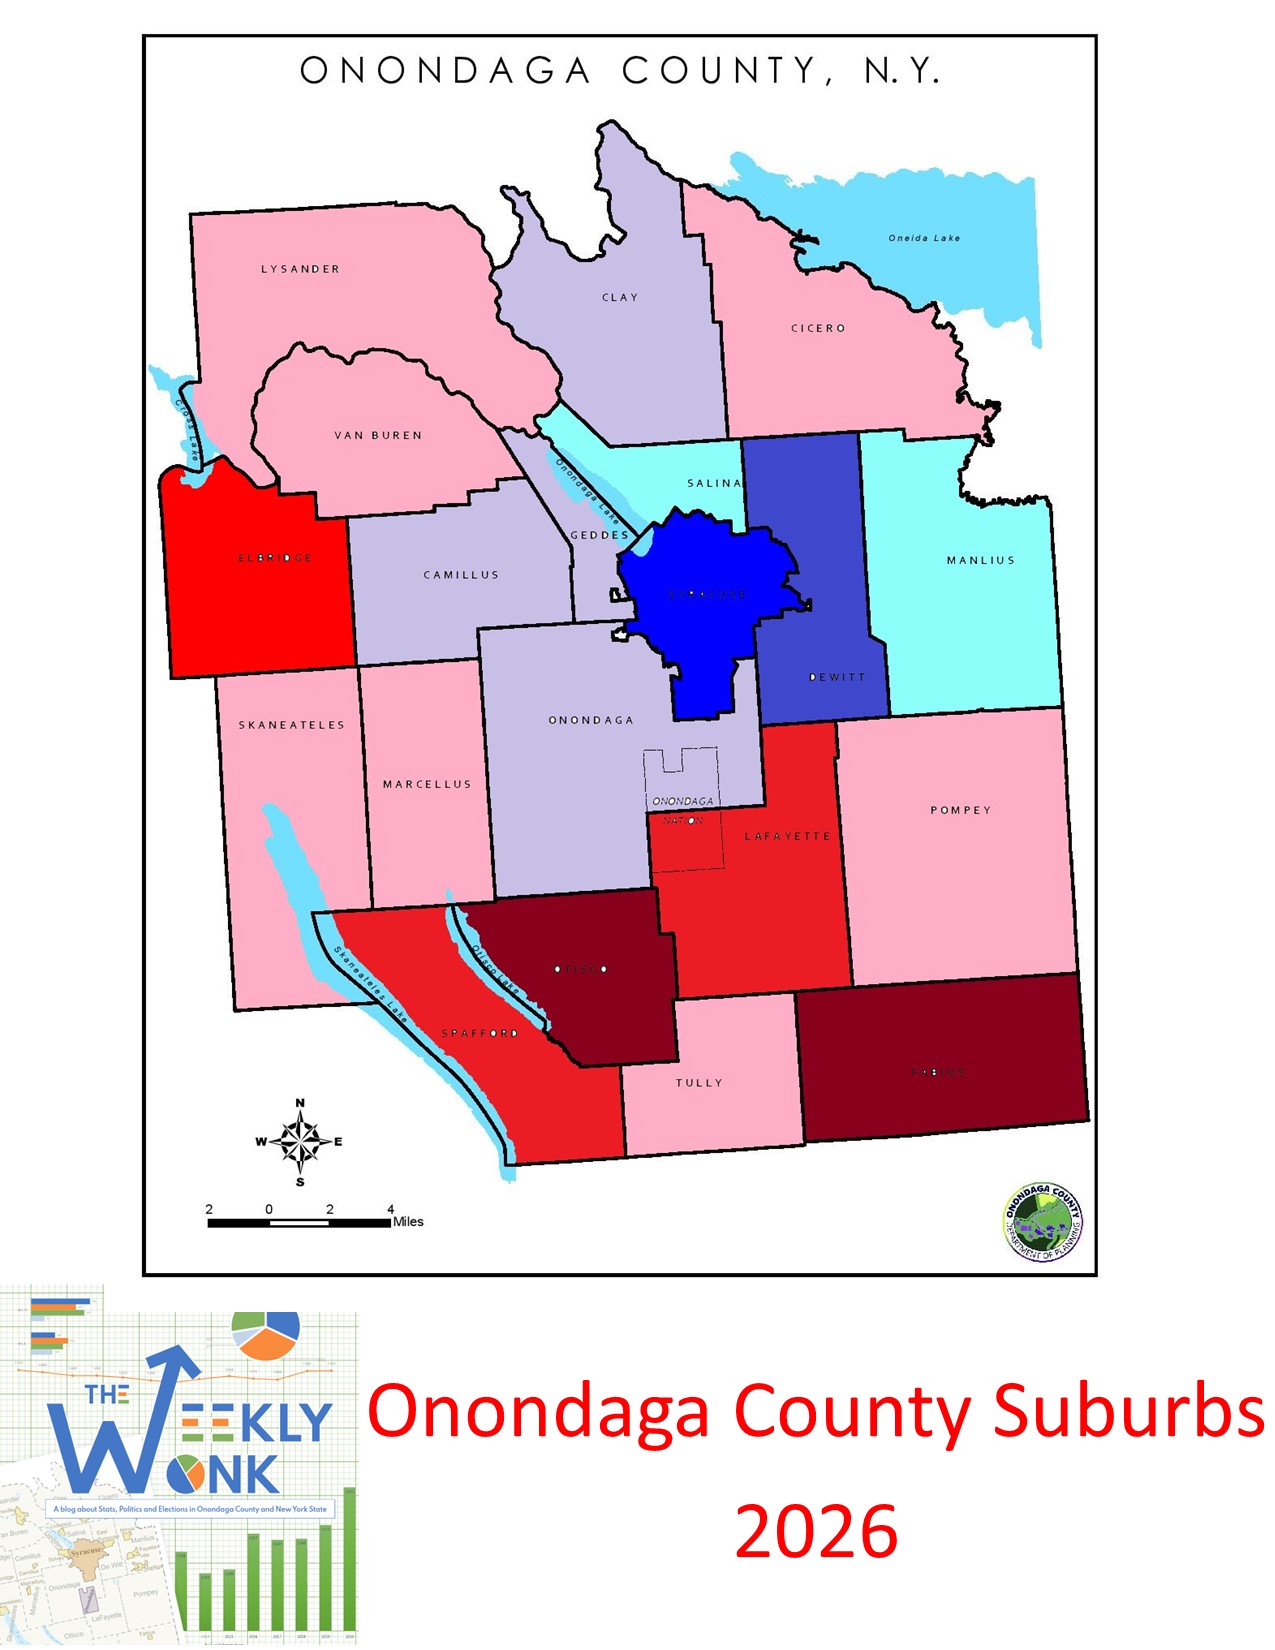
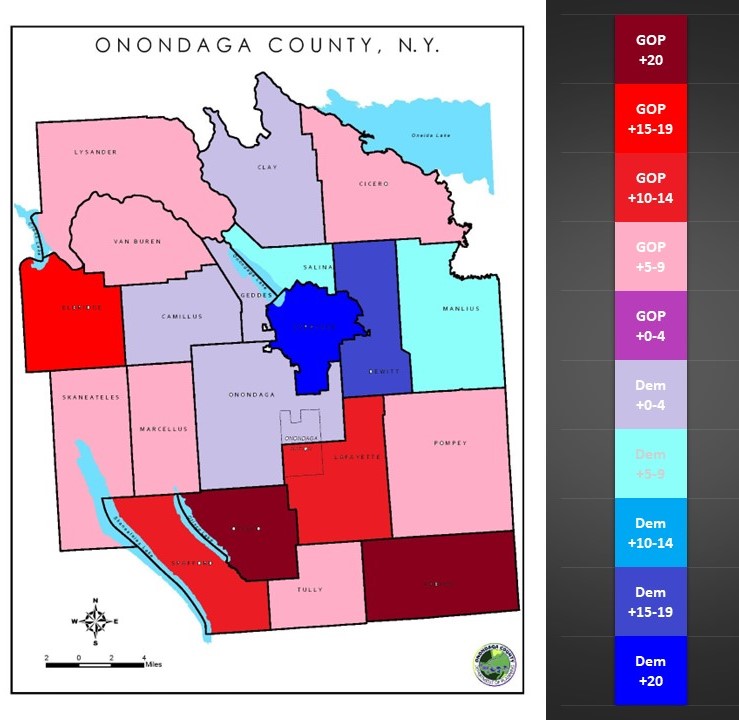
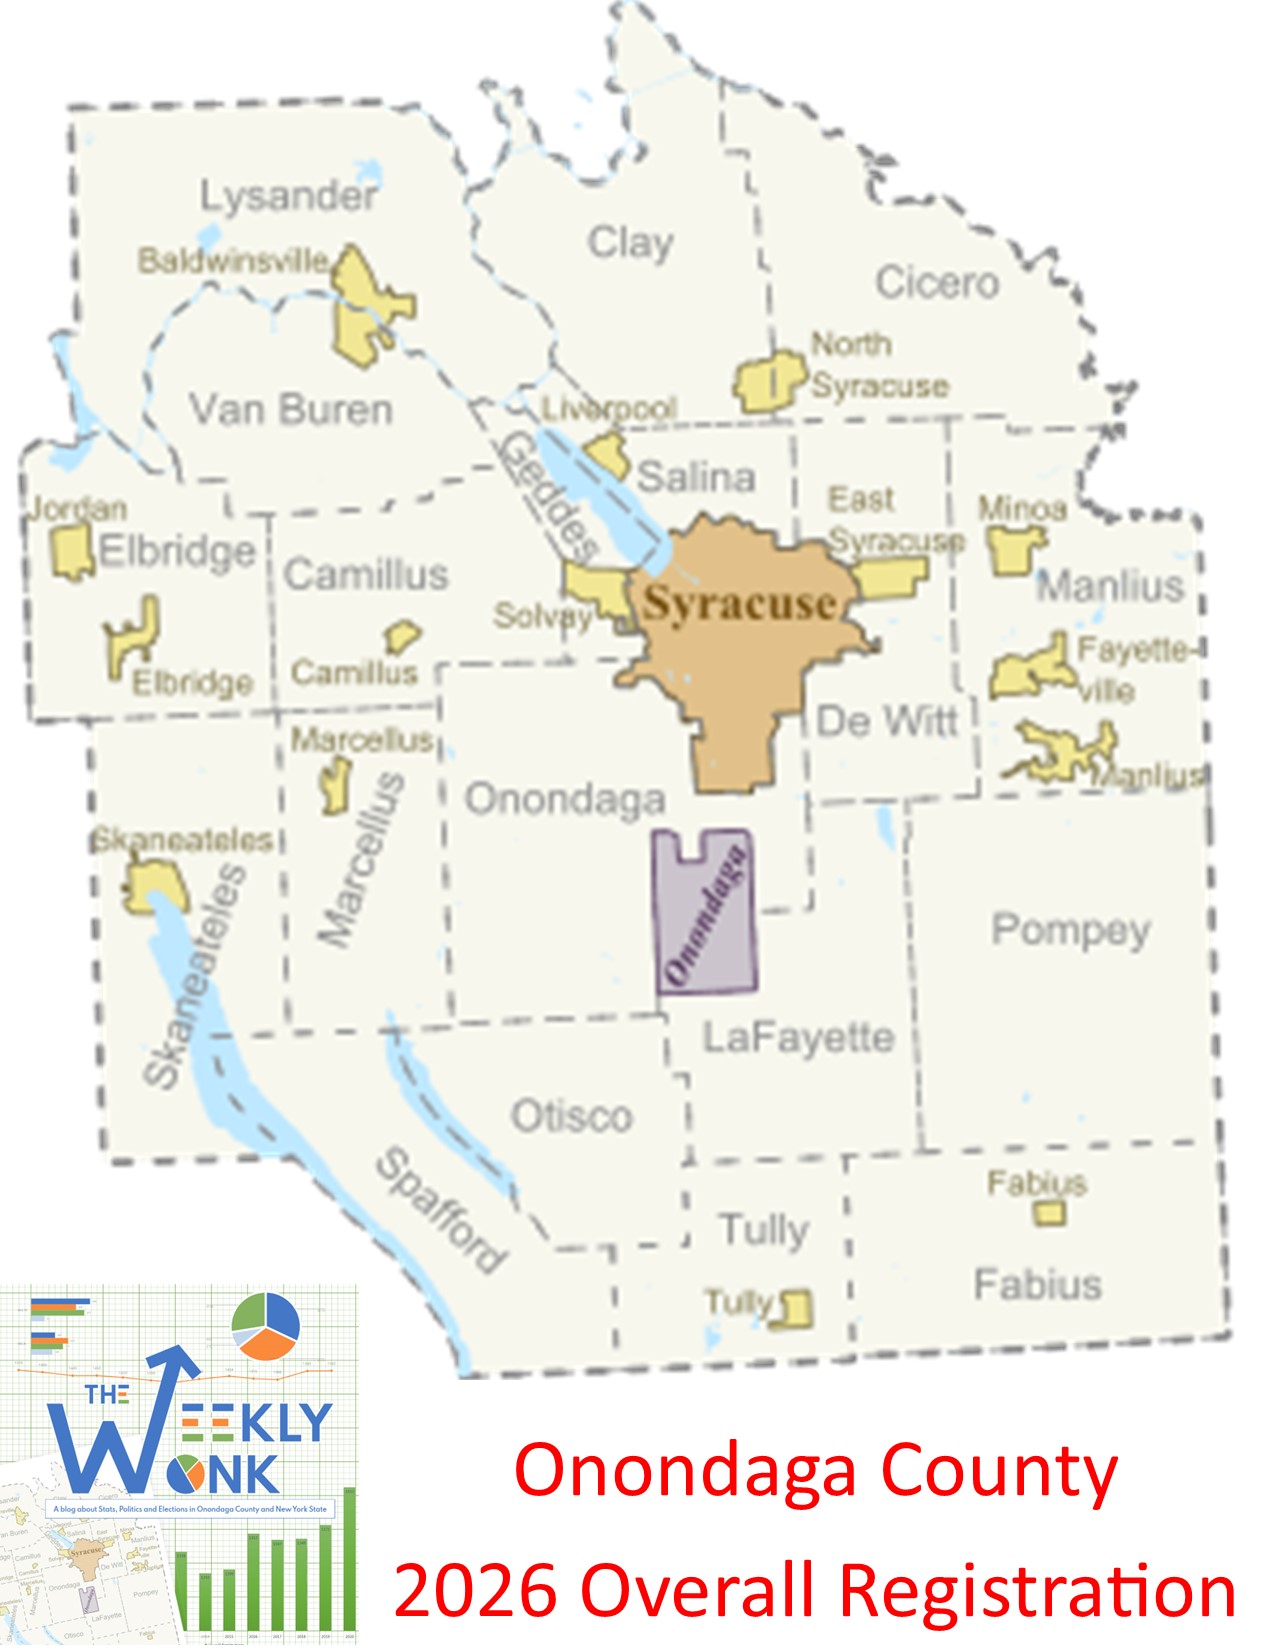
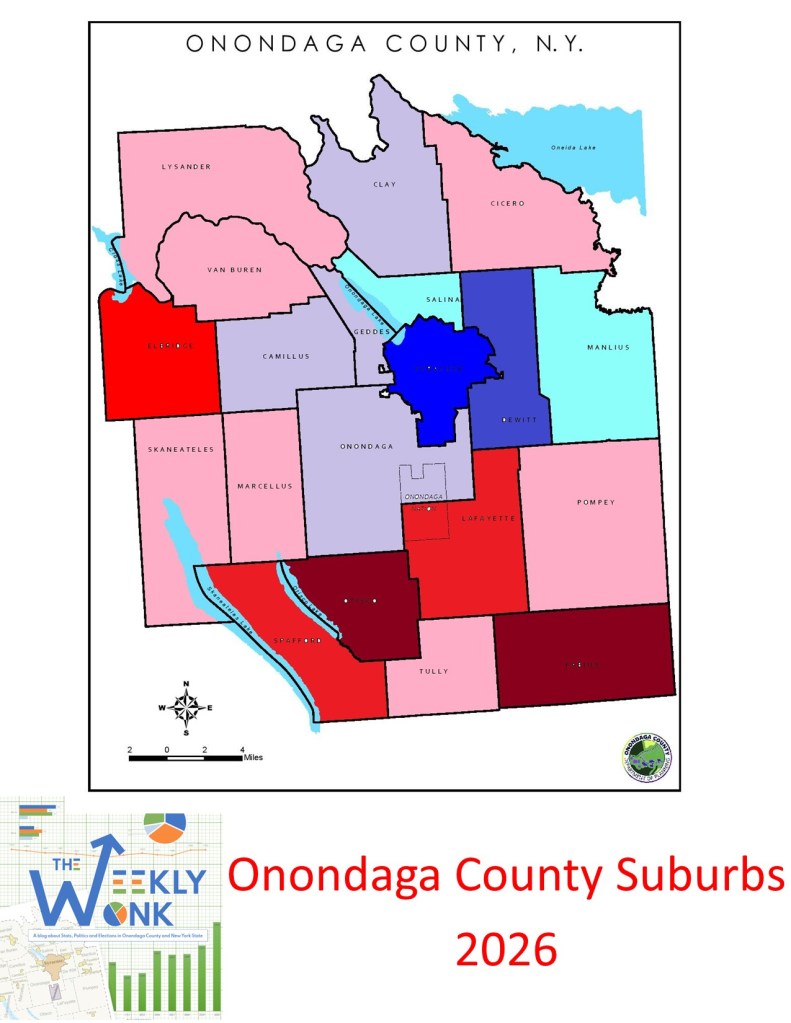
When looking at the heat map of the towns of Onondaga county individually we see definitive stratification and diversity of the amount of partisan lean in a town. Syracuse is overwhelmingly Democrat in the +20% partisan advantage range. Dewitt follows next with a strong Democrat advantage in the 15-19% range. Two more towns, Salina and Manlius, are in the lean Democratic range of 5-10%. Camillus, Clay, Geddes, and Onondaga are the borderline Democratic towns in the 0-5% range. Cicero, Lysander, Marcellus, Pompey, Skaneateles, Tully, and Van Buren are in the lean Republican range of 5-10%. Lafayette and Spafford are in the moderate GOP range of 10-15%. Elbridge is in the strong GOP range of 15-20%. Finally, Otisco and Fabius round out the towns in the overwhelming GOP range of +20%.
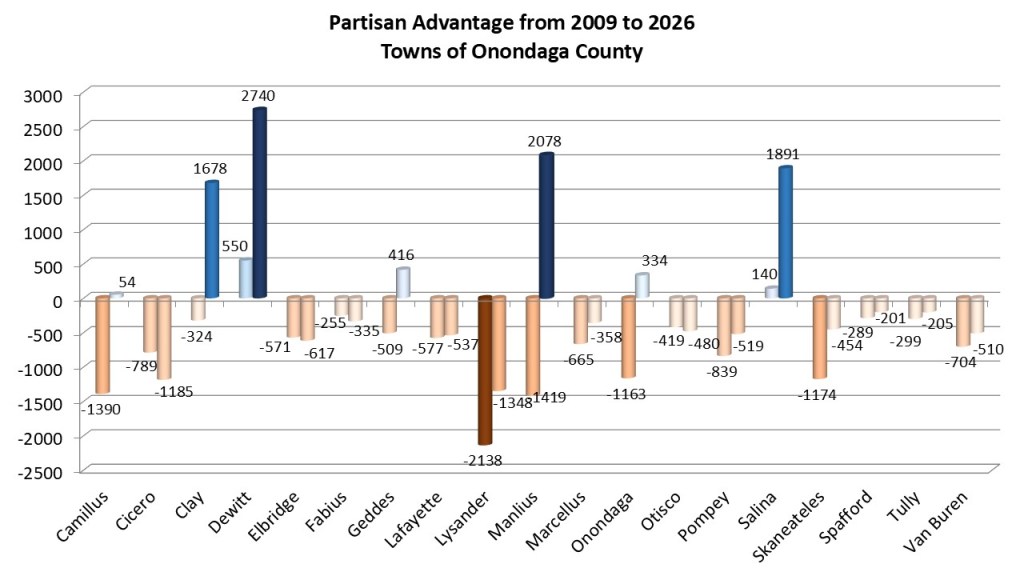
This chart shows the changes in individual towns since 2009. Looking at the registration rates since 2009 it is important to note that most towns shifted toward the Democratic party in partisan difference between Republicans and Democrats. Dewitt and Salina were slight Democratic towns in 2009 and shifted well towards the Democrats. The towns of Camillus, Clay, Geddes, Manlius, and Onondaga reversed from GOP towns to Democratic towns in terms of partisan advantage. Lafayette, Lysander, Marcellus, Pompey, Skaneateles, Spafford, Tully, and Van Buren remained GOP lean towns, but Democrats cut into the partisan advantage. Cicero, Elbridge, Fabius, & Otisco were the only towns that shifted to the GOP over that time frame.
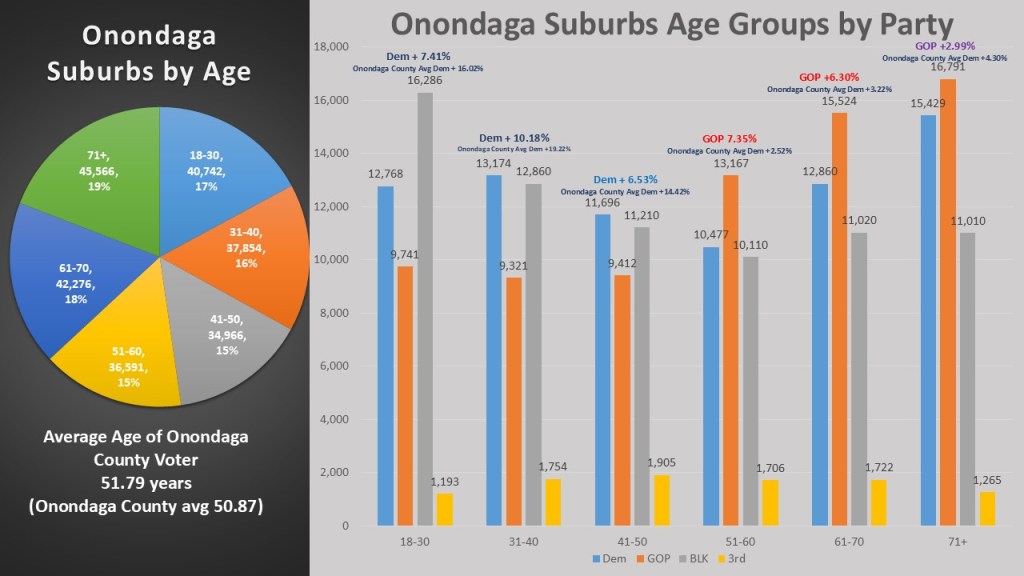
I am introducing age as a statistic I am tracking this year with my #weeklywonk breakdowns. What we are seeing about the places outside the City of Syracuse is they are older than the rest of the county. The average age of non-city voters is 51.79 years old. That is almost one year older than the Onondaga County average of 50.87 years. T=Every age group is also more republican than the age group average of Onondaga County as a whole. When looking at the voting age groups, Democrats and Non-enrolled Dominate the 18-50 ranges like they do in Onondaga County as a whole. However, the GOP dominates the 51-71+ranges. The age groups tend to run 6-9% more GOP than their counterparts in the county.
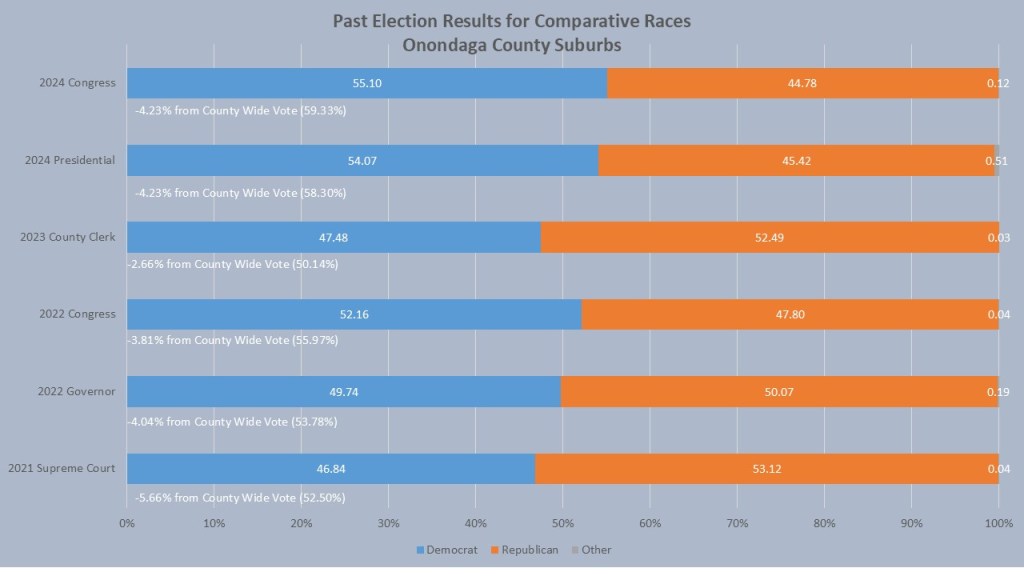
Despite the GOP having a significant sway in in partisan leans, when it comes to results in the recent races we are comparing, the Democrats have tended to outkick their coverage. Democrats won both the 2024 Presidential election and Congressional election in the non-city areas by only 4.23% less than they won in Onondaga County. There was a similar outcome in the 2022 congressional race with Democrats winning but with 3.81% less than they won Onondaga County. They lost the Governor’s race in the non-city portions but only underperformed the Onondaga County average by 4.04%. The best performer in the towns when compared to their overall average was Emily Bersani for County Clerk in 2023 only trailing by 2,66%, The worst performer in the towns was Anthony Bersani in the 2021 Supreme Court race trailing his overall performance by 5.66%. This data suggests that in the competitive races the non-enrolled and nonpartisans in the non-city areas tends to align with the Democrats more than the GOP.
That is, it is for this week’s edition of the #weeklywonk. Next week I will continue looking at the regions of Onondaga County as we head into 2026. The City of Syracuse will be the focus of part 3 launching either Wednesday or Thursday of next week. In the meantime, you can subscribe to dustinczarny.com for all content and election news updates.
“Usually vacancies happen when somebody gets a job or we’ve had deaths. This is a weird one,“ Czarny said. ”I don’t remember a removal from a local committee.”
This week I preview village elections. Why some villages have elections in March, June or November and why sometimes the Onondaga County Board of Elections doesn’t run these elections. Check it out along with the answer to last week’s trivia question! Enjoy.
Happy New Year and welcome back to the #weeklywonk. One of my 2026 New year’s resolutions is to get back to this, my weekly look at registration electoral data in Onondaga County and New York State. I took a brief hiatus from this column in 2025 with just sporadic columns, but now in 2026 I am back with renewed vigor. As we start the New Year I focus my efforts on Onondaga County overall. This will be four parts to look at our home, Onondaga county: Overall, Suburbs, the City of Syracuse, and the Onondaga County Legislature. This week is part 1, Onondaga County Overall. In 2026 Statewide offices such as governor, Comptroller and Attorney General, NY 22 Congressional race, Supreme Court, County Court, and Sheriff will run countywide.
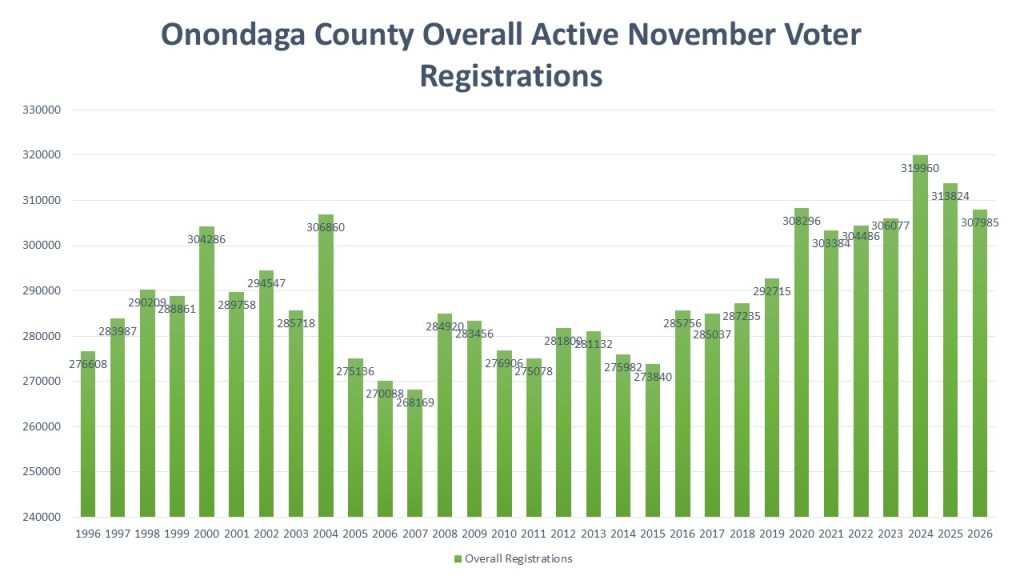
We start with a historic look at voter registration totals in Onondaga County. For comparisons sake we look at the active voter registrations right before the November election of each year except for 2026 which is the registration data as of January 1, 2026. We start 2026 with 307,985 active registered voters. This is down from the 2024 record of 319,960 but still the fourth highest registered voter total on record. What we are seeing is a typical downward trend after a Presidential election. Normally registered voter totals crest in Presidential year and then fall. The major exception to this was 2016-2020 which saw increases in voter registration during the first Trump presidential years. We also made it easier to register between 2020-2024 and the pandemic years made the decreases less noticeable.
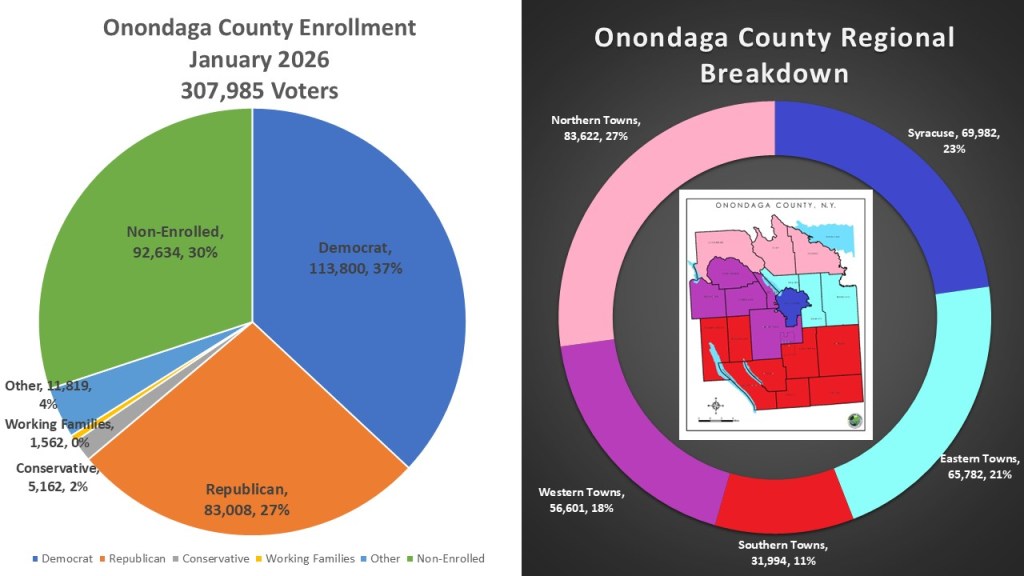
Of our 307,985 voters we see a large plurality of voters registered in the Democratic party. There are 113,800 Democrats (37%) compared to 83,008 Republicans (27%). The non-enrolled population is second most registration with 92,634 voters (30%). The Conservative party has 5,162 voters (2%) and the working families party has 1,562 voters (<1%). There are 11,818 (4%) voters enrolled in non-recognized parties. When it comes to the regions of Onondaga County, I break it up into five distinct regions. The plurality of voters lives in the Northern towns of Clay, Cicero, and Lysander with 83,622 voters (27%). Next is the City of Syracuse, which has 69,982 voters, representing 23%. The eastern towns of Dewitt, Manlius, and Salina have 65,782 voters (21%). The western towns of Camillus, Elbridge, Geddes, Onondaga, and Van Buren have 56,601 (18%). The rest of the towns (Fabius, Lafayette, Marcellus, Pompey, Skaneateles, Spafford, Otisco, and Tully) make up the southern portion of Onondaga County, the largest land mass, but the least populated with just 31,994 (11%).
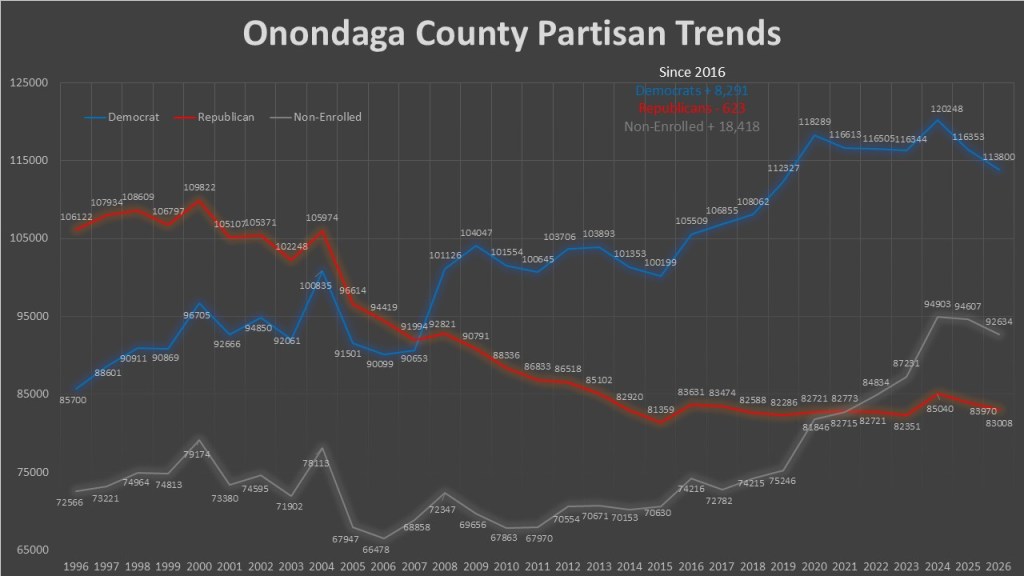
Here we have had partisan trends in Onondaga County since 1996. The long-term story of Onondaga County is how an upstate red dominated county has transformed over the last 30 years from a solidly red Republican County to a solidly blue Democratic County. Democrats first overtook republicans in the 2008 Obama Presidential election and have not looked back since. The Democrats most dominant stretch was their growth in the 2016-2020 cycle with large gains compared to stagnate GOP registration. Since the last 2024 Presidential election all three groups we are tracking, Democrats, Non-enrolled, and Republican voters, are trending down as the voter registration rolls have shrunk. A key point often missed is that an increasing number of people in Onondaga County are not enrolling in a party. In so many ways the 2016 election is a turning point both nationally and locally. Since 2016 the Democrats have had decent growth adding 8,291 voters. Meanwhile the GOP has stagnated, losing only 623 voters, which is a bit of improvement from steady decline since 2004-2015. However, the massive growth of the non-enrolled voter is the dominant story since. 2-16, adding 18,418 voters. This is a trend that will shape Onondaga County elections for years to come.
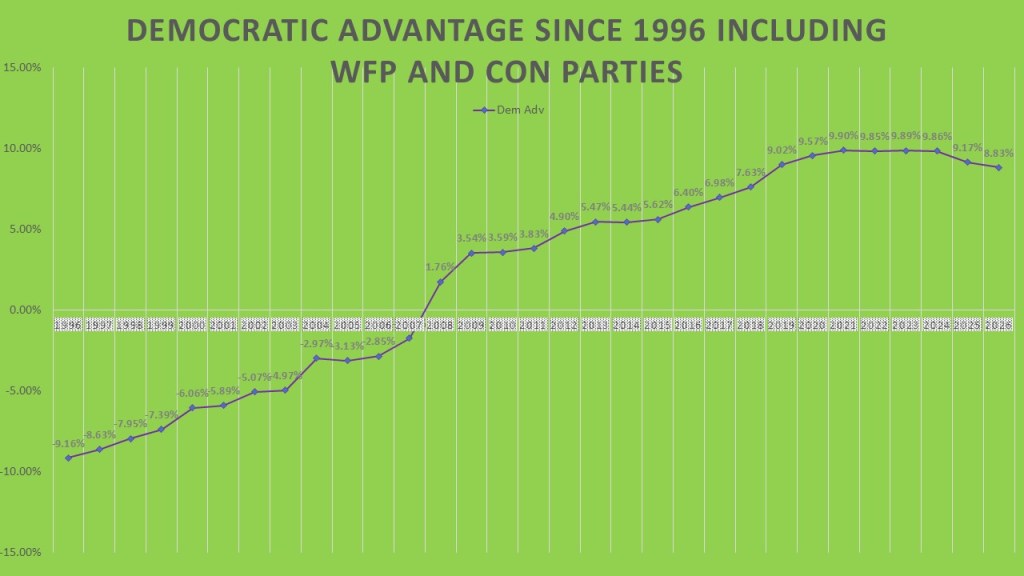
Onondaga County has four individually recognized parties, the Democrat, Republican, Conservative, and Working family’s party. Though they are four different parties, the Conservative and Republican party tends to align on the right while the Democrat and Working families party aligns with the left. Comparing the combined totals of Democratic–Working Families and Republican–Conservative parties show how the Democratic advantage in Onondaga County has grown. The left aligned parties of the Democrats and WFP currently have an 8.83% advantage over the right aligned GOP and Conservative parties. This is down the high of 2021 with 9.9% but still higher than every year before 2019. One reason for this trend is the rise in non-enrolled voters, which has lessened the influence of all four parties. Additionally, after the 2024 election, voters—particularly in Syracuse and around Syracuse University—removed from the rolls due to issues with mail verification and undelivered mail. When 2028 comes about it will be helpful to look at this data set from presidential to presidential and see if this trend continues to grow as it has since 1996.
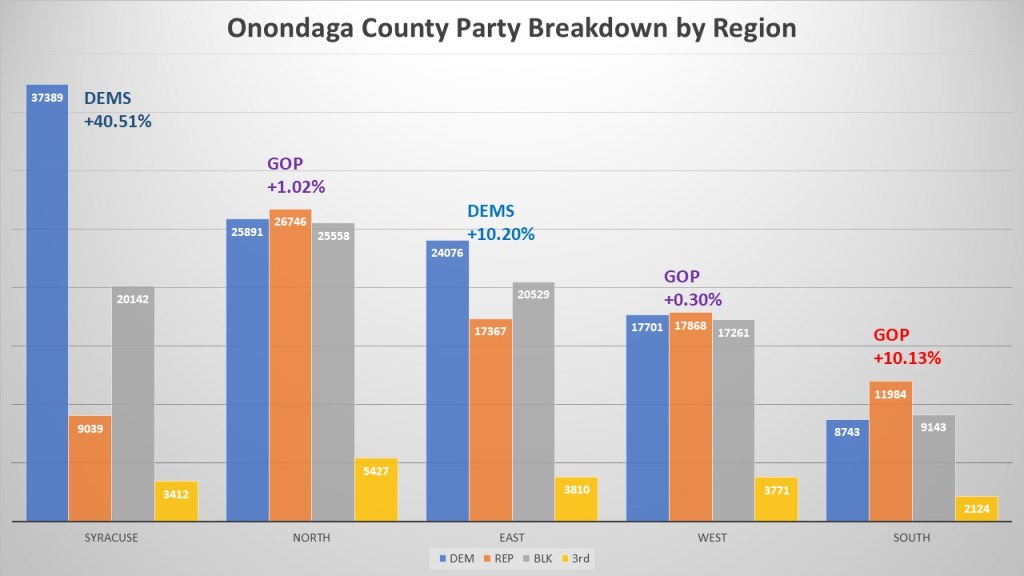
Looking at the five regions of Onondaga County, we find a truly diverse partisan story. The City of Syracuse is the third largest region but the highest number of Democrats and the highest partisan advantage with Democrats having a 40.51% advantage. The Northern region is the most populace but also even partisan wise. The second the greatest number of Democrats live here and the greatest number of Republicans. The GOP has a slight +1.02% advantage. The Eastern towns have gro2wn into a solid Democratic bastion with the third the greatest number of Democrats and a solid Democratic partisan advantage +10.20%. The western towns are the most evenly split region. It has the second the greatest number of GOP and fourth greatest number of Democrats, but the GOP only has a minuscule +.30% partisan advantage. The most solid GOP regions are the least populace region, the south. The GOP hold a +10.13%, Of note is where the non-enrolled outnumber a major party also seems to correspond to high partisanship in the region. Syracuse, the East, and the south all experience this pattern.
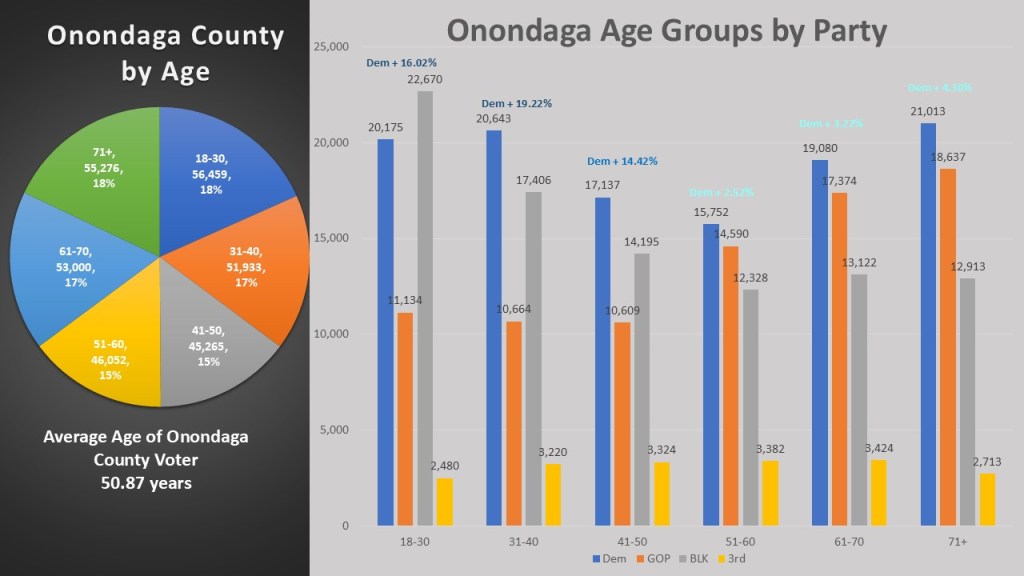
This year I want to introduce a new statistical category to analyze age. The average age of an Onondaga County active registered voter is 50.87 years old. In discussing age, I will break Onondaga County into 6 distinct age categories 18-30 54,459 voters (18%), 31-40 51,933 voters (17%), 41-50 45,265 voters (15%), 51-60 46,052 voters (15%), 61-70 53,000 voters (17%), and 71+ 55,276 voters (18%). When looking at the partisan trends of these age groups, Democrats have the advantage in all of them but to a varying degree. Democrats have a +19.22% advantage in the 31-40 group, +16.02% in the 18-30 group, +14.42% in the 41-50 group. In each of those groups the non-enrolled dwarf the GOP. However, in the upper range the Democratic candidates dropped to just +4.30% in the 71+, +3.22% in the 61-70, and +2.52% in the 51-60. These groups tend to be more partisan driven with less non-enrolled voters. Comparing these figures with voter turnout helps explain why elections in Onondaga County are highly competitive: older voters participate at higher rates than younger ones, and Democrats typically turn out less often than Republicans.
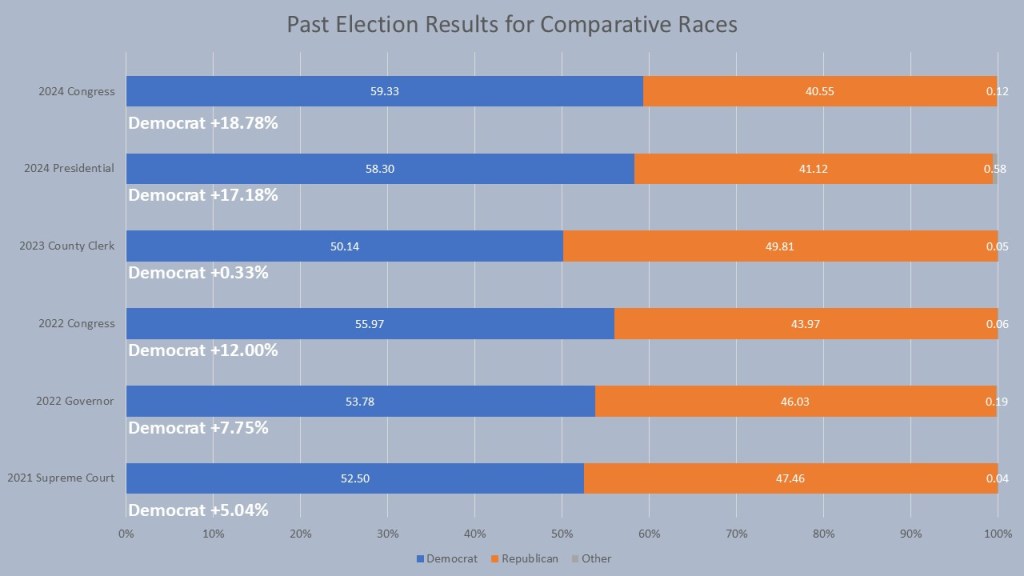
Finally, we look at the comparison races in Onondaga County. 2025 was an unusual year as we did not have a one-to-one race that covered all of Onondaga County to draw a comparison for how Onondaga County performed. So, I am drawing two races from 2024 to compare and two from 2022. Our two odd year comparisons, 2021 Supreme Court with Anthony Brindisis (+5.04%) and. 3 County Clerk with Emily Bersani (.33%) show what typical odd year elections mean for Onondaga County with tight races (Brindisis lost the Supreme Court race by about 9% by losing in the other 5 counties). In 2022, the last Gubernatorial year, Kathy Hochul won Onondaga County by 7.75% which was near how she won state-wide. For congress in 2022 the Democratic nominee Fran Conole won Onondaga County by 12.00% but lost the race by about 1%. J. Mannion in 2024 won the Congressional race in Onondaga County by 18.78% won overall by about 9%. Mannion did better than Presidential Candidate Kamala Harris who only won about 17.18% (down from 20% Biden won in 2020) which shows why Harris underperformed in less Democratic states in the country and lost the presidency to Trump.
That is it for this week’s edition of the #weeklywonk. Next week I will look at part 3 of my focus on Onondaga County as I will focus on the suburbs of Onondaga County. I will then the next week look at the City of Syracuse followed by the Onondaga County Legislature to close out our top-level look at our home Onondaga County going into 2026. As always you can follow along by subscribing to dustinczarny.com to get an email notification for all media and content updates.
This week’s episode I look ahead to the expected races in the 2026 General Election for Onondaga County. I detail how the even year bill will move county legislature and some town races next year. I also highlight some races that I think are pretty important to watch. Also this week’s trivia question: What is the average age of the Onondaga County voter. Answer coming next week or in my next #weeklywonk. Enjoy.
Welcome back to the #weeklywonk. This is my weekly statistical column on electoral and registration data in Onondaga County and New York. This column is back after a semi-hiatus since late 2024 and I intended to bring this back weekly on Wednesdays going into 2026. This week’s column is launching a little late due to the Christmas holiday and personal travel. But we are back with our third, and final look back at the 2025 Election results. This week I will focus on how Democrats performed in the 2025 election by focusing on who won and where they won.
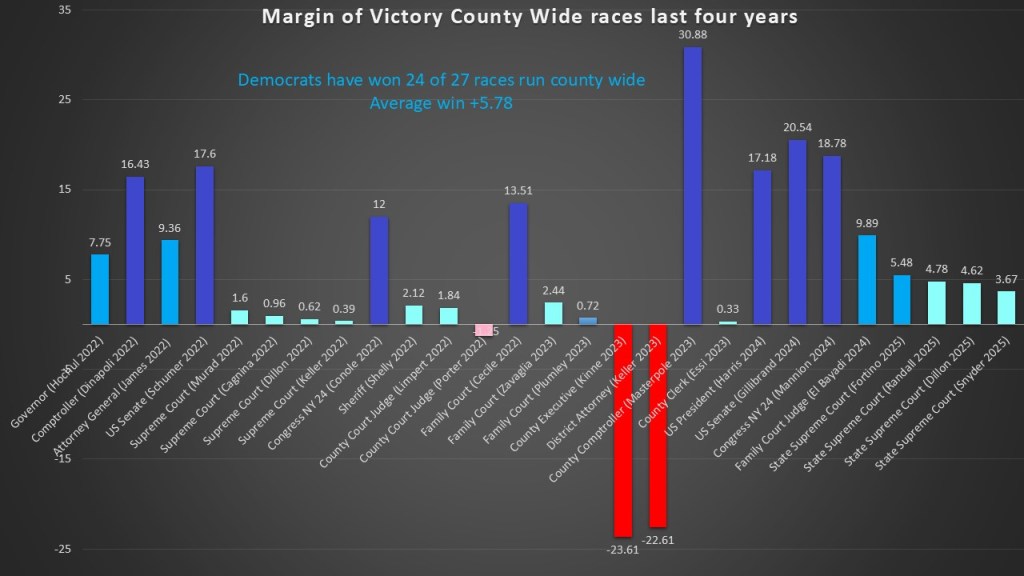
In our first slide we look at the 4-year election cycle and races that spanned the entire county of Onondaga. This data slide has been a regular feature of my #weeklywonk to combat the old notion that Democrats cannot win county wide. In face Democrats have consistently won on races that span the entire county. This includes races like Congress, NY Supreme Court, and Statewide offices that span the county and go beyond, but the county portion of those races have a definitive blue tinge. In the last 4 years there have been twenty-seven races that have run in the entire county. Twenty-four of those races the Democrats have won the Onondaga County portion of those races by an average of 5.78%. The only races the GOP has won are County Court (Porter 2022), District Attorney (Keller 2023), and County Executive (Kinne 2023). However, because of poorer performances in other portions of districts that run outside of Onondaga County Democrats lost the 2022 Congressional race (Conole), all four 2022 Supreme Court races (Murad, Cagnina, Dillon, Keller) and the 2024 Presidential race (Harris). In 2025 there were only 4 NY Supreme Court races that spanned the entire county. The Democrats secured victories in every Onondaga County area, with such impressive performance that Fortino, Randal, and Dillon w to the 5th Judicial seat. Not shown on here are the 2023 Supreme Court Judicial races where Democrats elected not to put up candidates. We can see by the chart Democrats have not just done well in Onondaga County but there are getting better each year.
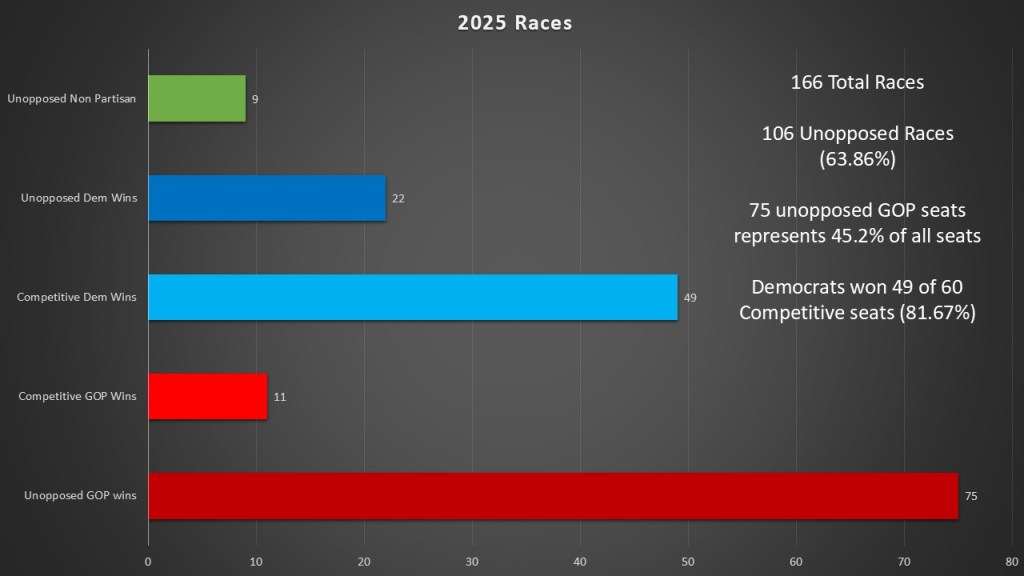
Focusing on the 2025 public office races there is a hidden story to this election. The news coverage of the results rightfully focused on the gains Democrats made in Onondaga County. Yet, little attention has been given to the number of uncontested races in Onondaga County for 2025. There were 166 total races on the November ballot. 106 of those races (63.86%) were unopposed, 22 Democratic seats were unopposed by the GOP, but a staggering 75 GOP held seats were unopposed by the Democrats. Democrats did extremely will in the sixty competitive seats winning forty-nine of them for 81.67%. One must ask however how much better the Democrats position could be if they did not leave 45.2% of all seats in Onondaga County unopposed.
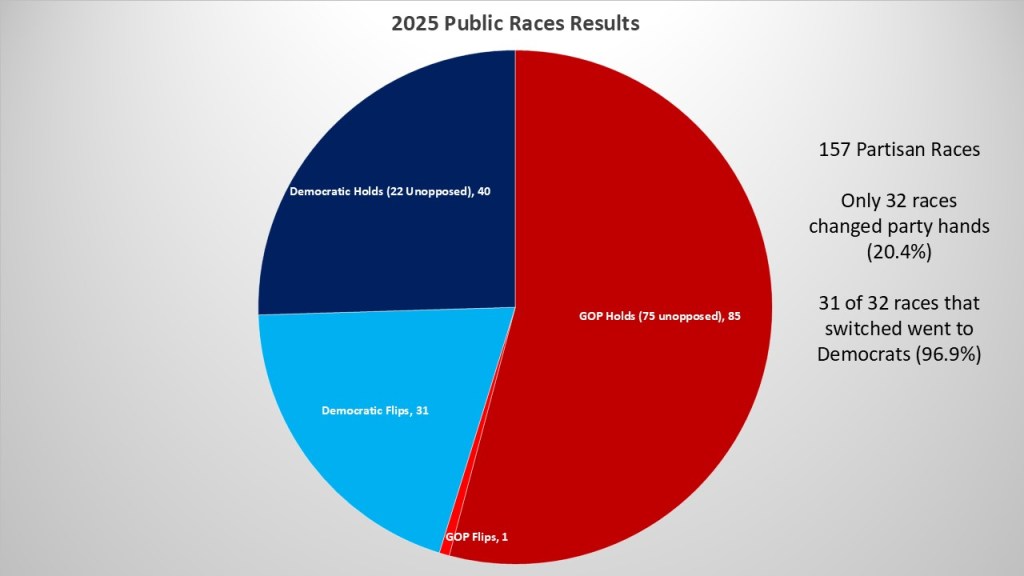
Excluding the nine races in villages where not only were there no opposition but no party labels, I wanted to focus on the flips in Onondaga County. There were 157 Partisan races in Onondaga County. Forty of those seats were Democratic holds, where the seat remained in Democratic hands (including the twenty-two unopposed seats). Eighty-five seats were GOP holds, including the seventy-five unopposed seats. There were thirty-two races, only 20.4% that flipped control. Democrats dominated this stat block, flipping thirty-one seats that were previously held by the GOP. The GOP only flipped one seat held by Democrats, the third ward seat in the village of Solvay, one of the smallest political subdivisions in the county. As we will see in the next few charts, the Democratic flips were incredibly consequential.
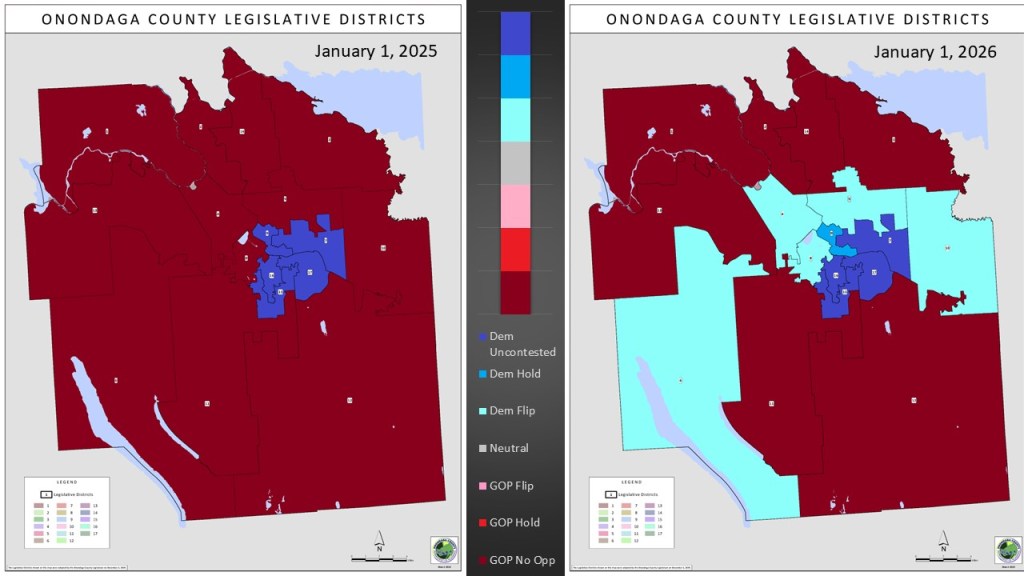
We start with one of the biggest surprises of the night, but also possibly one of the biggest lost opportunities for the Democrats. Democrats flipped control of the Onondaga County Legislature. Due to the departure of Chris Ryan to the NY Senate, Democratic disadvantage for the Onondaga County Legislature dropped o just 5 Democratic seats to eleven republican held seats. The Democrats contested 5 GOP held seats in 2025 and flipped all of them including retaking OCL 8 and flipping OCL 4, 5, 6, and 10 putting those seats in Democratic control for the first time since dropping to a 17-member board in 2011. The GOP did not bother to put up candidates in Democratic seats of OCL 7, 15, 16, & 17. The GOP gambit for OCL 9 failed and the WFP candidate Nicole Watts who is a registered Democrat won the seat despite not having the Democratic line. Democrats failed to recruit candidates in OCL 1, 2, 3, 11,12, 13 & 14 leaving them unopposed. We just do not know how many of those could have flipped in 2025, but with Democratic victories in Clay, Camillus, and Onondaga we could see paths to victory in many of them in 2026 if a similar environment exists.
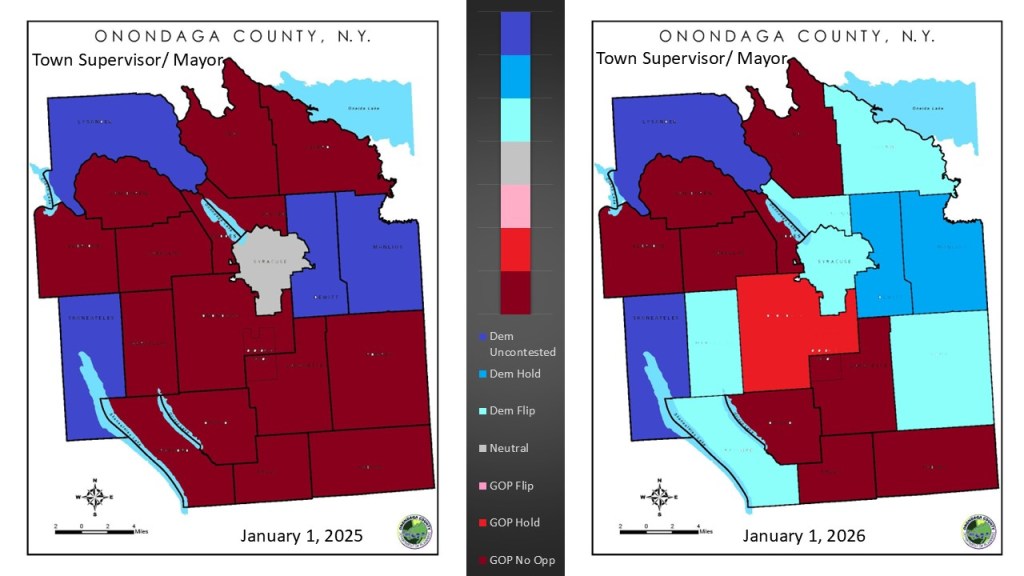
Another promising trend and an area where Democrats have continued success from recent years is chief executive officer of each Town (Supervisor) and City (Mayor of Syracuse). The biggest flip is the election of Sharon Owens to be the next Mayor of Syracuse. This puts City Hall back into a Democratic aligned mayor for the first time in eight years as Ben Walsh is a registered independent. The Democrats also held 4 Town Supervisors. Lysander was not up for election, Skaneateles was unopposed, and the Democrats retained control of Dewitt and Manlius. They flipped 5 Town Supervisor seats in Cicero, Marcellus, Pompey, Salina, & Spafford. The GOP held onto one contested seat, the Town of Onondaga/ The Democratic Committees chose to cross endorsed supervisors in Camillus and Geddes, though in Camillus the GOP supervisor declined the Democratic endorsement. The Supervisors in Clay, Elbridge, Fabius, Lafayette, Otisco, and Van Buren. Excluding the City of Syracuse this leaves the nineteen towns with 10 Republican Supervisors, 9 Democratic Supervisors with one of the GOP supervisors (Geddes) owing their election to a Democratic cross endorsement. This is the most parity in Onondaga County executives in modern history.
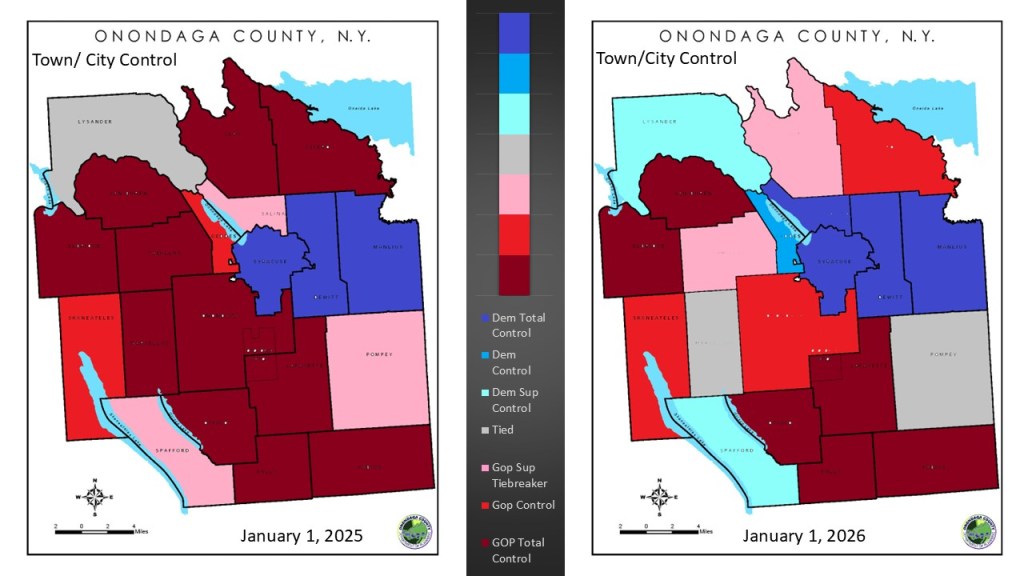
Control of a town or city is not just the chief executive; it also has to do with a council. We cannot just look at majority control either, as many issues such as bonding and charter changes will need a higher than majority vote. As 2025 started the City of Syracuse Common Council started completely Dominated by the Democratic party and ended that way in 2026. The towns work a little differently though as elected supervisors will sit on the town board to make up a voting majority. Focusing on the towns 2025 saw two town Dewitt and Manlius in total Democratic control with all elected town board members being Democratic and they remain that way in 202. Democrats took effective control of Lysander, Salina, Spafford and Geddes for 2026, breaking the log ja in Lysander that resulted from an unfilled vacancy, taking control of the Geddes town board 4-2 even without the Supervisor, winning Supervisor and a town seat in Spafford making it 3-2, and taking total control of Salina changing it from a board that was only in GOP control 3-2 because of the supervisor to a 5-0 board in 2025. Two other towns, Pompey and Marcellus will enter 2026 in a tied position as a GOP town council elect in Marcellus died before being able to take office and in Pompey the Democrat on the board will become Supervisor leaving a vacancy. Both Camillus and Clay went from all GOP control to Democrats being tied on the town board and only the supervisor making it a GOP edge. Democrats improved their holdings by one on the Skaneateles and Onondaga town boards. Democrats ran for town board positions in Cicero and Elbridge but were unsuccessful, although they did secure some representation through the Cicero supervisor race. They did not run candidates for any town boards in Fabius, Lafayette, Otisco, Tully, or Van Buren. Partisan control of the towns at the beginning of 2026 now stands 5 Democrat, 12 GOP, and two split. Four of these towns will have elections in 2026 that could swing control of the board (Clay & Camillus Supervisors, Marcellus, and Pompey Town Board TFV).
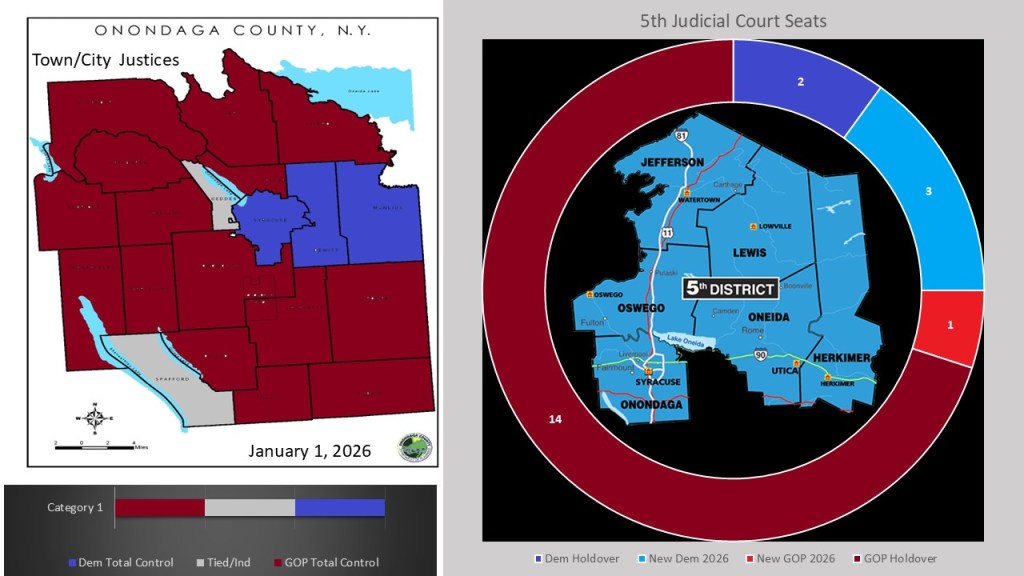
Finally, we look at the Judicial races that were on the ballot in 2025. On one hand the Town Justice races saw the least amount of movement. In fact, the town justice representation stayed the same in 2026 as opposed to the start of 2025. Democrats held onto justice positions in Geddes, Dewitt, and Manlius with all three being unopposed by the GOP, the GOP won a close race for Town Justice in Onondaga keeping it GOP hands, and had uncontested wins in Geddes, Lafayette, Lysander, Salina, Tully and Van Buren. Unmentioned towns had no judicial races this year. The 5th Judicial Supreme Court had four of its 202 members this year. Democrats won three of the four races., This brings Democrats to five sitting members of this large judicial district out of twenty. A Democrat was elected to this seat for the first time since 2020, putting Democrats in their strongest position in this district in years.
That is all for this week’s edition of the #weeklywonk. It also concludes my look back at the 2025 election season> I will now be turning my attention to the registration date for all races on the ballot in 2026, and it is a big year with many town positions and the county legislature moving to even years starting in 2026. Next week I will focus on an overall look at Onondaga County with some big races running countywide in 2026. As always subscribe to dustinczarny.com to get all your election news and content updates.