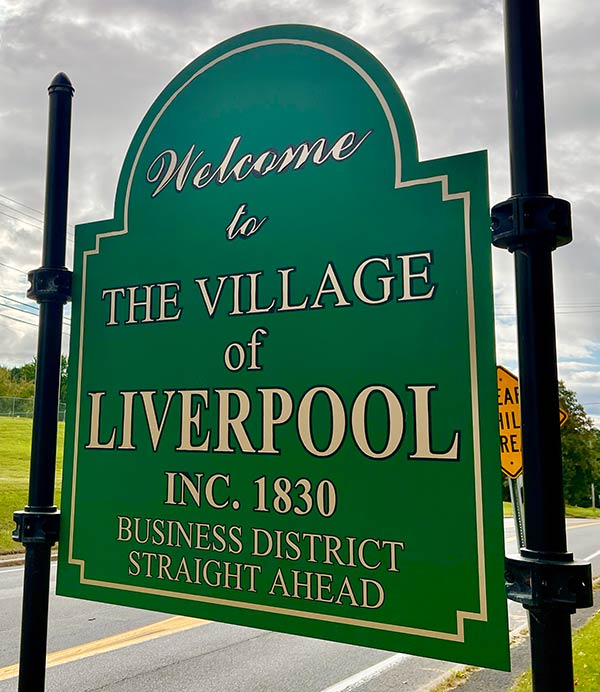
Over the past two months the Onondaga County Board of Elections has been grappling with the residency of Thomas Valerino the Republican and Conservative candidate for the office of Mayor for the Village of Liverpool. There was a voter registration challenge to his registration at 300 Tulip St. and a challenge to his nomination by the Liverpool Republican and Conservative caucuses. Commissioner Ryan and I split on this matter and the issue went before Supreme Court Judge Antonocci. Unfortunately a service issue kept the matter from being decided on its merit. Mr. Valerino remains a candidate for village of Liverpool mayor. Since this matter is now resolved I am releasing my ruling as well as the evidence it was based on as it is also a matter of public record. the text of the ruling is below and all are in files available for download on this page. It is now up to the voters of Liverpool to decide.
August 5, 2025
Ruling on Democratic Commissioners Rulings for The Voter Registration for Tom Valerino as well as GOP and Conservative Caucus Nominations for Village of Liverpool Mayor
Due to the unique nature of the voter registration challenge and two objections to the certificates of nomination regarding Thomas Valerino’s residence and candidacy for mayor of Liverpool I have decided to issue a written ruling in all three matters. This ruling represents my views as Democratic Elections Commissioner solely and not the Board of Elections as a whole. While a court is reviewing these matters, I believe the Onondaga County Board of Elections retains both authority and responsibility to act, as the voter registration challenge and objections were filed with our office. Please note that individual rulings from one commissioner do not reflect an action of the Onondaga County Board of Elections. Both commissioners must rule on these matters. It takes a ruling of both commissioners to cancel voter registration or invalidate a certificate of nomination.
Voter Registration Challenge against Thomas Valerino
Although a court proceeding is currently addressing these matters, the Onondaga County Board of Elections continues to have the authority and responsibility to decide, since the voter registration challenge and related objections were independently submitted to this office.
On June 25th, 2025, Thomas Valerino filed a Voter Registration form in our office, changing his previous address from 360 Lillian Ave in the City of Syracuse, NY to 300 Tullip Street in the village of Liverpool. The Onondaga County Board of Elections processed this registration form on July 8, 2025. On July 14, 2025, Stacey Finney of 207 Birch St. in the Village of Liverpool filed in our office a Post-Registration Challenge Affidavit pursuant to 5-220 of NYS Election Law. Following past practice of our Board Commissioner Ryan and myself asked the Village of Liverpool Police Chief Gerald Unger to investigate the residency of Thomas Valerino pursuant to NYS Election Law 5-702. We also informed Mr. Valerino via certified mail that day of receipt of the challenge and investigation.
On July 21, 2025, the Onondaga County Board of Elections received back the results of the investigation. Chief Unger detailed that 300 Tulip St. Owned by an LLC with no individuals named. 300 Tulip St is zoned exclusively for commercial use. That Mr. Valerino’s current DMV registration is currently 360 Lillian Ave. owned by Michael and Jenna Valerino. Mr. Valerino owns two other properties, 1200-02 W. Onondaga St. and 602 Berwick rd. S both inside the City of Syracuse. NY.
Included in Chief Unger’s investigation is a letter from the Village of Liverpool Code Enforcement division. According to Bill Regan the Code Official for the Village of Liverpool that 300 Tulip St. has three floors, the first of which is a mix of office and retail space, the second and third floor are under construction with building permits for commercial use only. He also noted that 300 Tulip St. has no residential dwelling units currently.
On July 28, 2025, we emailed Joseph Burns, attorney for Mr. Valerino, the result of these findings informing him the Board of Election intended to rule on Tuesday August 5, 2025, on this voter registration challenge asking for any information refuting provided in writing by end of day August 4, 2025.
Guiding my decision in this matter is this section from the NYS Election Law Update provided from NYS Board of Elections:
In determining residency, the Board may consider the voter applicant’s financial independence, business pursuits, employment, income sources, residence for income tax purposes, age, marital status, residence of parents, spouse and children, if any, leaseholds, sites of personal and real property owned by the applicant, motor vehicle and other personal property registration and such other factors that it may reasonably deem necessary to determine the qualification of an applicant to vote within the Board’s jurisdiction (Election Law § 5-104 [2]). “The crucial factor in determining if an individual is qualified to register and vote from a particular residence is whether he or she has manifested an intent to adopt that residence as a permanent and principal home coupled by his or her physical presence there ‘without any aura of sham’” (Matter of Thompson v Karben, 295 AD2d 438, 439 [2d Dept 2002], citing People v O’Hara, 96 NY2d 378, 385 [2001], quoting Matter of Gallagher v Dinkins, 41 AD2d 946, 947 [2d Dept 1973]; aff’d 32 NY2d 839 [1973]).
The Onondaga County Board of Elections has before us the ability and means to determine the validity of Mr. Valerino’s voter registration. The investigation by the Village of Liverpool police shows that Mr. Valerino does not now, nor can he in the future, live at 300 Tulip St. The building is zoned exclusively for commercial use, with no residential units, permits, or plans for rezoning. His current DMV listing of 360 Lillian Ave as well as no attachment to other residential properties in the City of Syracuse is further evidence that Mr. Valerino does not reside nor any attempt to adopt 300 Tullip St as his address.
Thus, pursuant to NYS Election Law 5-702, I rule to uphold the challenge to Mr. Valerino’s registration at 300 Tulip St. in the Village of Liverpool in New York. The Onondaga County Board of Elections should immediately cancel the registration of Thomas Valerino as prescribed in NYS Election Law 5-402.
Caucus Certificate of Nomination Challenges for Liverpool Mayor
for the GOP and Conservative parties.
On July 11, 2025, the Onondaga County Board of Elections received a Certificate of Nomination from the Republican party for Village of Liverpool Mayor nominating Thomas Valerino at 300 Tulip St. in the Village of Liverpool. A General Objection was timely filed by Kelly Roman 360 Sycamore St. Liverpool, NY 13088 on July 14th, 2025, with Specific Objections following on July 21. 2025. An amended Certificate of Nomination, postmarked July 23, 2025, was determined to be insufficient due to the omission of the Village of Liverpool. The amended certificate had Mr. Valerino’s residence at 360 Lillian Ave. in the City of Syracuse, NY.
On July 24, 2025, the Onondaga County Board of Elections received a Certificate of Nomination from the Conservative party for Village of Liverpool Mayor nominating Thomas Valerino at 300 Tulip St. in the Village of Liverpool. A General Objection was timely filed by Stacey Finney of 207 Birch St. Liverpool, NY 13088 on July 24, 2025, with Specific Objections also on July 24, 2025.
While both these certificates are from separate parties and separate objectors, the underlying facts and objections were the same. That Mr. Valerino did not reside at 300 Tulip St. and cited the voter registration challenge filed. The Onondaga County Board of Elections scheduled a joint hearing for all parties, as required by NYS Election law, on July 28, 2025. Joseph Burns, representing Mr. Valerino, was allowed to participate via Zoom. In the hearing we adjourned to give M. Burns the chance to review the Village of Liverpool report on Mr. Valerino’s residency and giving him the opportunity to correspond any further information by close of business on August 4, 2025, with a promise to rule on Mr. Valerino’s voter registration challenge and both caucuses on Tuesday August 5, 2025.
Mr. Burns responded on August 4, 2025. In his response he stated there was no proof of service for Stacy Finney’s challenge to the conservative caucus certificate. Upon inspection of the file, Mr. Burns is correct. Service for the challenge to the Conservative nomination was never timely filed with the Onondaga County Board of Elections. Thus, I rule that the Conservative Certificate of Nomination for the Village of Liverpool for the office of Mayor is valid due to lack of proof of service and Mr. Valerino’s name should appear on the 2025 General Election Ballot for the Conservative line for Mayor of Village of Liverpool.
Mr. Burns also cited cases about the eligibility to stand as a candidate for public office regardless of residency. That issue is not being objected to. Mr. Valerino can run for the Village of Liverpool Mayor while not being a resident of the Village if he establishes residency by Election Day. That is not what is being objected to here. It is whether accurate information as to his residency was provided on the Certificate of Nomination.
Mr. Burns raises the notion of substantial compliance, however in this case it was not a mere typo or wrong town listed, but an address which Mr. Valerino could not be registered at due to the information presented to the board during the voter registration challenge.
Finally, Mr. Burns the Board of Elections limited role as a ministerial body. All material I have relied on is what is before the board through our ministerial functions regarding both the registration challenge and hearing process. The investigation by the Village of Liverpool police is before the board through the process outlined in NYS Election Law 5-702. It is wholly proper to consider this when considering Mr. Valerino’s residence and subsequently whether the address is listed properly on the certificates of nomination.
I do note that neither Mr. Valerino or Mr. Burns has addressed or refuted the investigation of the Village of Liverpool police regarding the status of his residency or the ability of 300 Tulip St. to act as a residence.
Guiding my ruling in this matter are these cases from the NYS Election Law Update provided by the NYS Board of Elections:
Each sheet of petition must properly state the place of residence (Winn v Washington County Board of Elections, 196 AD2d 674 [3d Dept 1993], lv denied, 82 NY2d 654 [1993]).
The address information must be sufficient to identify the candidate without misleading or confusing the signatories to the petition (Eisenberg v Strasser, 307 AD2d 1053 [2d Dept 2003]).
Candidate must reside at address shown on petition (Finneran v Hayduk, 64 AD2d 937 [2d Dept 1978], aff’d. 45 NY2d 797 [1978]; Bastone v Cocco, 270 AD2d 950 [3d Dept 1996], lv denied 88 NY2d 971; Brigandi v Barasch, 144 AD2d 177 [3d 31 Dept 1988], lv denied 72 NY2d 810; see also Walkes v Farrakhan, 286 AD2d 464 [2d Dept 2001]).
These cases involve petitions, but the same rule should apply to caucus nominating certificates used for ballot access. Thus, I conclude that the address for a candidate on the Certificate of nomination should be the residence address of the candidate. Given my earlier ruling on the validity of Mr. Valerino’s stated residency of 300 Tulip St. and that is the address on both certificates of nominations I believe Mr. Valerino’s residency was incorrectly stated on the nomination certificates.
Thus, I rule that the Republican Certificate of Nomination for the Village of Liverpool for the office of Mayor is invalid and Mr. Valerino’s name should NOT appear on the 2025 General Election Ballot for the Republican line for Mayor of Village of Liverpool.
_______________
Dustin M. Czarny
Democratic Elections Commissioner