Today I talk about the village elections happening on Wednesday March 18, 2026. Three villages, Manlius, Marcellus, and Minoa are holding their village elections this year. Why on a Wednesday? Why in March? Why do they have different polling hours? Why do villages get to choose their election days and how can it be changed? The answer to those questions and more in this week’s episode. Enjoy.
Subscribe to dustinczarny.com for all content and election news updates
Welcome back to the #weeklywonk. This is my weekly data article that I host on dustinczarny.com. Each week I dive into the electoral and registration data that affect races in Onondaga County and New York State. I am at the end of my 6-part series looking at towns who nominate Democratic candidates by petitions that started last Tuesday. This week is part 6 of this series investigating the Town of Spafford. At first look it is a small rural town that should lean Republican. In practice it is one of Onondaga County’s most evenly contested towns.
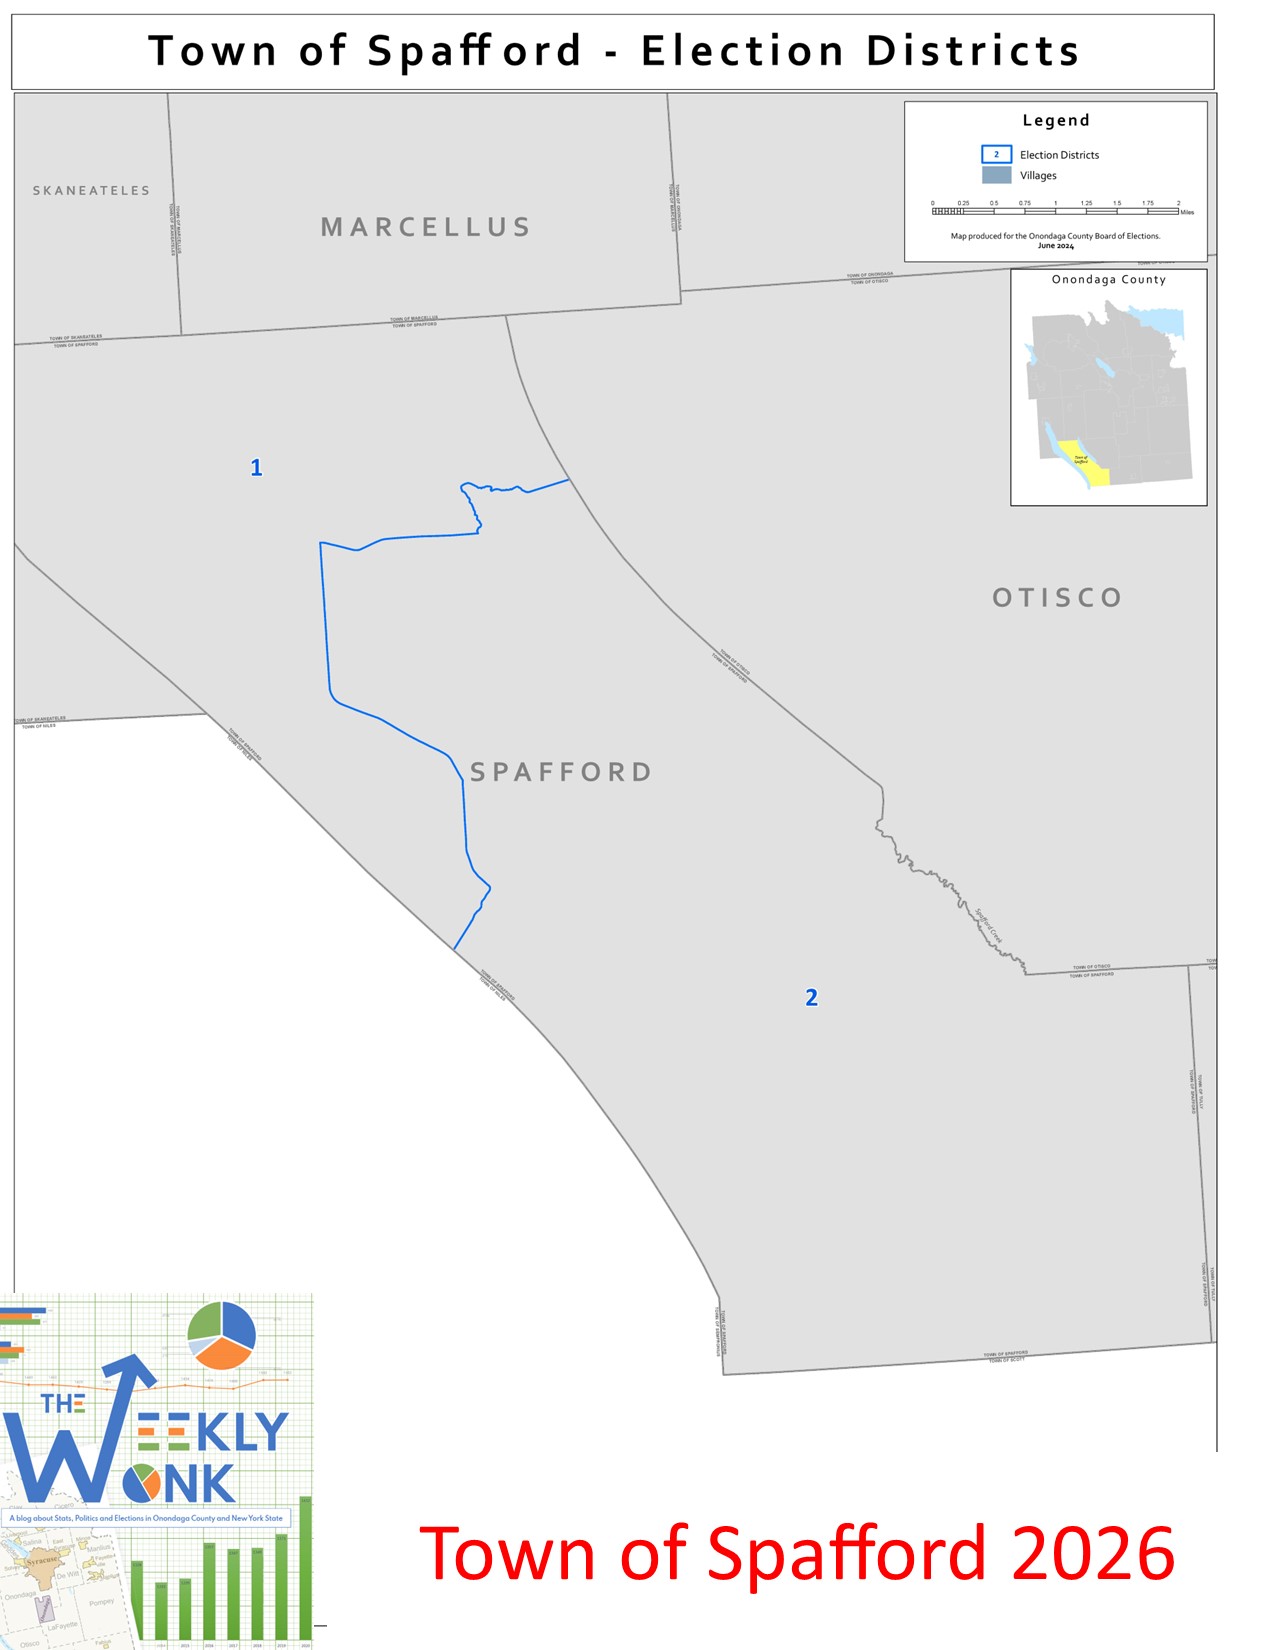
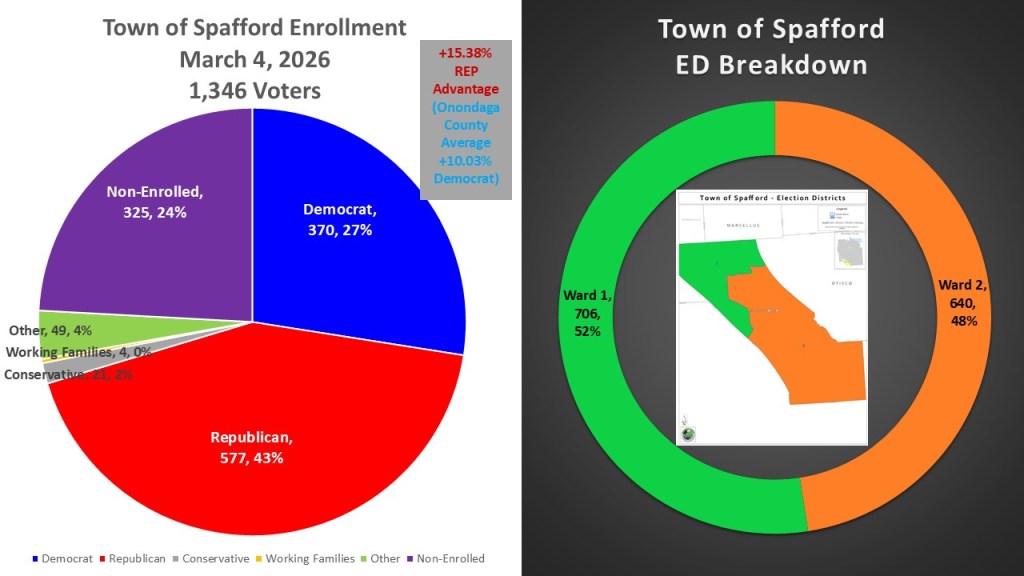
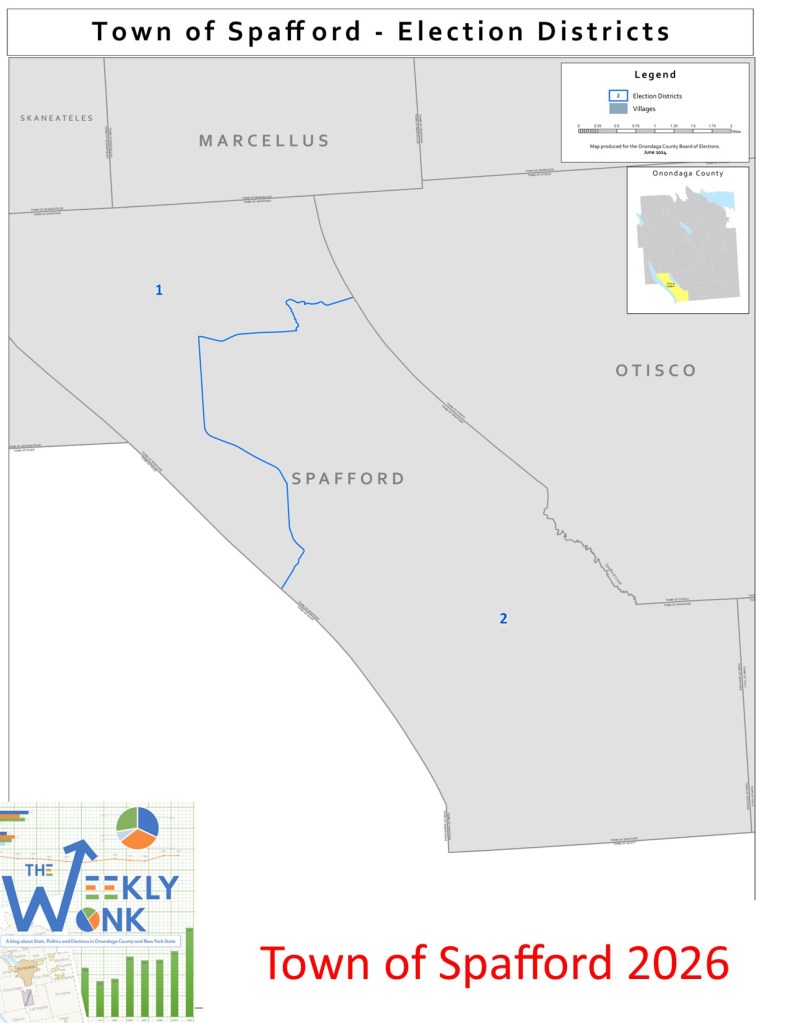
The town of Spafford is one of the smaller towns in our county with just 1,346 voters. There are 370 Democrats with just 27%. The Republicans hold the plurality with 577 voters (43%). The non-enrolled in this town is in third place with just 325 voters (24%). The Other (49, 4%), Conservative (21, 2%), and Working Families (4. Zero percent) round out the population. Spafford is so small it only has two election districts in it. Election district one in the northwest portion of the town is the largest with 706 voters (52%). Election district two is in the southeastern portion of the town and has 640 voters (48%).
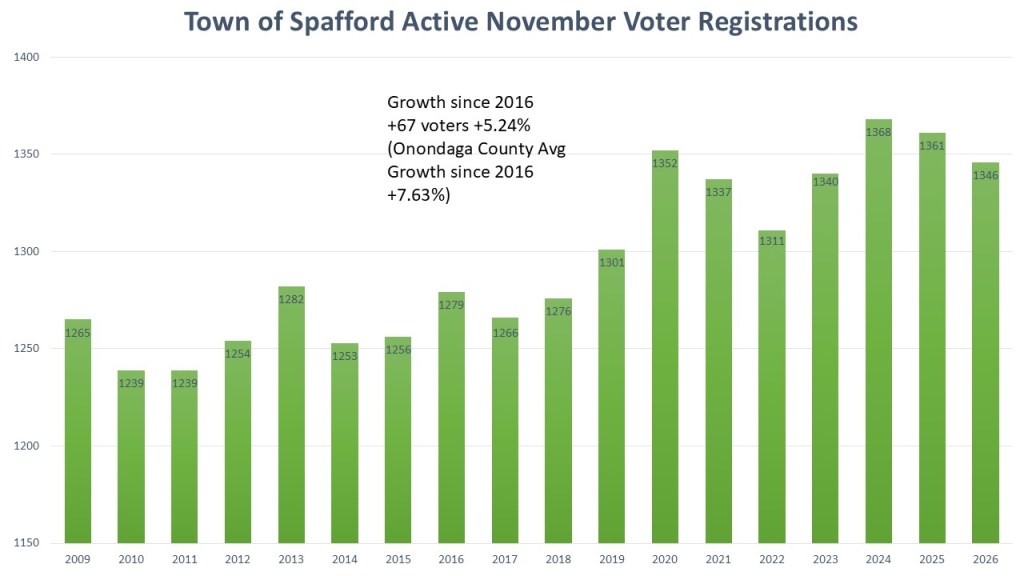
Not only is Spafford one of the smallest towns, but it is also growing at a rate slower than the rest of Onondaga County. Like most areas of Onondaga County and indeed New York state. The growth came about after 2019 with easier voter registration laws thanks to the Democratic takeover of New York State government. Looking back ten years, the Town of Spafford added sixty-seven voters, a growth of 5.24%. This is slightly bellowing the growth rate for Onondaga County as a whole (+7.63%) during the same period.
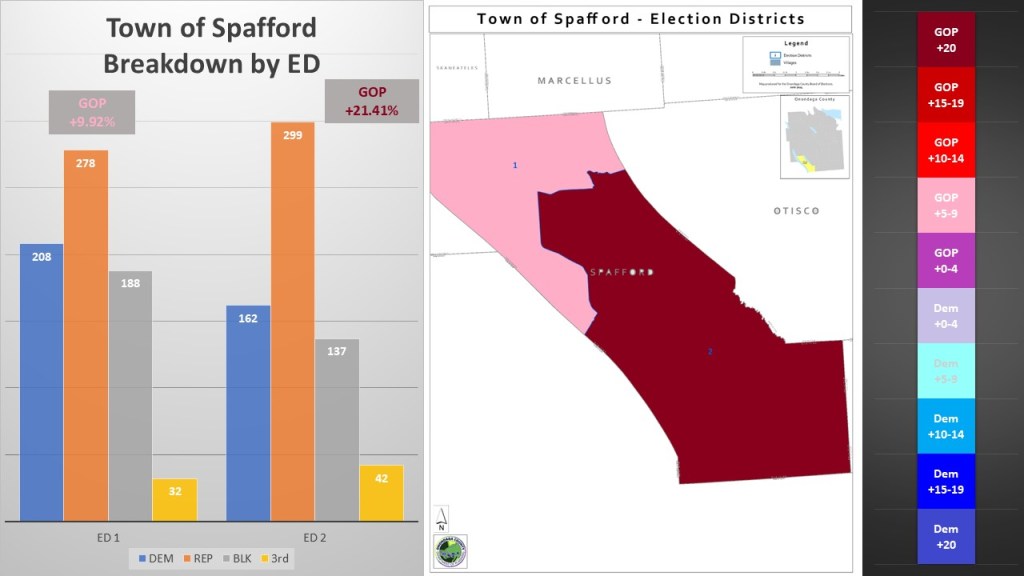
The Town of Spafford’s small stature makes it hard to delve deep into its different areas. However, even though there are only two election districts, we do see diversity. The. northern more populous election district is only a lean Republican district. The GOP has a +9.92% enrollment advantage here. The southern less populous district is one of the more GOP dominant eds in the county. The Republicans have a +21.41% enrollment advantage here. Despite the GOP dominance, in neither election district do the Democrats drop below second place. That is an important distinction in this rural town.
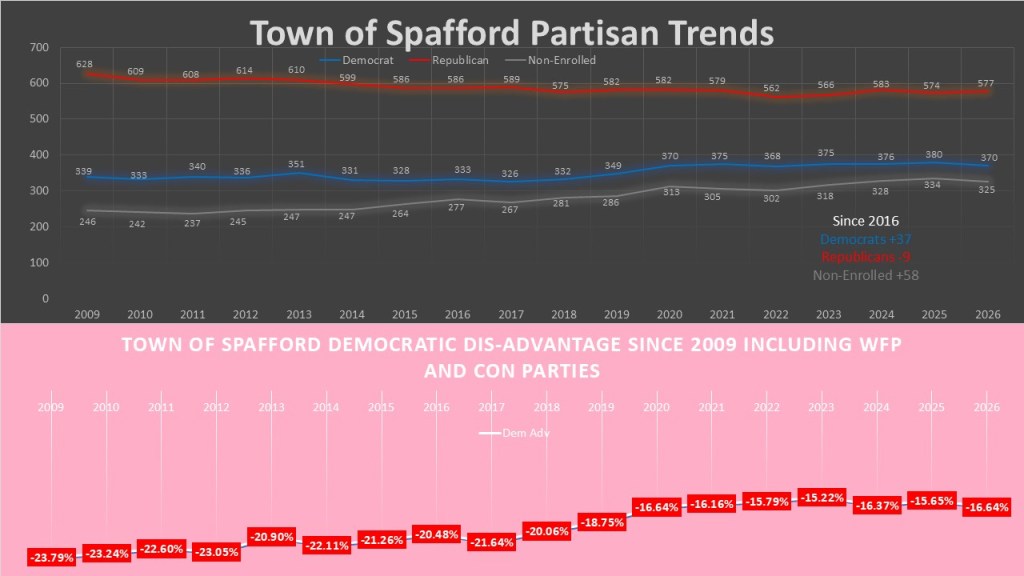
Spafford is a pretty static town. Despite this Democrats are making gains in this town. Since 2016 the Democrats have gained thirty-seven voters. The republicans have lost nine voters during that time. The non-enrolled have gained fifty-eight voters. In small towns the Conservative population can have a larger effect in tilting the town to the right. Even here Democrats and the left are making gains. In 2009 The combined GOP and Conservative dominance of Spafford gave a Democratic disadvantage of -23.79%. It has shrunk to -16.64% this year. Another sign that Spafford is not as republican as you might suspect.
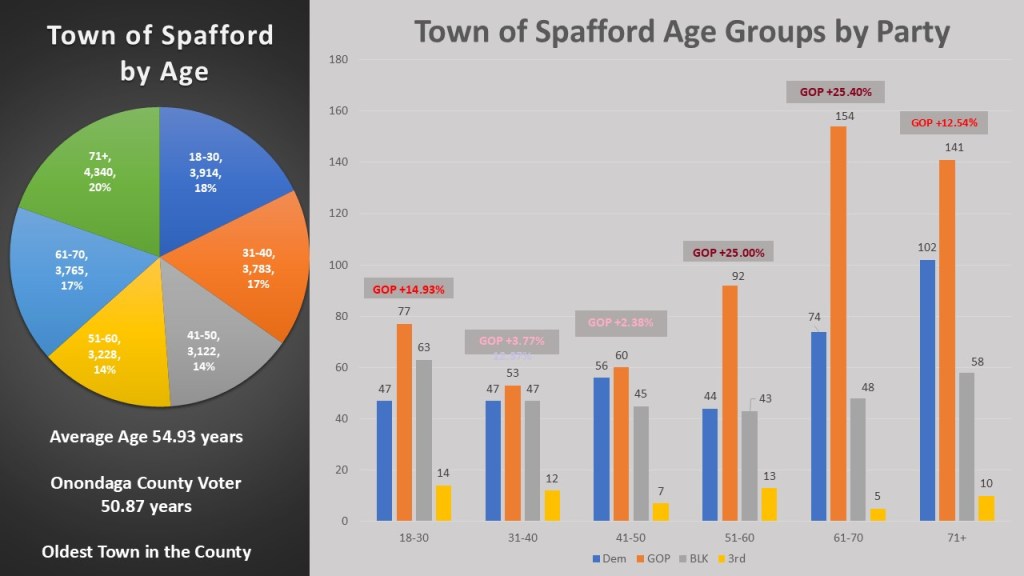
Spafford has another distinction besides being the most competitive town. It is also the oldest. The average voter in Spafford is 54.93 years old. That is much older than the Onondaga County average of 50.87 years old. In fact, it is the oldest town in Onondaga county and as you might expect the 91+ age group is the largest. We do find diversity in the partisan makeup of the age groups. Like always the Democrats do better under fifty age groups and the GOP does better in the older groups. Still every group the GOP leads, even in the 18-30 group. And we do not see the dominance of the non-enrolled in the youngest groups like we have with other towns.
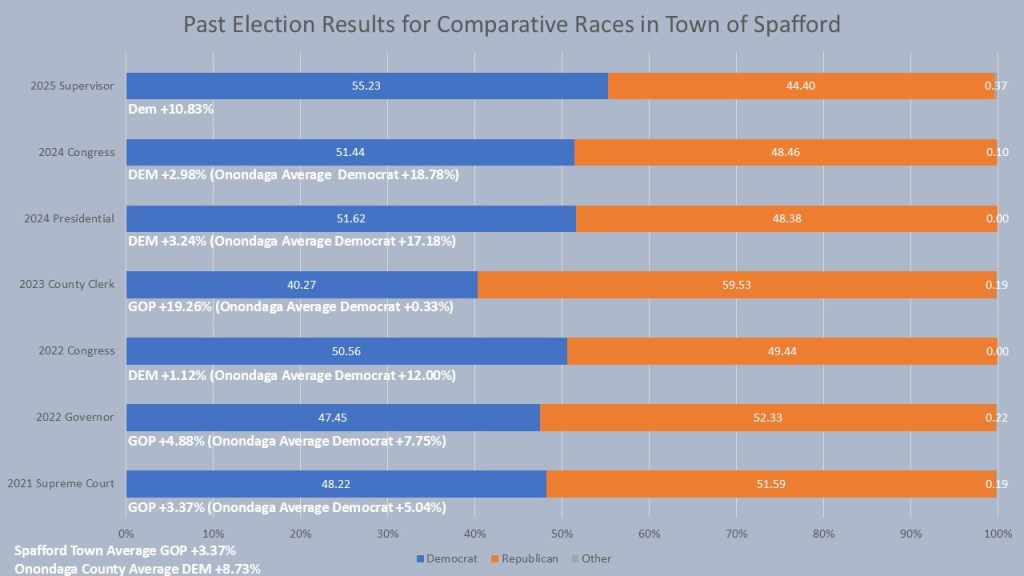
The most surprising facet of Spafford is its ability to elect Democrats despite the seeming registration dominance of the Republican party. In the past 15 years, the town of Spafford elected Democrats, sometimes gaining control of both the town board and Supervisor positions. In 2025 the pendulum again swung back to the Democrats winning the Supervisor race by 10.83% and gaining control of the board. When we look at the six comparative races, we see that Spafford lives up to the very epitome of a battleground town. Democrats won the 2024 Presidential and Congressional race as well as the 2022 congressional race. Republicans won the 22021 Supreme Court and 2023 County Clerk along 2022 Governor’s race. All were within five points except the 2023 County Clerk. The GOP averages a 3.37% margin of victory wh9ich is about a ten-point swing form the county average of Democrats +8.73%.
That is, it for this edition of the #weeklywonk. This ends my 6-part series on towns who petition for Democratic candidates in 2026. Next, I start another series, this time on the New York State races. This 9-part se. s will examine the New York, fifth judicial, Congressional, and six state legislature races in our county. Next week we begin our journey by looking at New York State as a whole. As always you can subscribe to dustinczarny.com for all content and election news updates.
This week’s episodes focuses on the Save America ACT and what a disaster it would be for NY Elections. I go through it along with the MEGA proposals and possible executive orders as well as address the suspect constitutionality of it all. Enjoy,
Subscribe to dustinczarny.com for all content and election news updates
Welcome back to the #weeklywonk. This is my weekly data article that I host on dustinczarny.com. Each week I dive into the electoral and registration data that affect races in Onondaga County and New York State. I am in the middle of my 6-part series looking at towns who nominate Democratic candidates by petitions that started last Tuesday. This week is part 5 of this series investigating the Town of Salina. Home last year to the Salina Sweep that saw Democrats take over the town government and both county legislature seats that cross into this town. This town has become the bell weather town for politics in Onondaga County.
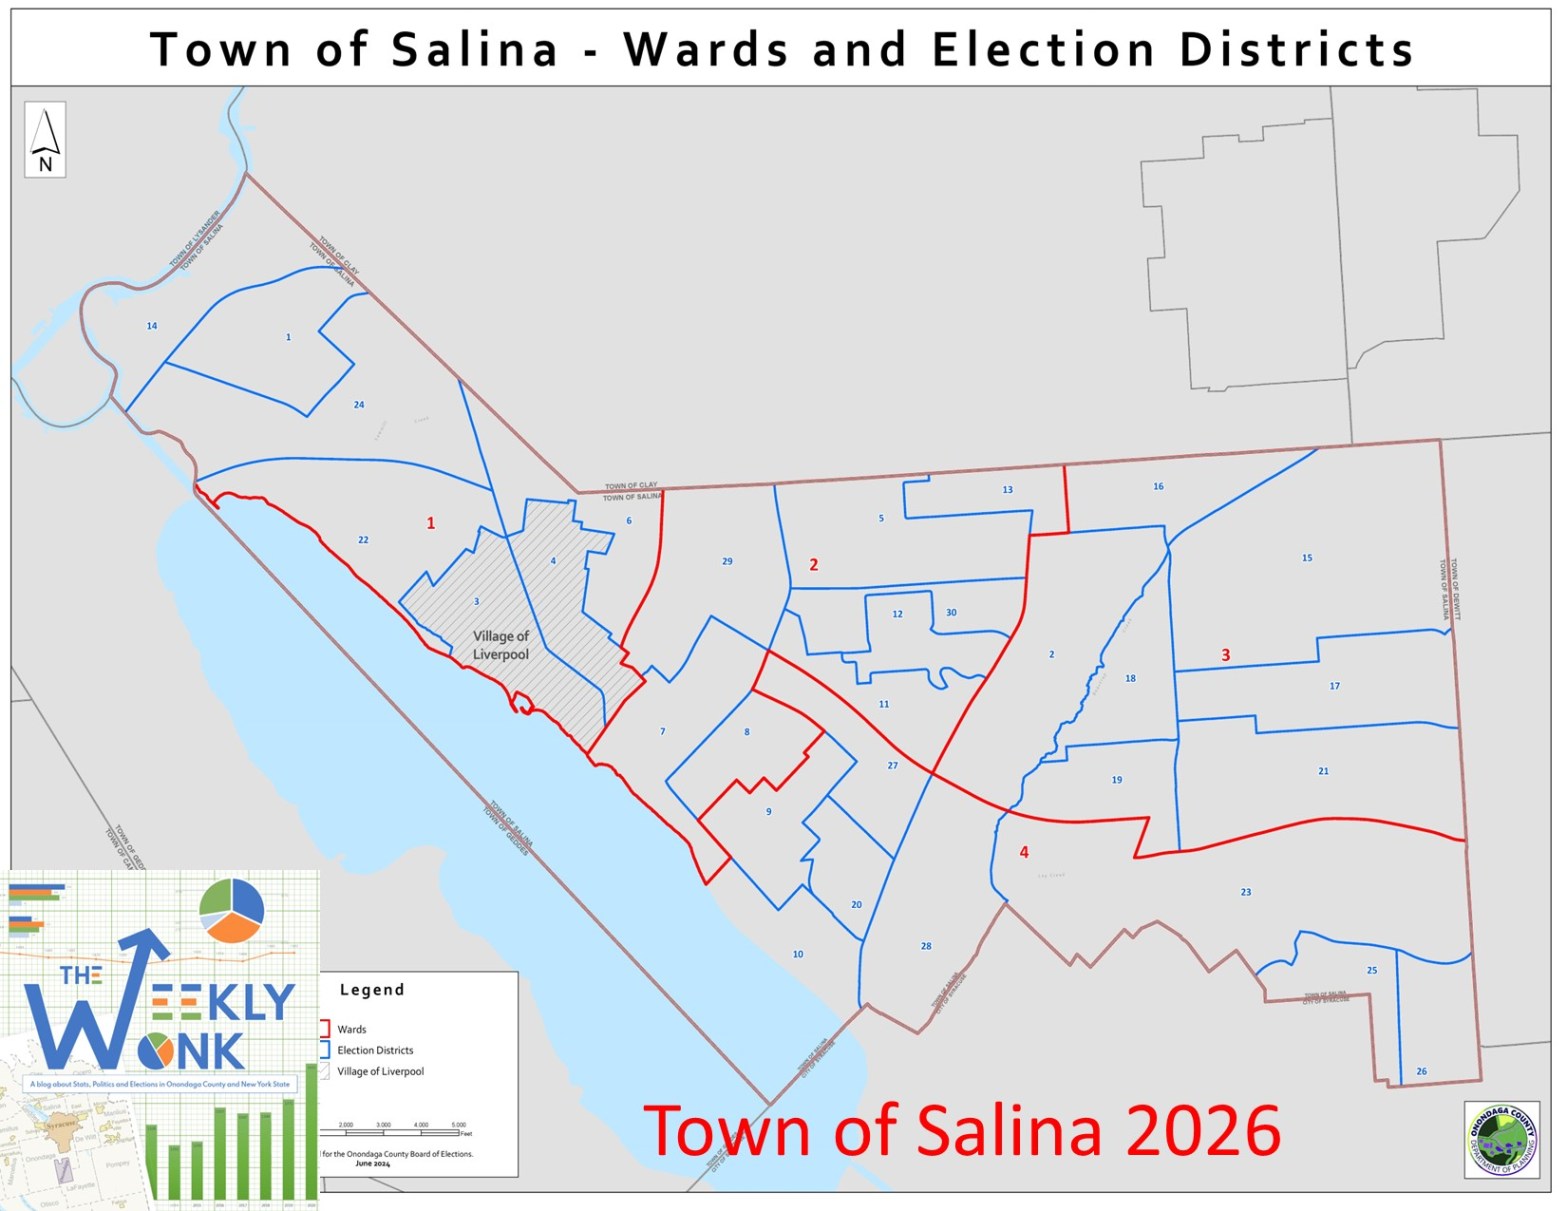
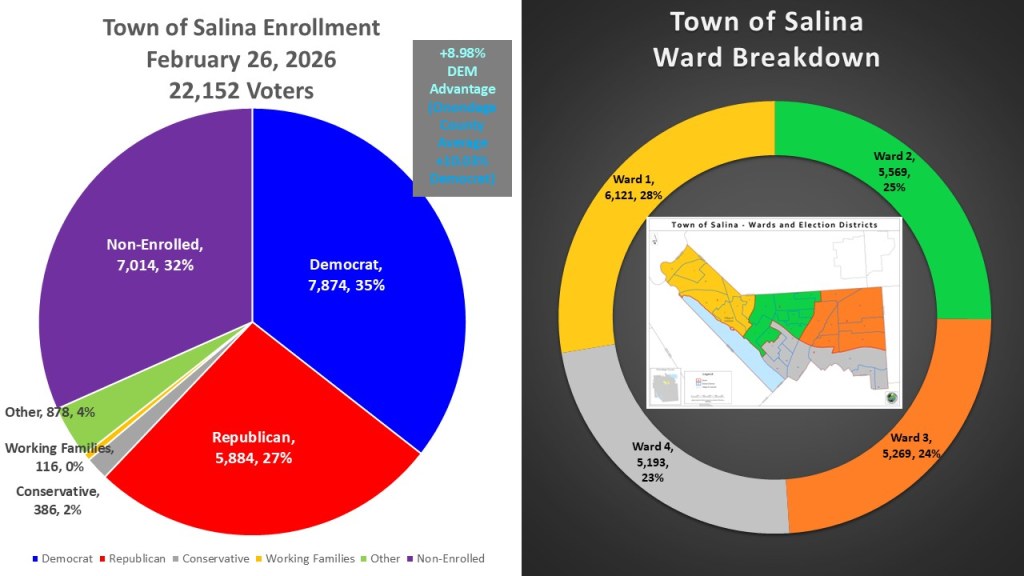
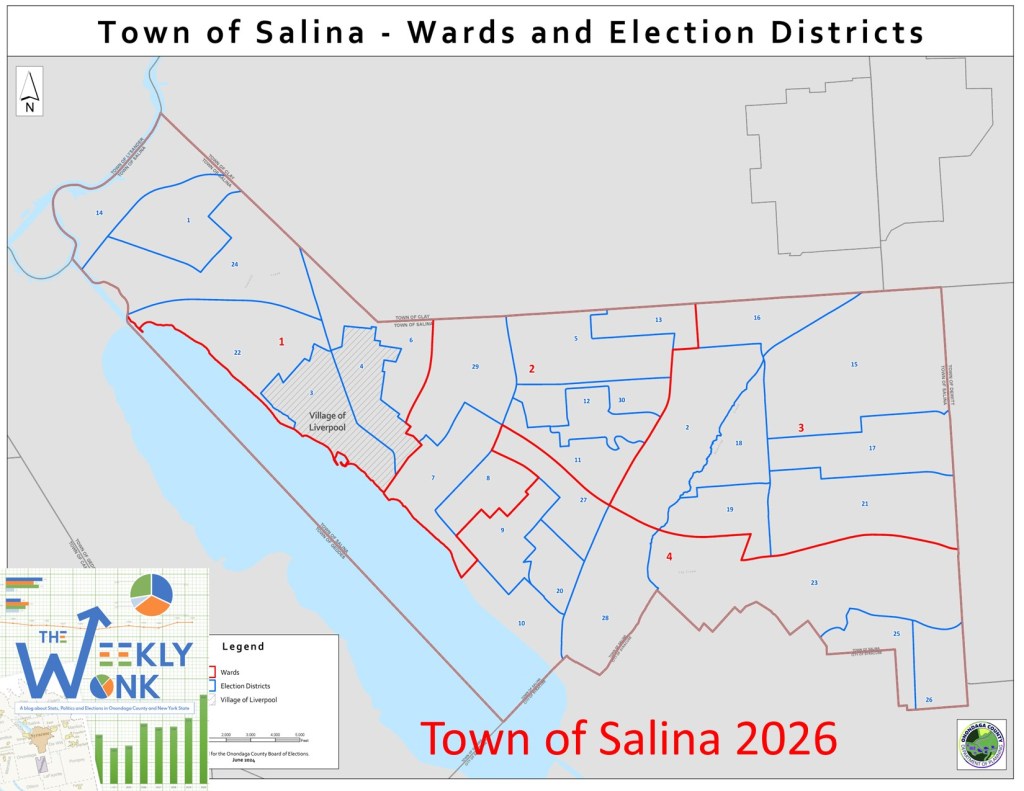
One of the reasons I consider Salina to be the bell weather town of Onondaga County is how similar the makeup is to the County as a whole. As of February 26, 2026, Salina had 22,152 voters. 7,874 voters are Democrat (35%). In second place are the non-enrolled voter block of 7,014 voters (32%). The 5,884 Republicans (27%) are in third place. Voters enrolled in various other parties (878, 4%), Conservative (386, 2%) Working Families (116, <1%) make up the rest of the town. The Democrats have a +8.98% partisan difference which is like Onondaga County as a whole (Dem +10.03%). Salina is one of only two towns in Onondaga County that let their Town Boards in districts (called wards) as opposed to town wide. The four town wards are of varied sizes because Salina did not redistrict in 2021 keeping the same maps even though the spread was only slightly below the legal rate of 5% population. It is highly likely that redistricting will be necessary in 2031.
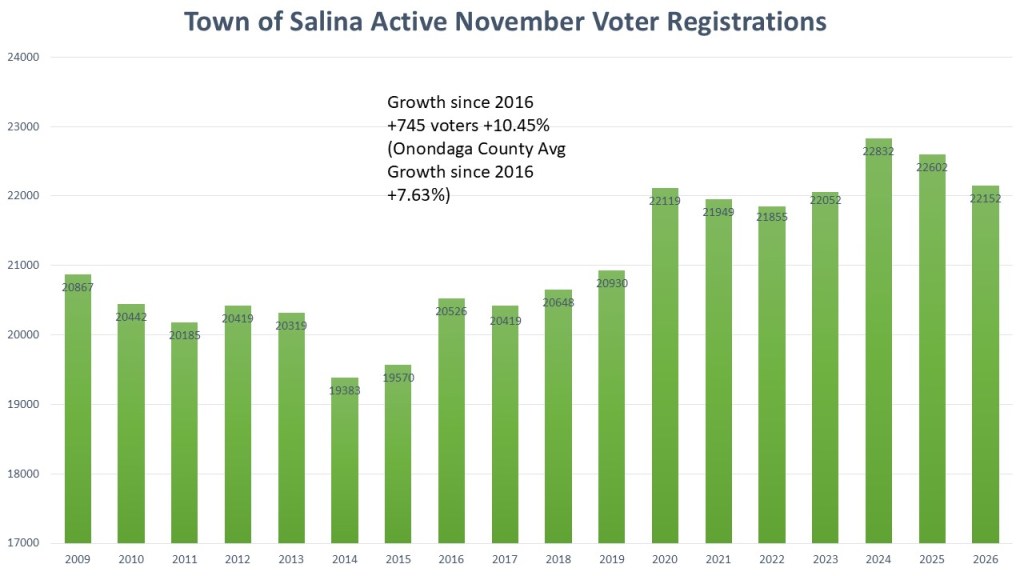
Salina has grown a little faster than Onondaga County as a whole. Since 2016 Salina has added 745 voters. That is a growth rate of 1045%. This is slightly ahead of the pace of Onondaga County of 7.63%. Like most areas of our county, we saw major growth happen between 2020 and 2024. This is due to the simpler registration procedures established by laws enacted from 2019 to 2023. After the high point of the 2024 presidential election, participation typically drops.
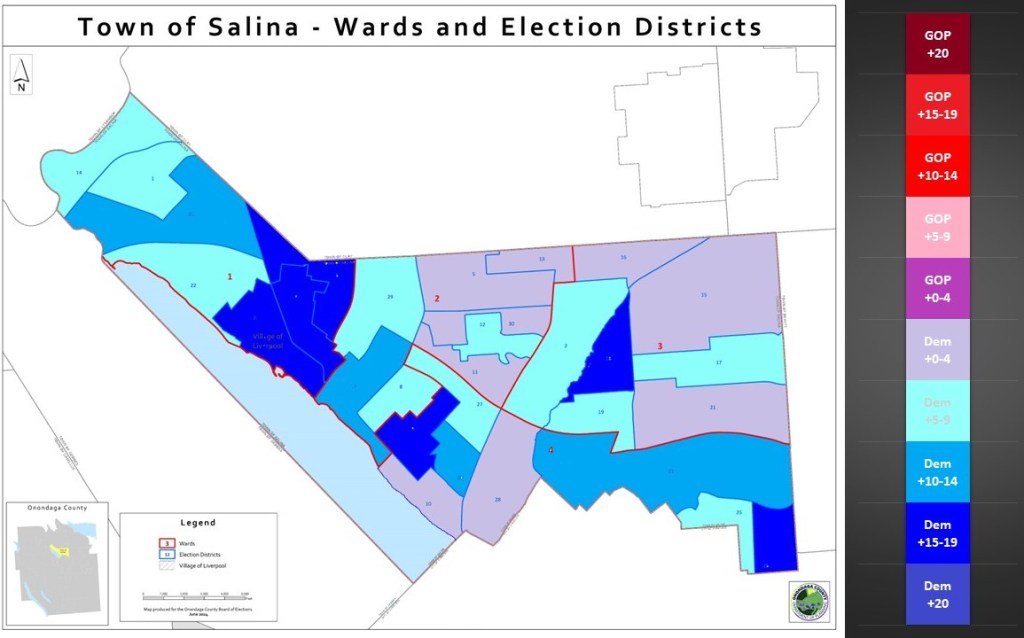
When looking at the heat map of Salina we can see there are no election districts where the GOP even have borderline registration advantage. We do, however, see a pattern with Salina. In the northwestern region of Liverpool, Democratic candidates are significantly preferred, with certain precincts demonstrating a 15-19% advantage. The village of Liverpool serves as an example of this. There are pockets of heavier democratic leans in the middle and eastern portion of the town. However, the farther west we go the more likely the election districts have a borderline Democratic lean.
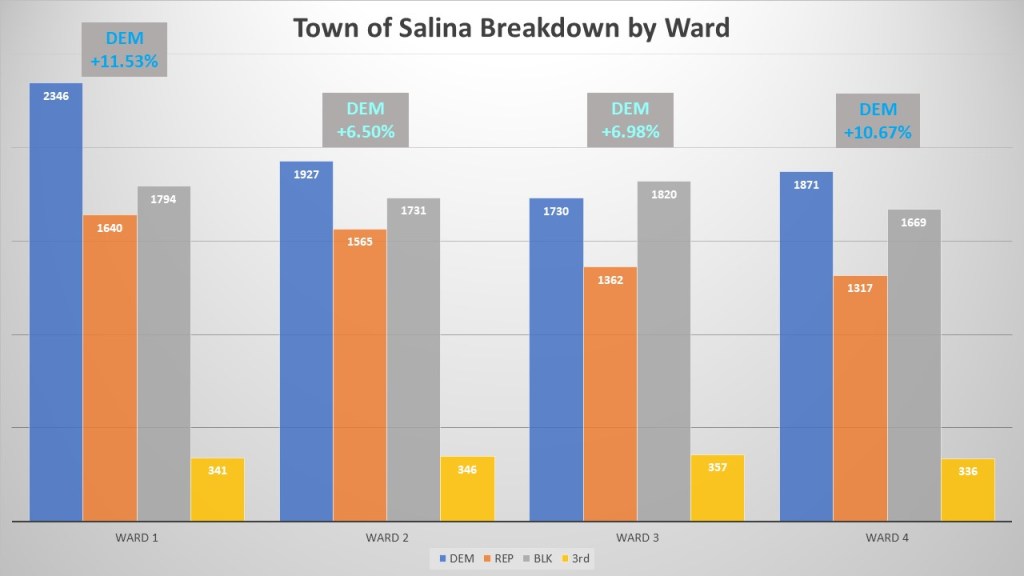
Focusing in on the four wards of Salina there are few differences between them All four wards have Democratic leans with Ward 1 having a +11.53% partisan advantage, followed by Ward 4 (+10.67%) then ward 3 (+6.98%) and last ward 2 (+6.50%). All four wards the GOP are in third place of the registered voters, however ward three has the rare instance where the non-enrolled outnumber both the Democrats and the GOP individually. Each district now has a Democratic officeholder whose views match the area’s voter registration patterns, something that has not happened in years.
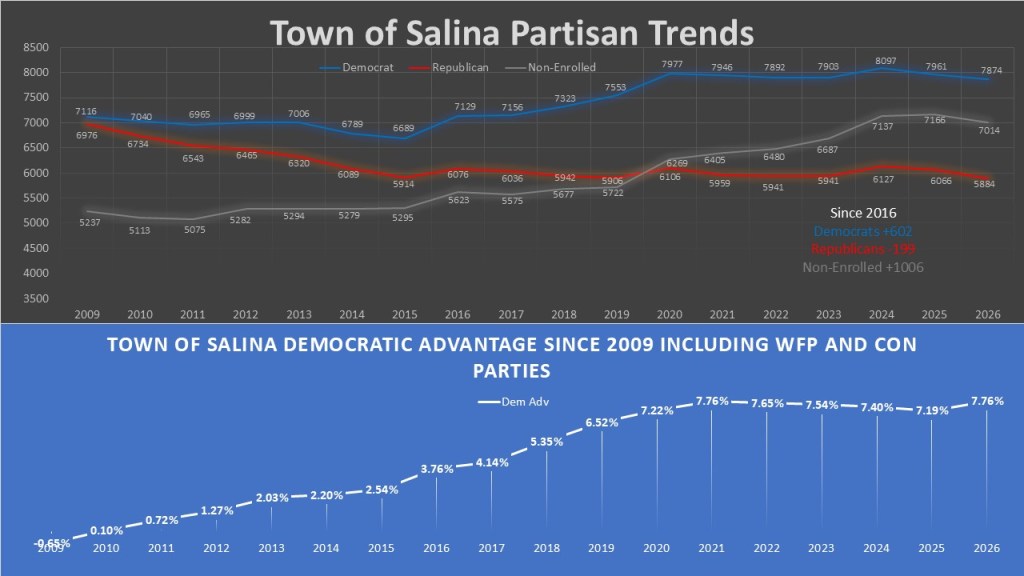
Salina has always been a borderline town, despite the GOP dominance in its office holders. In 2009, both Democrats and Republicans held equal representation in political affiliation within the town. This was steadily changing into 2016. Since 2016 though Democrats added 602 voters. The republicans have lost 199 voters since 2016. The non-enrolled is the biggest gainer during that period with +1006 voters. When looking at the ideological trend we see that the left (Democrats and WFP) has steadily grown in dominance when compared to the right (GOP and Conservatives). The current advantage of 7.76% is the highest on record, though tied with 2021.
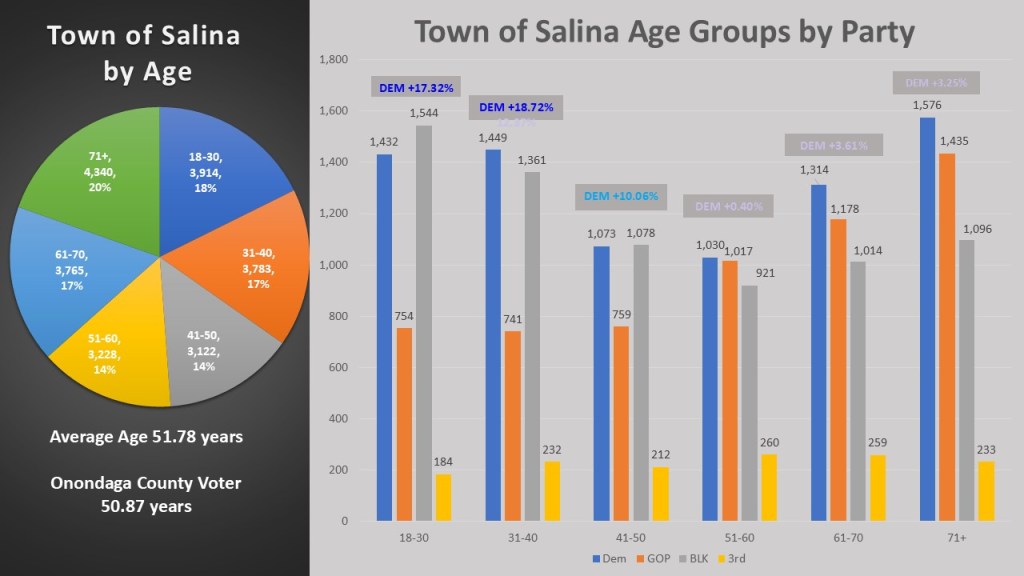
This year I am adding age to the metrics I am using to analyze political subdivisions this year. The average age of Salina voters is 51.78 years old, which is slightly higher that Onondaga County average of 50.87 years. The interesting part of Salina is the oldest age group of 71+ (20%) is the most populous but closely followed by the youngest age group of 18-30 (18%). We also see the dominance of the non-enrolled in the younger age groups. The non-enrolled outnumber the GOP in all three age groups below 50 but also outnumber the Democrats in the 18-30 and 41-50 age groups. Still Democrats dominate all three younger groups in enrollment advantage. The three age groups over fifty-one are borderline Democratic groups with the traditional order of Democrats leading followed by GOP in second place and the non-enrolled in third.
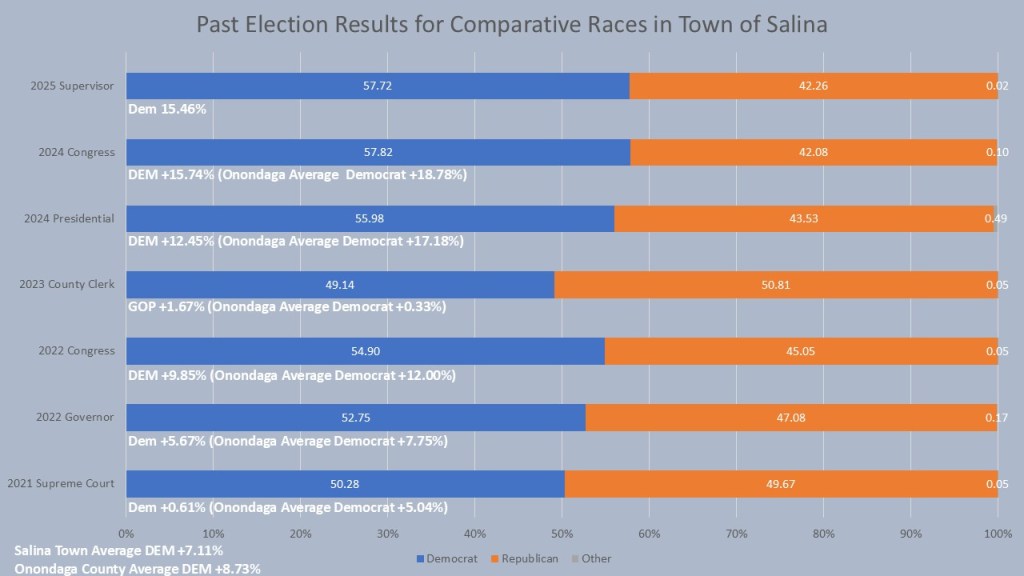
Another piece of evidence for Salina being the bell weather town for Onondaga County is the performance in the six comparative races we are using this year. The only GOP to win these six races was the impossibly close 2023 County Clerk race, and only by 1.67% (as opposed to the county overall result of Democrat +0.33%). Every race Salina ran just 2-3% to the right of Onondaga County, one of the closest we have analyzed so far. In Salina, the six comparative races had an average margin of Democrat +7.11%, which is statistically similar to Onondaga County’s average of Democrat +8.73%. This is why the Supervisor race in Salina was such a surprise with Raul Huerta winning by 15.46% as part of the Salina sweep.
That is, it is for this week’s edition of the #weeklywonk. Next week I finish my 6-part series looking at towns that nominate democratic candidates by petition. I will look at the small town of Spafford that has shown a large history of bucking their republican enrollment to elect Democratic representatives. Next, I will look at the big races this fall as the NYSBOE has released their enrollments for multi county districts so we can now look at NY State, Congress, State Senate and assembly and Supreme Court races on the ballot this fall. As always you can subscribe to dustinczarny.com for all content and election news updates.
This week’s episode I talk about the upcoming start of the Designating petition period on Tuesday. I go over how we use designating petitions to get on the ballot, how they create primaries, and what goes into determining minimum signatures. Enjoy.
Subscribe to dustincczarny.com for all content and election news updates
Welcome back to the #weeklywonk. This is my weekly data article that I host on dustinczarny.com. Each week I dive into the electoral and registration data that affect races in Onondaga County and New York State. I am in the middle of my 6-part series looking at towns who nominate Democratic candidates by petitions starting February 24, 2026. This week is part 4 of this series looking at the Town of Onondaga. This is one of the battleground towns this year with Town Supervisor and County leg seats up in an even town.
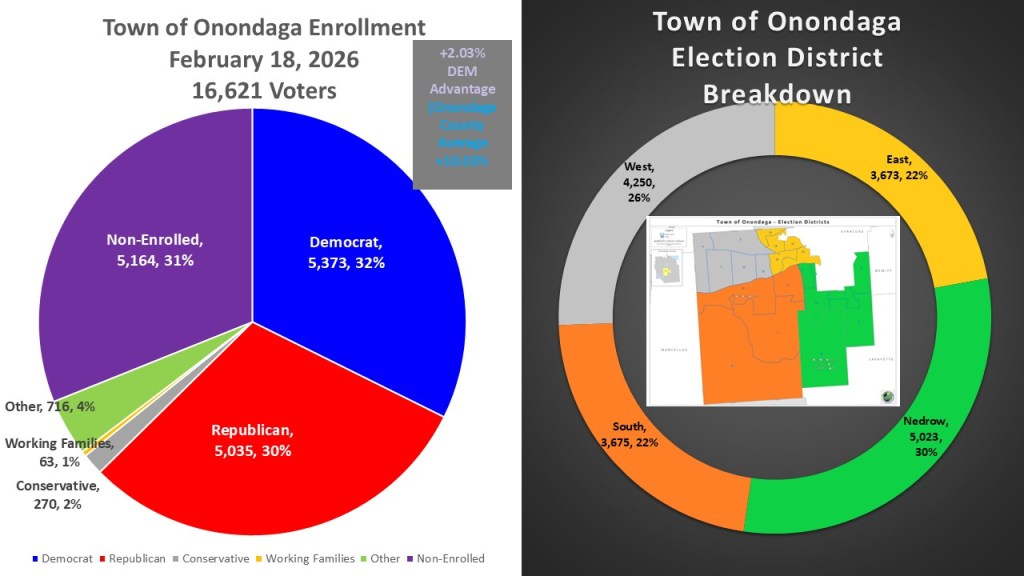
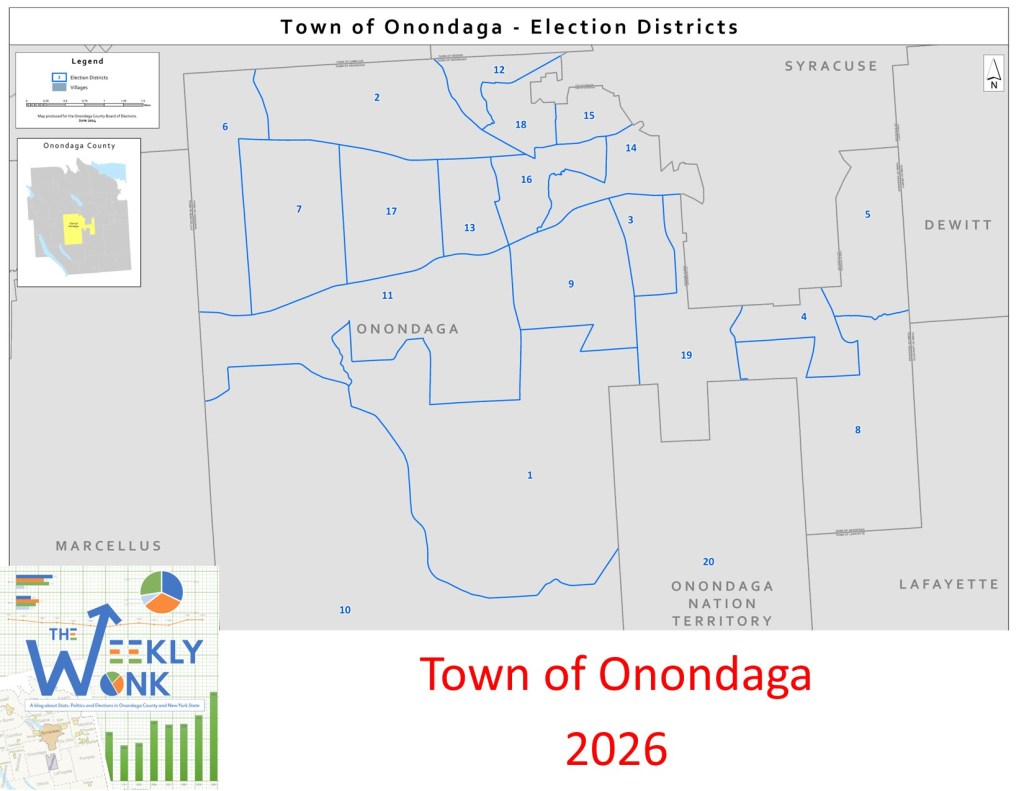
How even is the town of Onondaga Registration? Democrats have the plurality with 5,373 voters (32%). Non-Enrolled are in second place with 5,164 (31%). The Republicans are in third place with 5,035 voters (30%). Other (716 voters, 4%) Conservatives (270, 2%, and Working Families (63, 1%) make up the rest of the 16,621 voters. Democrats only have a +2.03% borderline registration advantage which makes Onondaga one of the closest towns in our County. Despite its size it is in mostly one county legislative district, OCL 11, except for the Onondaga Nation which is in OCL 12. There are no separate villages in the town. Onondaga elects all town officials in town-wide elections. Thus, to look at the town in a regional sense I have broken it by ED into four distinct sections. The western section (4,250 voters 26%) that borders Camillus and Geddes. South Onondaga (3,675 22%) is the more agrarian portion of the town. The East portion (3,673, 22%) which is densely packed suburban style bordering the valley of Syracuse. Finally, the Nedrow section (5,023, 30% wrapping around the south valley of Syracuse including the Onondaga Nation territory). These are not perfect regional breaks but will allow us to look at this large Town in segments.
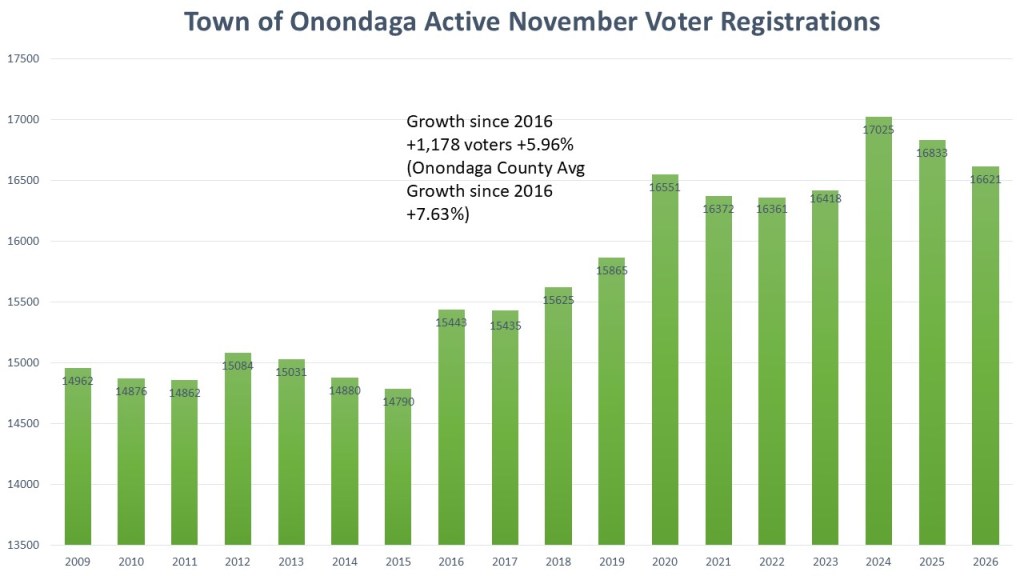
The growth of Onondaga has mirrored the growth of Onondaga as a whole. The growth of voters started in 2016 but dramatically increased in 2020 after the registration changes by the New York State Legislature took effect. The high-water mark was the 2024 election, and we are seeing the normal retreat that happens in the following months of a Presidential election. 2016 is the standard area of reference for us when it comes to growth and we can see that the Town of Onondaga grew by 1,178 voters during that time (+5.96%). This is like the growth rate in Onondaga County of +7.63% since 2016.
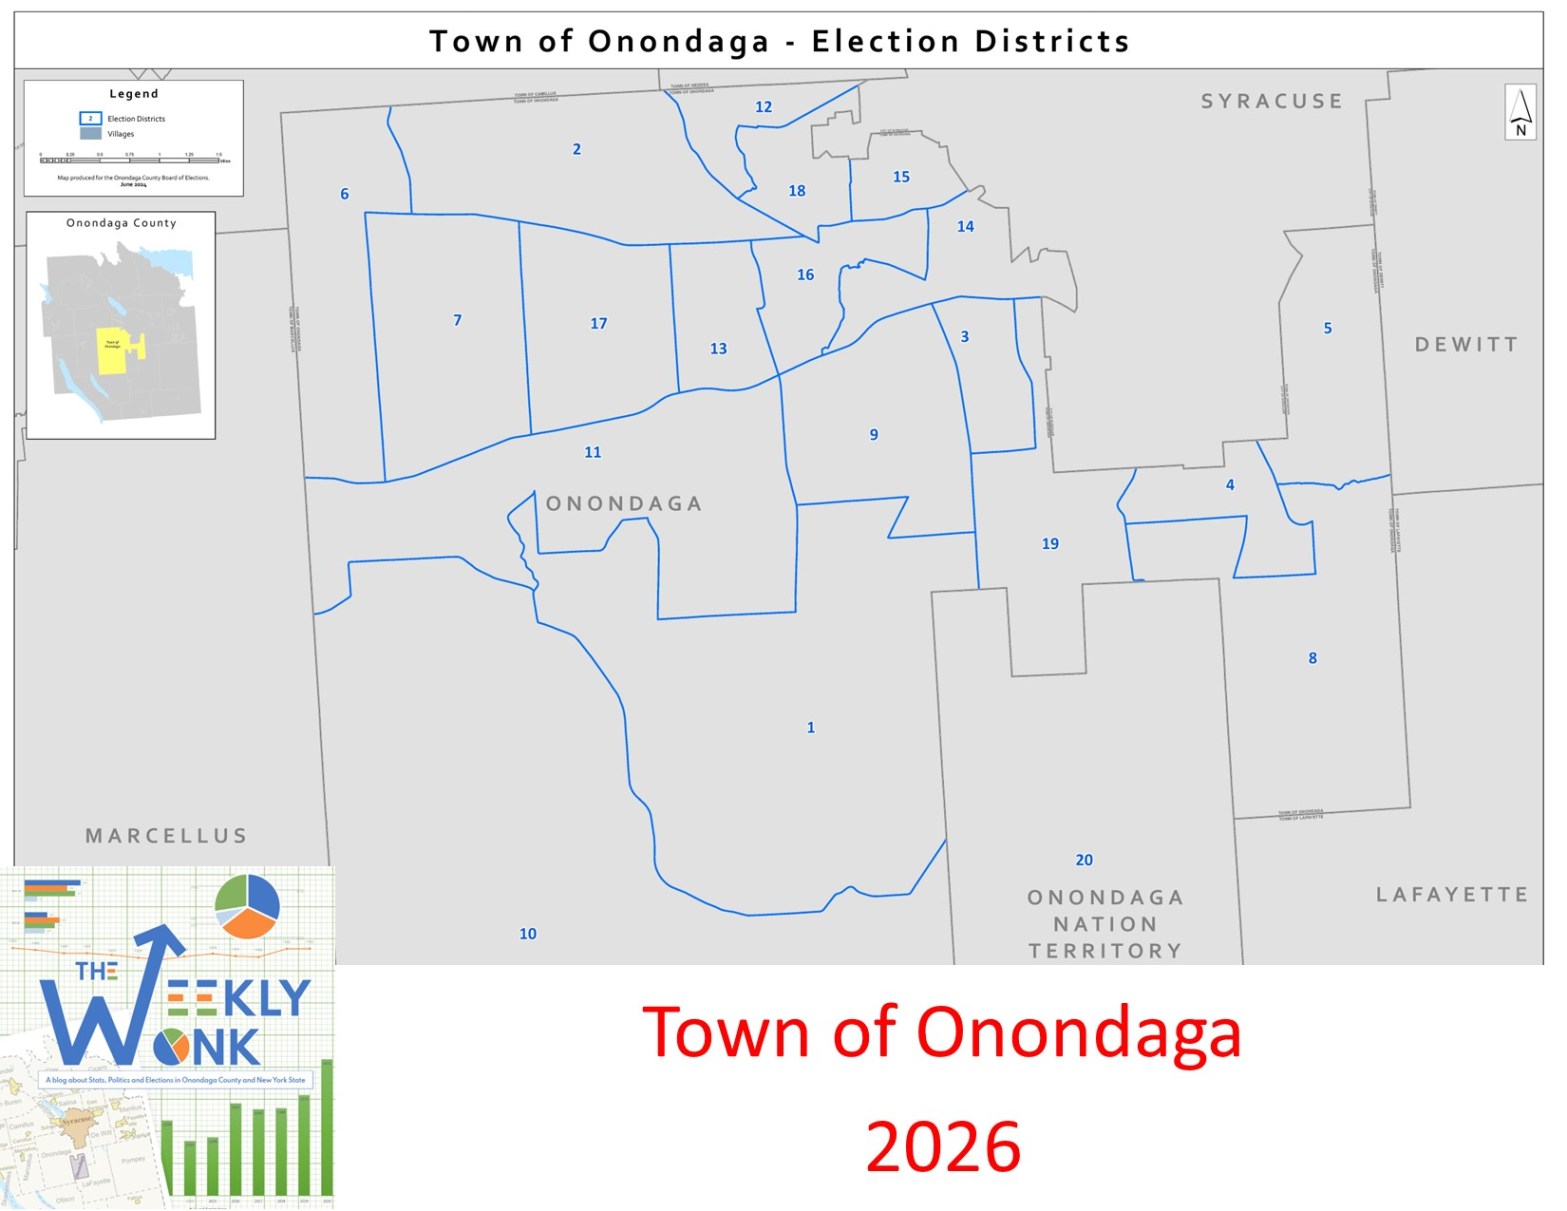
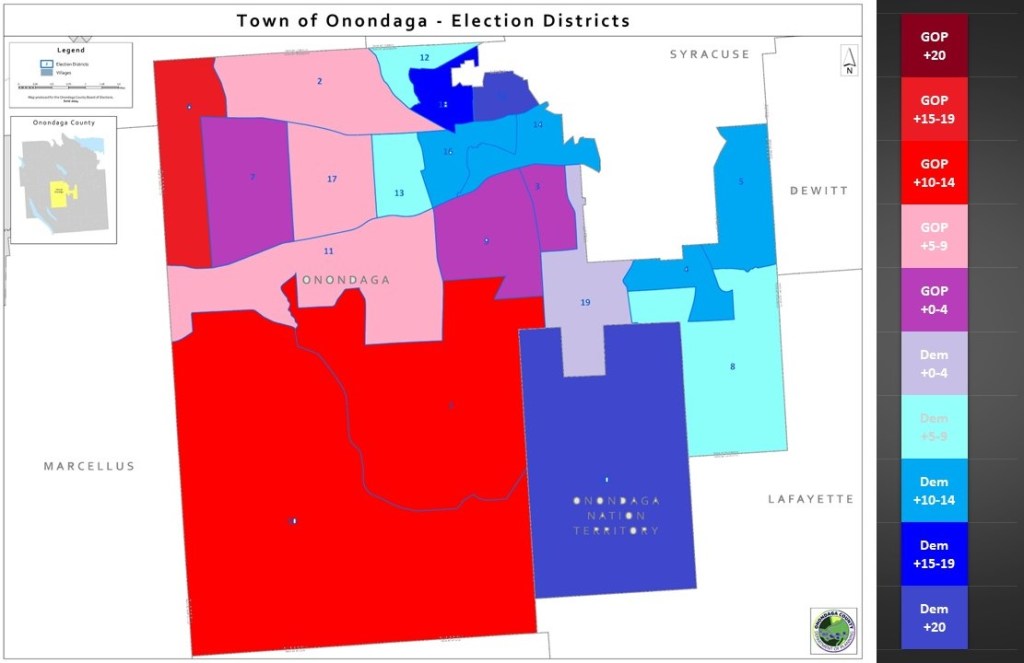
Looking at the heat map of the individual election districts of the Town of Onondaga, a pattern emerges. The closer the election districts that border the City of Syracuse, the more dominant Democrats are in the district. Likewise, the farther away, the more agrarian, the more dominant GOP is. The Town of Onondaga contains both highly concentrated Democratic districts and areas with a strong Republican presence. Even though this is an even town, it is a wildly diverse town in terms of partisan strength. Adding these parts all together gets a town as closely partisan as it is now.
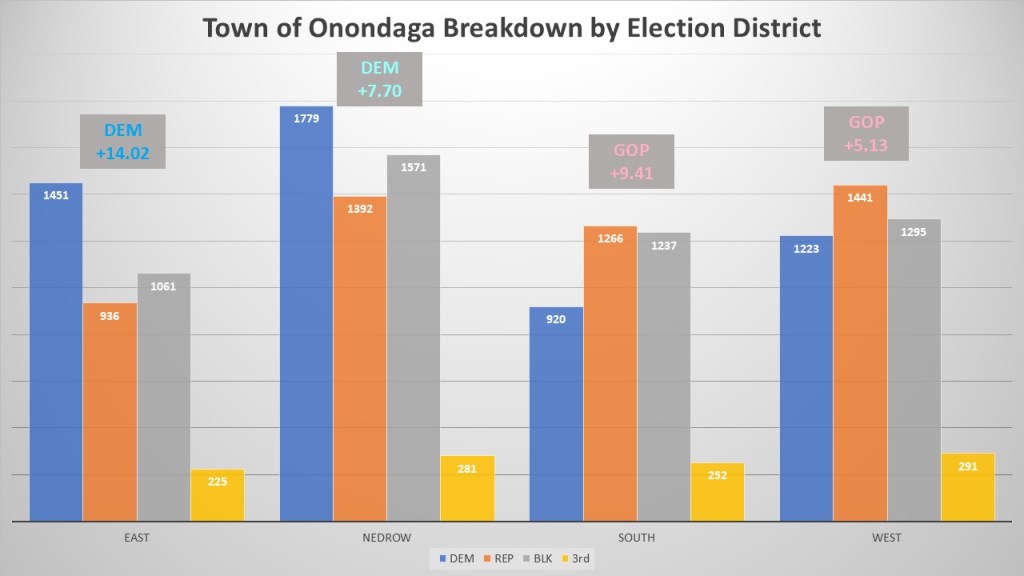
Looking at the general regions of Onondaga, we see the same diversity of the individual election districts. There are two Democratic regions (East & Nedrow) where the non-enrolled outnumber the GOP. There are also two GOP regions (South and West) where the non-enroll outnumber the Democrats. The East dense suburban ED is the most Democratic with a +14.92% Democratic enrollment edge. Next is the Nedrow region, which has the highest number of Democrats and leans Democratic by +7.70%. The Western portion is a traditional lean GOP area with the Republicans have a +5.13% partisan advantage. The South is the most GOP dominant advantage with +9.41% but the non-enrolled are remarkably close to eclipsing both the GOP and Dem individual totals.
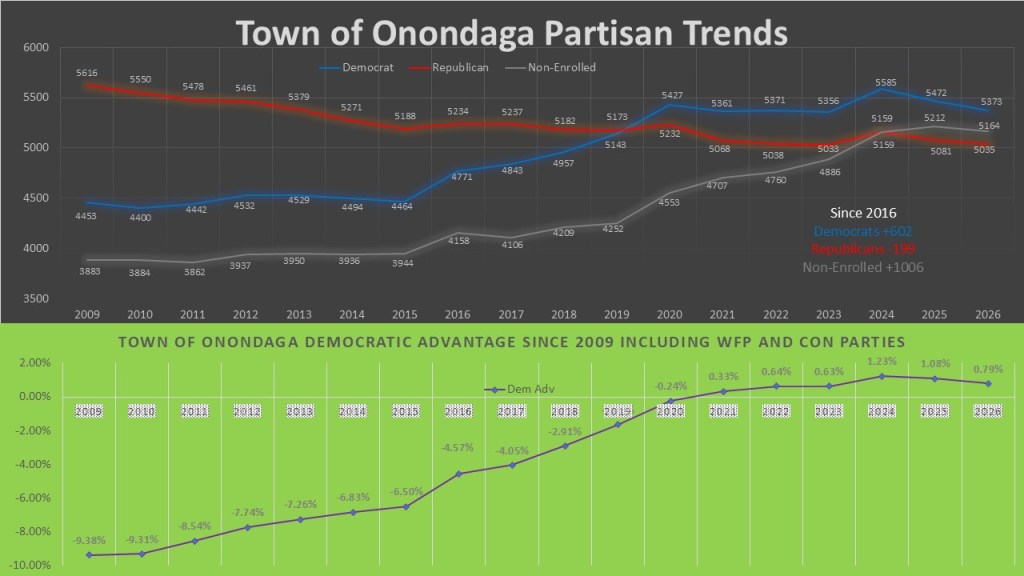
These two graphs show the partisan advantage since 2009. Again, the town of Onondaga is a microcosm for the how the suburbs of Onondaga County have transformed over the last 10 years. Democrats overtook the GOP in this town in 2020 and non-enrolled overtook the GOP in 2025. Democrats since 2016 have added fifty-one voters. The GOP since 2016 has lost 199 voters. The non-enrolled were again the highest gainers, adding one thousand voters since 2016. Even when you add in the working families and conservative to determine the ideological advantage the pattern is clear. In 2009 the Town of Onondaga was a solid 9.38% advantage for the GOP and now is a as close as possible with a .79% advantage for the Democrats.
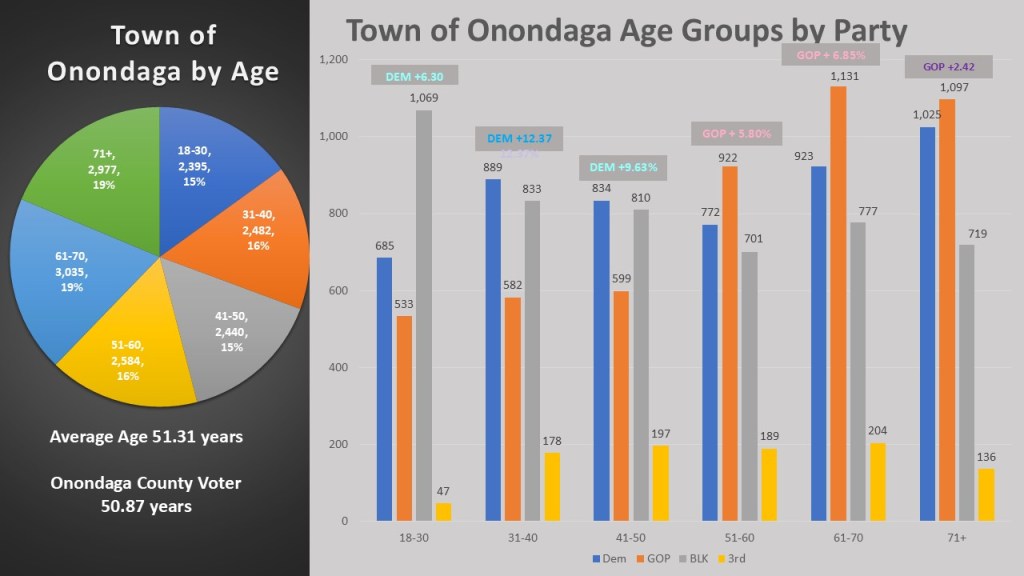
This year I am looking at age to examine these political subdivisions, The Town of Onondaga is a normal town averaging 51.31 years, just slightly over the Onondaga average of 50.87 years. The largest age group is 61-70 years old, but all the age groups are close in size. When looking at the partisan breakdown of the age group the theme of a divided town of Onondaga continues. Democrats are solidly dominating the under fifty age groups. 31-40 Democrats have a +12.37%, 41-50 Democrats have a +9.63% advantage, and the youngest group Democrats only have a +6.30% because of the domination of the non-enrolled in that age group. Republicans have slight edges in the more populous older age groups. 51-60 the GOP has +5.80%, the 61-70 GOP has +6.85%, and the oldest group the GOP has a borderline advantage of 2.42%.
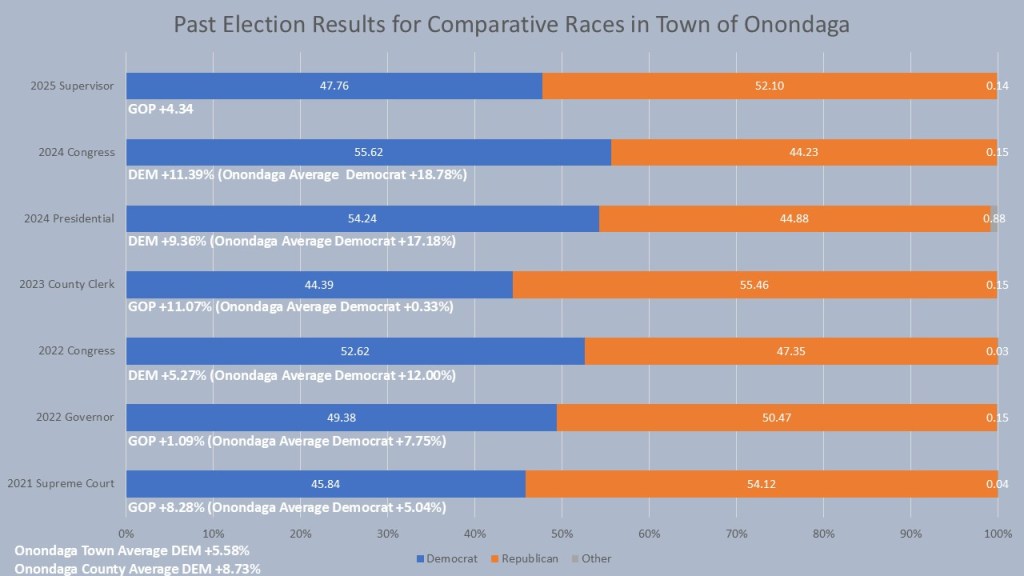
When we look at the comparative races, we see a Town that truly acts differently in higher turnout presidential years, mid turnout gubernatorial years, and low turnout odd years. In 2024 the Town of Onondaga showed up for Democrats in a huge way, giving a +11.39% for John Mannion for Congress and a +9.36% for Kamala Harris for President. In the Gubernatorial year we saw a split. Onondaga supported Francis Conole by 5.27% for Congress but Lee Zeldin edged out a +1.09% advantage (though under a majority). In Odd years Democrats have not fared so well. Emily Essi for county clerk won countywide by .33% but lost the Town of Onondaga by 11.07% in 2023. Likewise, Anthony Brindisi of Supreme Court won the county by 5.04% but lost the Town of Onondaga by 8.28%. In 2025 Khalid Bey improved on both of those results but still lost the Town Supervisor race by 4.34%. Again, the Town of Onondaga is close to the County of Onondaga average of the six comparative races where Democrats win the town on average by 5.58% and Onondaga County on Average by 8.73%.
That is, it is for this week’s #weeklywonk. Next week we turn our eyes to the northern suburb of Syracuse, the town of Salina. Home of the Salina sweep in 2025! We will look at why this town flipped so drastically and the implications that it will have in 2026. As always you can subscribe to dustinczarny.com and get an email notification for all content and election news updates.
In this week’s episode I explain the difference between State Conventions and County Designations. The state has direct ballot access while county designees still have to get petitions. This is the first step in determining the ballot each year so I take some time to go over it. Enjoy.
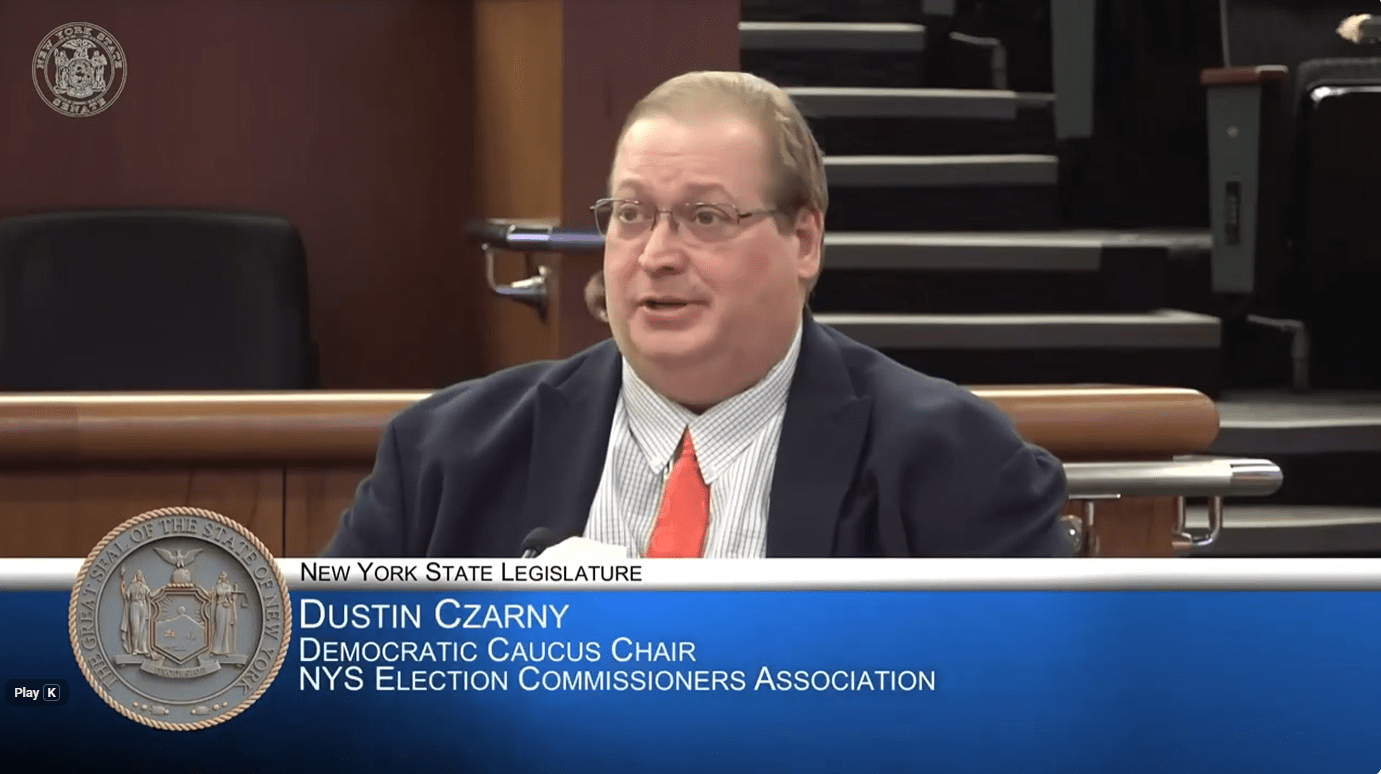
Each year as Democratic Caucus Chair I travel to Albany to give oral testimony on the Governor’s proposed executive budget. NYSECA is asking for $35 million for aid to locality funding to support county Board of Elections. Find the full 10 hour day of testimony here:
Testimony before The New York State Assembly & New York State Senate Joint Legislative Budget Hearing on Local Government
Tuesday, February 11, 2026. 9:30 AM
Dustin M. Czarny, NYSECA Democratic Caucus Chair, Commissioner (D) Onondaga County
Thank you for the opportunity to testify today. My name is Dustin Czarny, and I am an Elections Commissioner in Onondaga County and the Democratic Caucus Chair of the New York State Elections Commissioner Association. NYSECA represents the diverse needs of all sixty-two counties across New York State.
I am proud of our bipartisan county Board of Elections system, which serves as a model that should be followed nationwide. Democratic and Republican commissioners work together to ensure the integrity of our election system. These built-in checks and balances help New York avoid the partisan battles unfolding in other states. Commissioners must continually find ways to put partisan ideologies aside in order to meet the needs of voters.
The year 2025 marked the end of an era for county Boards of Elections across New York State. The transformative Even Year Election Law will take effect beginning in 2026, with many local offices transitioning to federal election years. Town and county offices affected by the law will be fully seated in even-numbered years between 2026 and 2030. As these offices transition, Boards of Elections will face unique challenges. More offices and increased competition in federal years will result in longer ballots—potentially two-page ballots in some jurisdictions. The year 2026 is already shaping up to be unique. Evidence from 2025 and special elections across the country suggests that 2026 may resemble a presidential election year more than a typical midterm in terms of turnout and intensity. County budgets for 2026 are usually adopted in the final quarter of the previous year, meaning many counties may be unprepared for unanticipated costs resulting from the Even Year Election Law transition and increased election intensity.
Since 2019, New York has implemented major election reforms, including Early Voting, electronic poll books, and universal voter registration transfers. We have also developed a robust vote-by-mail system, including the addition of Early Vote by Mail. These reforms have resulted in some of the highest vote-by-mail volumes outside of the pandemic years of 2020 and 2021. Additionally, we implemented a cure process to prevent the accidental disenfranchisement of absentee voters due to technical deficiencies. While no system staffed by human workers is without flaws, our Boards of Elections have risen to the challenge and maintained a strong and reliable election system in New York.
The Democratic and Republican commissioners of the New York State Elections Commissioner Association believe New York should move toward annual funding for local Boards of Elections, replacing the multiple grant sources currently in place. To that end, we are requesting $35 million in Aid to Localities funding for 2026. Greater flexibility at the county level would allow for more efficient use of funds. Some counties may need resources for vote-by-mail operations, others may require temporary staffing assistance, and still others may need equipment or supplies. We also recommend multi-year grants that do not expire at the end of each fiscal year, allowing counties to align purchasing decisions with election and procurement timelines. Many counties are also operating with aging electronic poll books that need to be replaced. The Executive Budget has addressed this issue in recent years, and I commend those efforts. Most poll books purchased in 2019 during the rollout of Early Voting were sixth-generation iPads. While these devices remain serviceable under the current version of iOS 17, counties are preparing to transition to iOS 26, which no longer supports fifth- and sixth-generation iPads. These devices will need to be replaced ahead of the June 2026 primary. We respectfully request that this grant funding be reallocated in 2026 to provide Boards of Elections with the necessary time and flexibility to complete this transition.
Annual state funding support is more important than ever. The future of federal election funding is uncertain, and New York is among the few states that does not provide annual funding streams for local Boards of Elections. Establishing such funding would eliminate the need for recurring annual requests, enable long-term planning, and ensure parity of service for voters across the state, regardless of where they live.
By establishing annual funding, New York can ensure that every county has the resources necessary to protect the right to vote. In addition to existing reforms, the state should provide clearer guidelines for minimum service levels at county Boards of Elections. This includes establishing staffing minimums tied to voter registration levels and mandating full-time commissioners, as modern political calendars require year-round engagement and oversight. These standards can be established and monitored by the State Board of Elections, preserving the independence of local Boards while ensuring counties and the state provide the resources necessary to fulfill our mission.
Thank you again for the opportunity to testify today. I hope we can count on the Legislature’s continued support in defending our democracy here in New York.
Welcome back to the #weeklywonk. This is my weekly statistical based column I host on my website, dustinczarny.com. Each week I examine an aspect of either Onondaga County or New York state. I focus on electoral or registration data to give a glimpse behind the forces that drive politics and elections. This week I am continuing my 6-part series on the towns that nominate Democratic candidates by petitions starting February 24th. In part 3 I focus on the Town of Marcellus, a normally GOP town that took a dramatic blue swing in 2025.
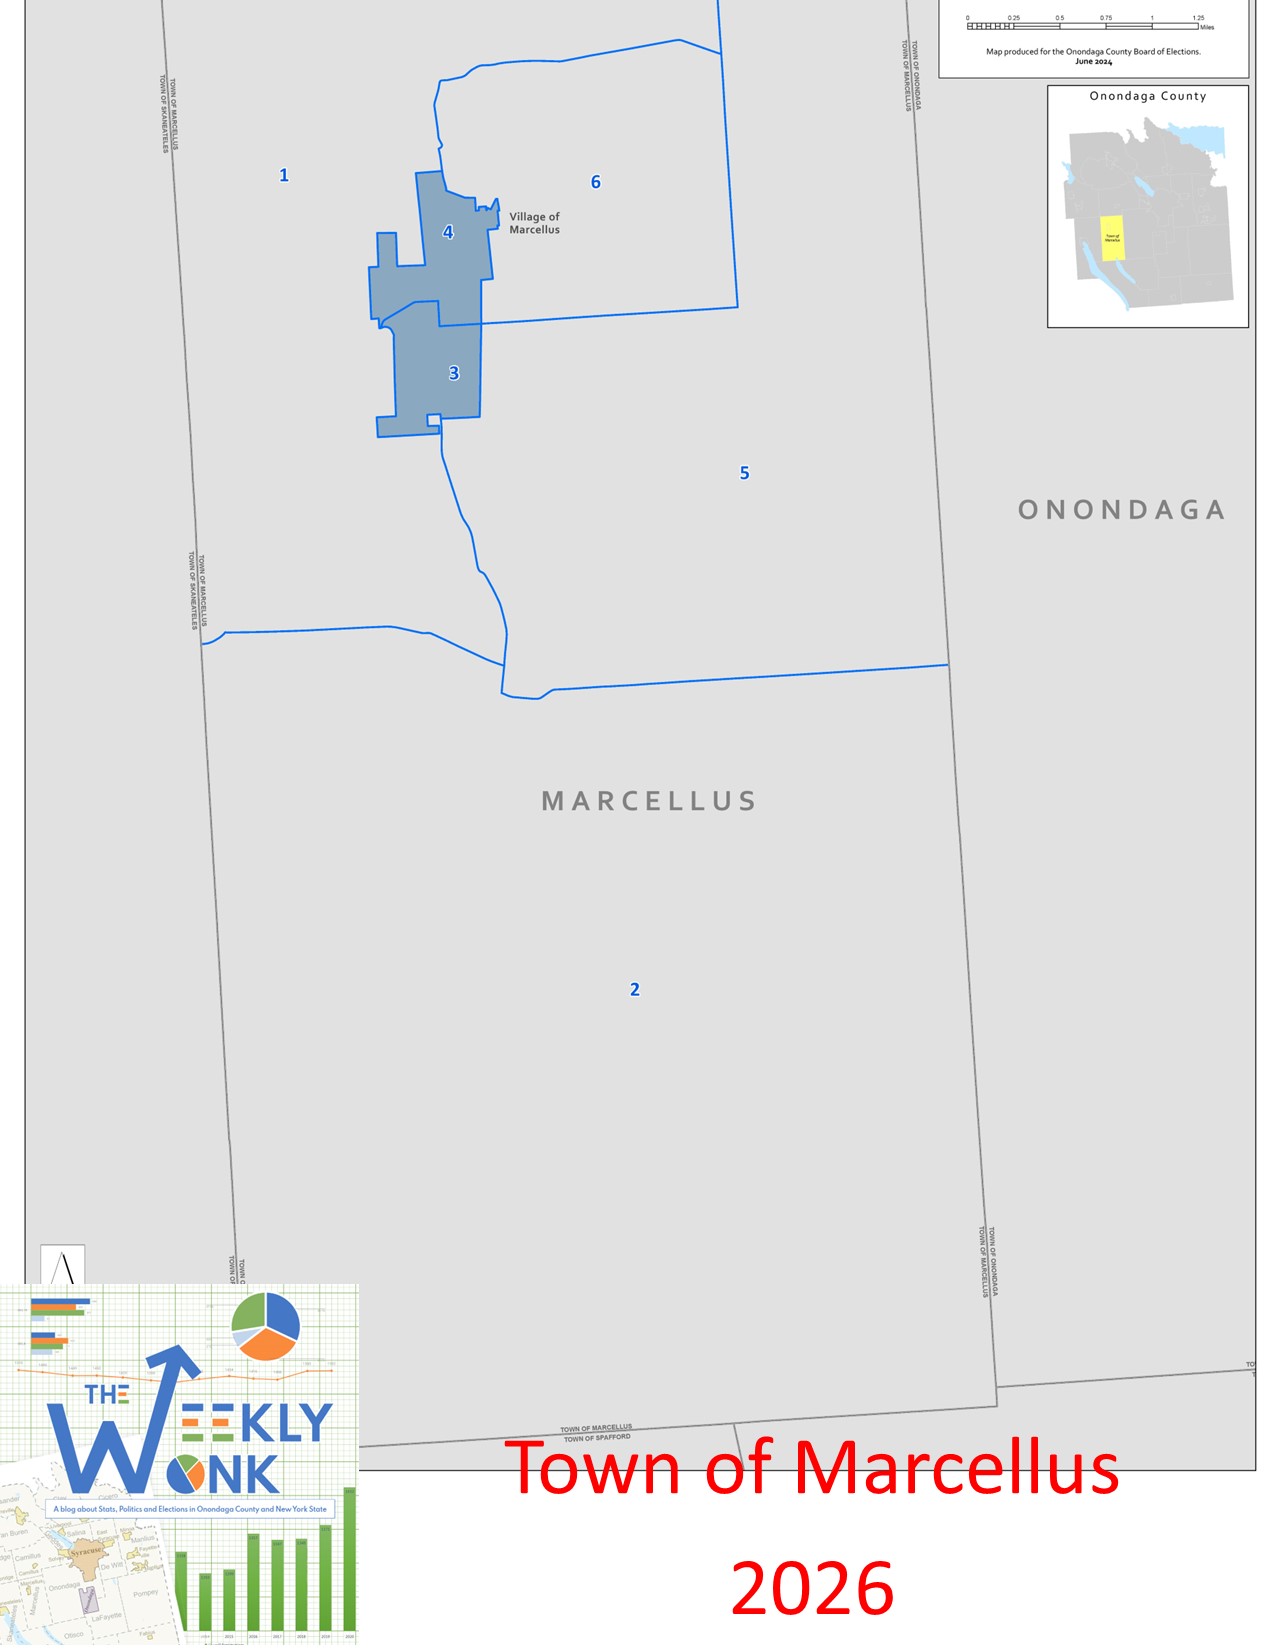
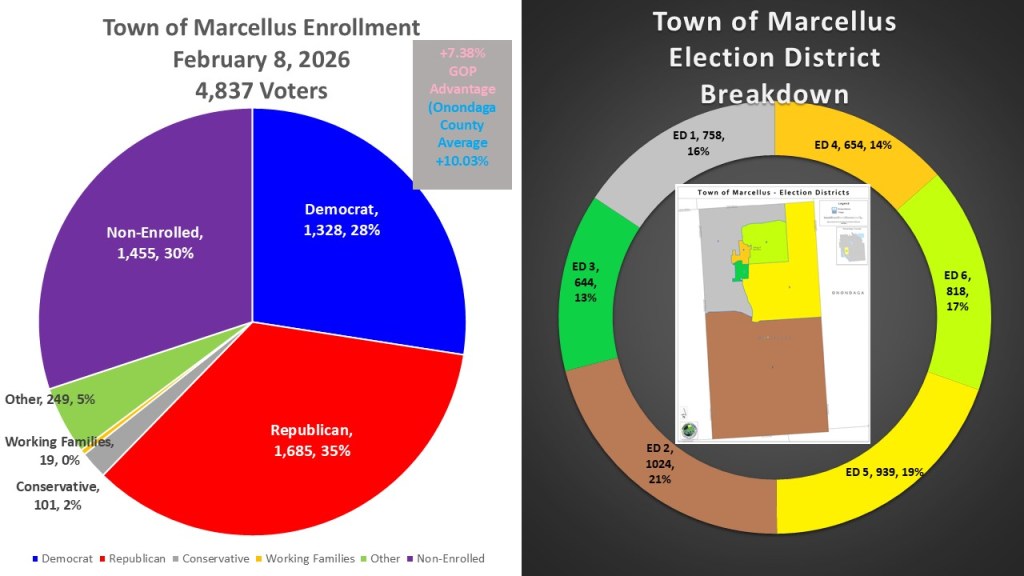
As of February 8, 2026, the Town of Marcellus has 4,837 registered voters. Republicans have the plurality with 1.685 voters (35%). Non-Enrolled comes in second with 1,455 voters (30%). Democrats come in third with just 1,328 voters (28%). The Town of Marcellus is small enough to fit inside one whole Legislative district so we will look at each of 6 Election Districts that make up the town. Marcellus village lies within the town, comprising election districts three and four, and covers approximately 27% of the town’s total area. The remaining four election districts are situated in rural areas, where voter registration is similar across each district.
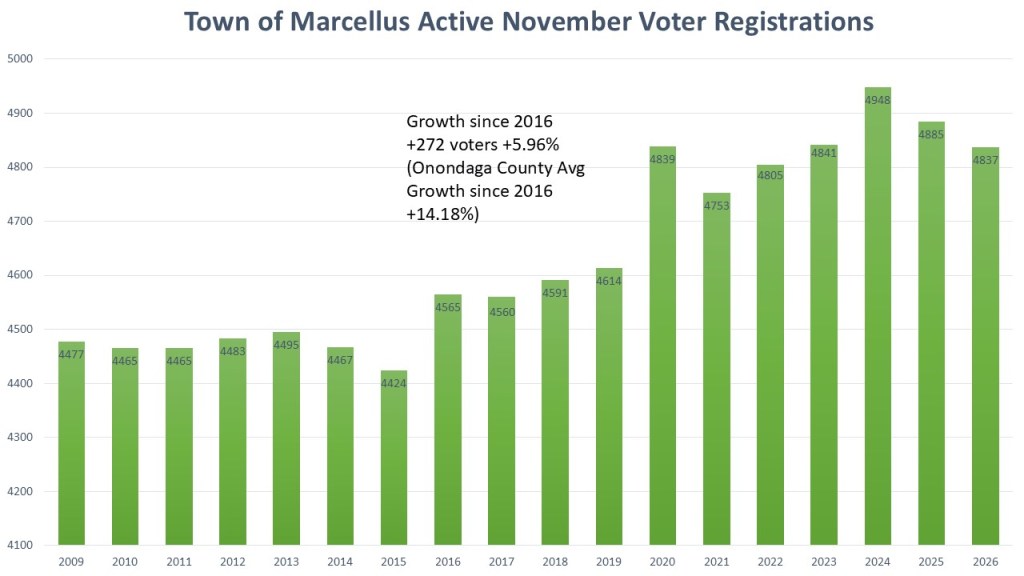
The Town of Marcellus has grown significantly since data was readily available in 20029. During this year’s # weekly, I am focusing on 2016 as a point of comparison. The town of Marcellus grew by 272 voters since November 2016. That represents a growth of just 5.96%. The bulk of that growth does come after the voter registration changes in 2019.
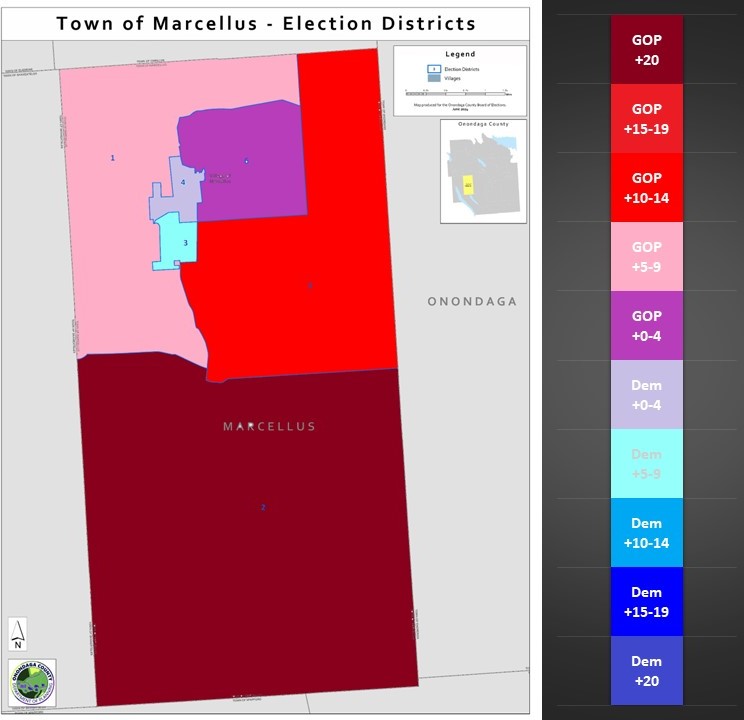
From this map we see the extreme diversity of the town of Marcellus. ED 3 and 4 serve as the representatives for the Village of Marcellus. They are the only two eds with Democrats in the plurality. ED 3 is a lean Democratic district in the +5-10% range. Ed 4 is borderline Democratic (+0-5% DEM). ED 6 just outside village and a little more suburban is borderline GOP (+0-5% GOP). ED 1 in the northwest corner is slight GOP (+5-10% GOP). ED 5 in the northeast is a strong GOP lean (+11-15% GOP). ED 6, the large southern rural ed is overwhelming GOP (>+20% GOP).
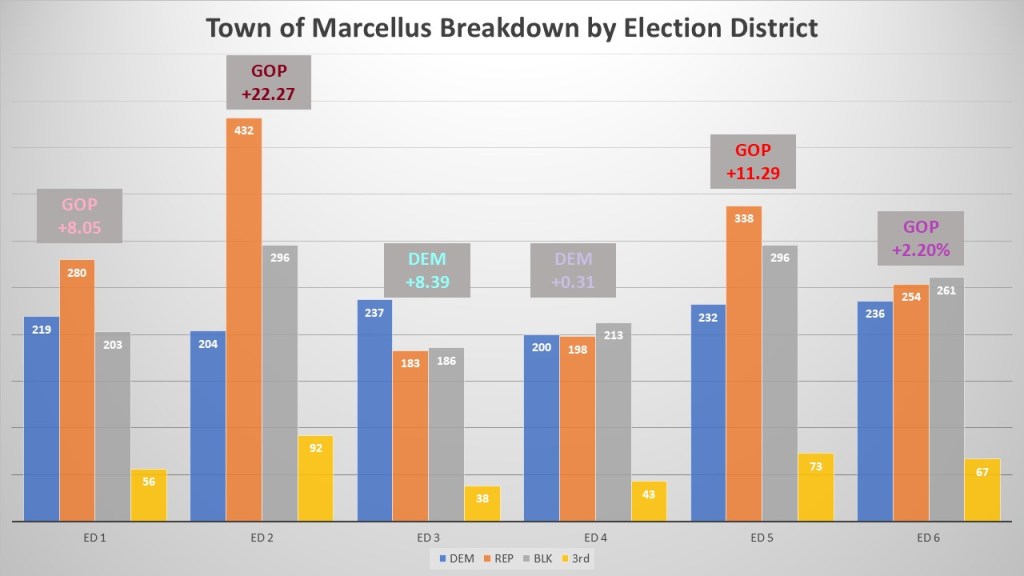
Here we investigate the six election districts in more detail. ED 3 represents the most Democratic lean with a +8.39% ranking and we even see the non-enrolled slightly outnumbering the GOP. The Borderline Democratic ED 4 is a rare ed where the Dems barely outpoll the GOP but the non-enrolled outpolls both. We see that in the borderline GOP ED 6 as well with the GOP barely beating the DEM and the non-enrolled beating them both. The Lean GOP ED 1 has your standard GOP plurality with Democrat 2nd and non-enrolled third. Buth of the other GOP of ED 2 & 5 show the GOP well ahead of the Democrat and the non-enrolled in second place.
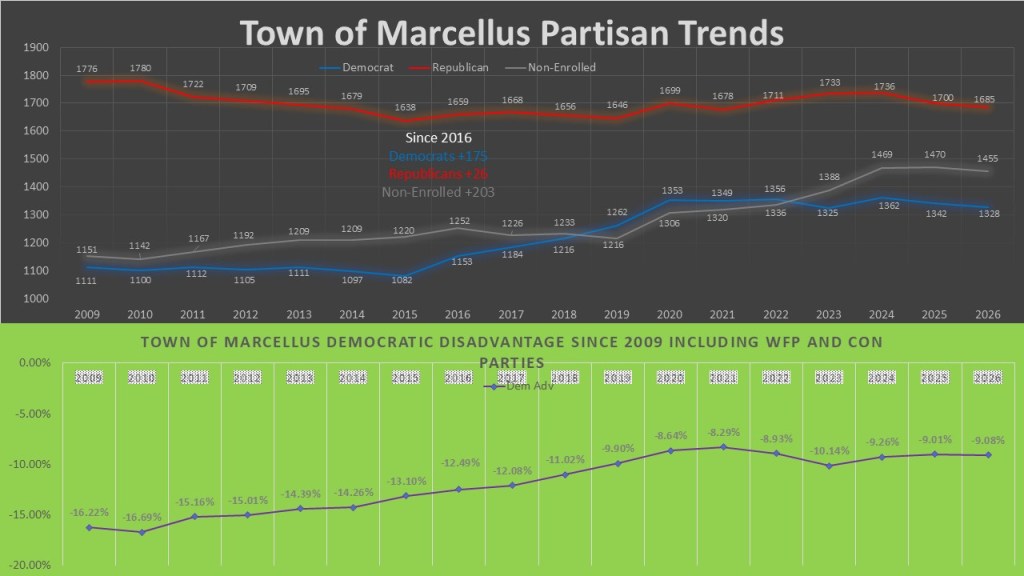
These two charts show the Partisan trends of the enrolled voters over time. We once again focus on the common comparison point of 2016. Since then, the GOP has been stagnant, adding just twenty-six voters. The Democrats in the meantime have added 175 voters. The non-enrolled though as is often the case is the largest growth at +203 voters. When we look at the ideological lean from 2009 in the bottom graph, we see that there is a strong steady move to the middle. This graph shows the dominance of the GOP and conservative party shrinking from a 16.22% difference over the Democratic and WFP parties to just 9.08%. this with the growth of the non-enrolled Is why Marcellus is shedding its Gop dominance to become a swing town.
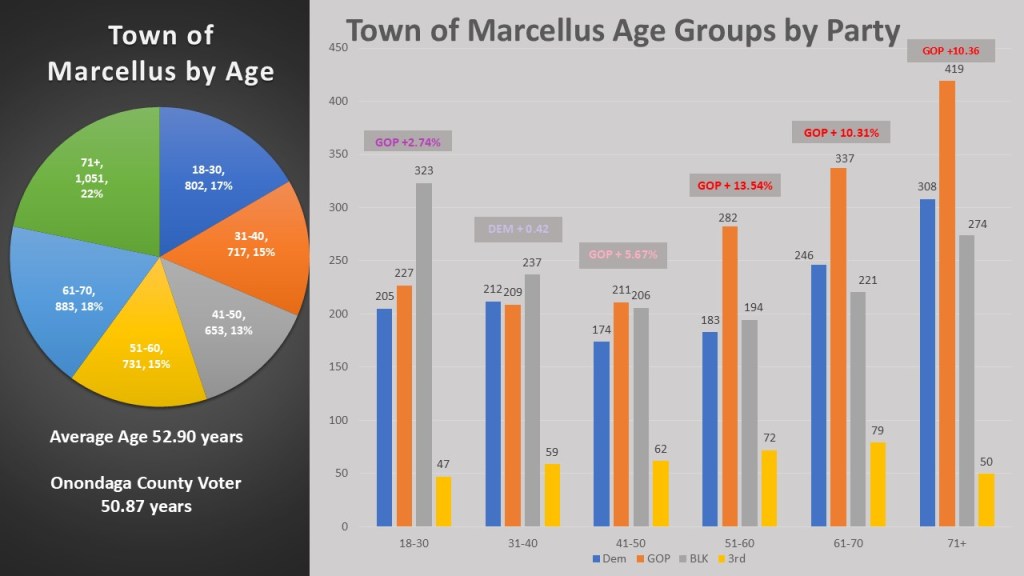
In 2026 I am rolling out an analysis for age of the average voter/ Marcellus, like most towns have an older average voter. The average Marcellus voter is 52.910 years, significantly higher than Onondaga County average of 50.87 years. The 71+ age group makes up the largest proportion, accounting for 22% of the total. When we look at the age group’s partisan leans, we see that the GOP leads in five of the six age groups with Democrats only outnumbering GOP in the 31-40 group. However, we also see the non-enrolled beating both parties with the two groups under forty and beating the Democrats in the two groups 41-60. The GOP tends to dominate the over fifty range while just barely are ahead in the under fifty range.
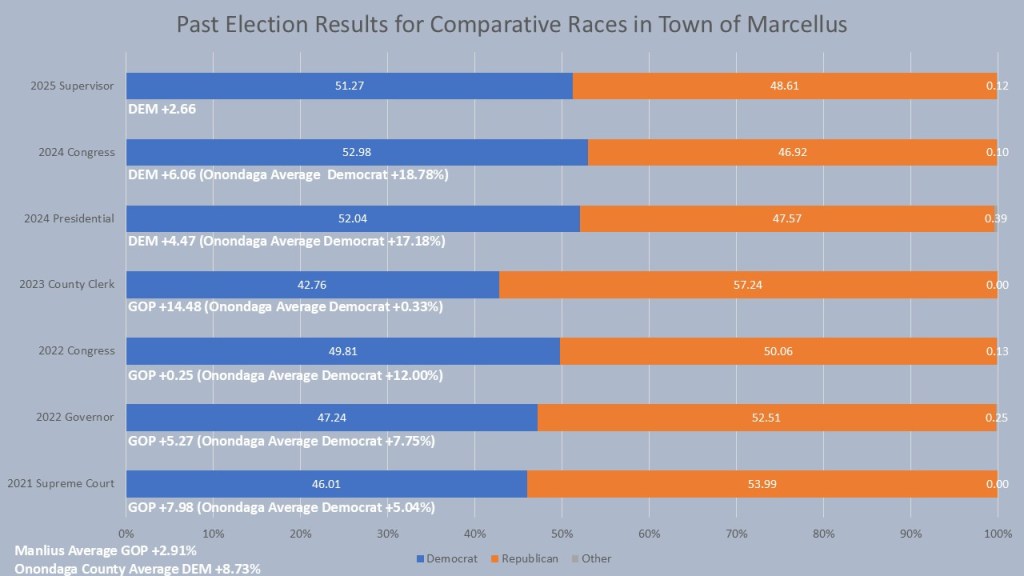
When we look at the Comparison races, we see that despite the GOP numerical advantages, Marcellus Democrats have had their share of success in this town. In Presidential years Democrats can expect about a 5%-point victory with John Mannion (+6.06%)), Kamala Harris (+4.47%) both winning the town in 2024. In Gubernatorial years, the GOP tended to have the edge with Brandon Williams (0.25%) barely winning the congressional race and Lee Zeldin (+5.27%) winning the Governor race in this town. In local years Democrats tend to not do as well with the GOP Lisa Dell winning the County Clerk race by +14.4% and Daniel Fogel winning her 2021 Supreme Court race in Marcellus by last year by 7.98%. However, in 2025 the Democrat Jane Carmody won the Marcellus Supervisor race by 2.65%. This continued the shift towards Democrats we saw in 2024. On average in the comparison race Marcellus has a +2.91% GOP lean when compared to +8.73% Democrat in Onondaga County as a whole.
That is, it is for this week’s edition of the #weeklywonk. Next week I continue my 6-part series of investigating the towns that Democrats designate candidates via petition. Part 4, the Town of Onondaga, will look at this exceptionally large town that is becoming a true swing town and on the verge of local success. As always you can subscribe to dustincarny.com to get an email notification of all content and election news updates. Enjoy.
On this week’s episode I talk about the February 14th party change deadline in New York. it falls on Valentine’s Day every year and that is why I call it “Fall in Love with Your Party Day”, I dive into why this 4.5 month sequester is actually much better than the past and what it means for petitions and primaries.