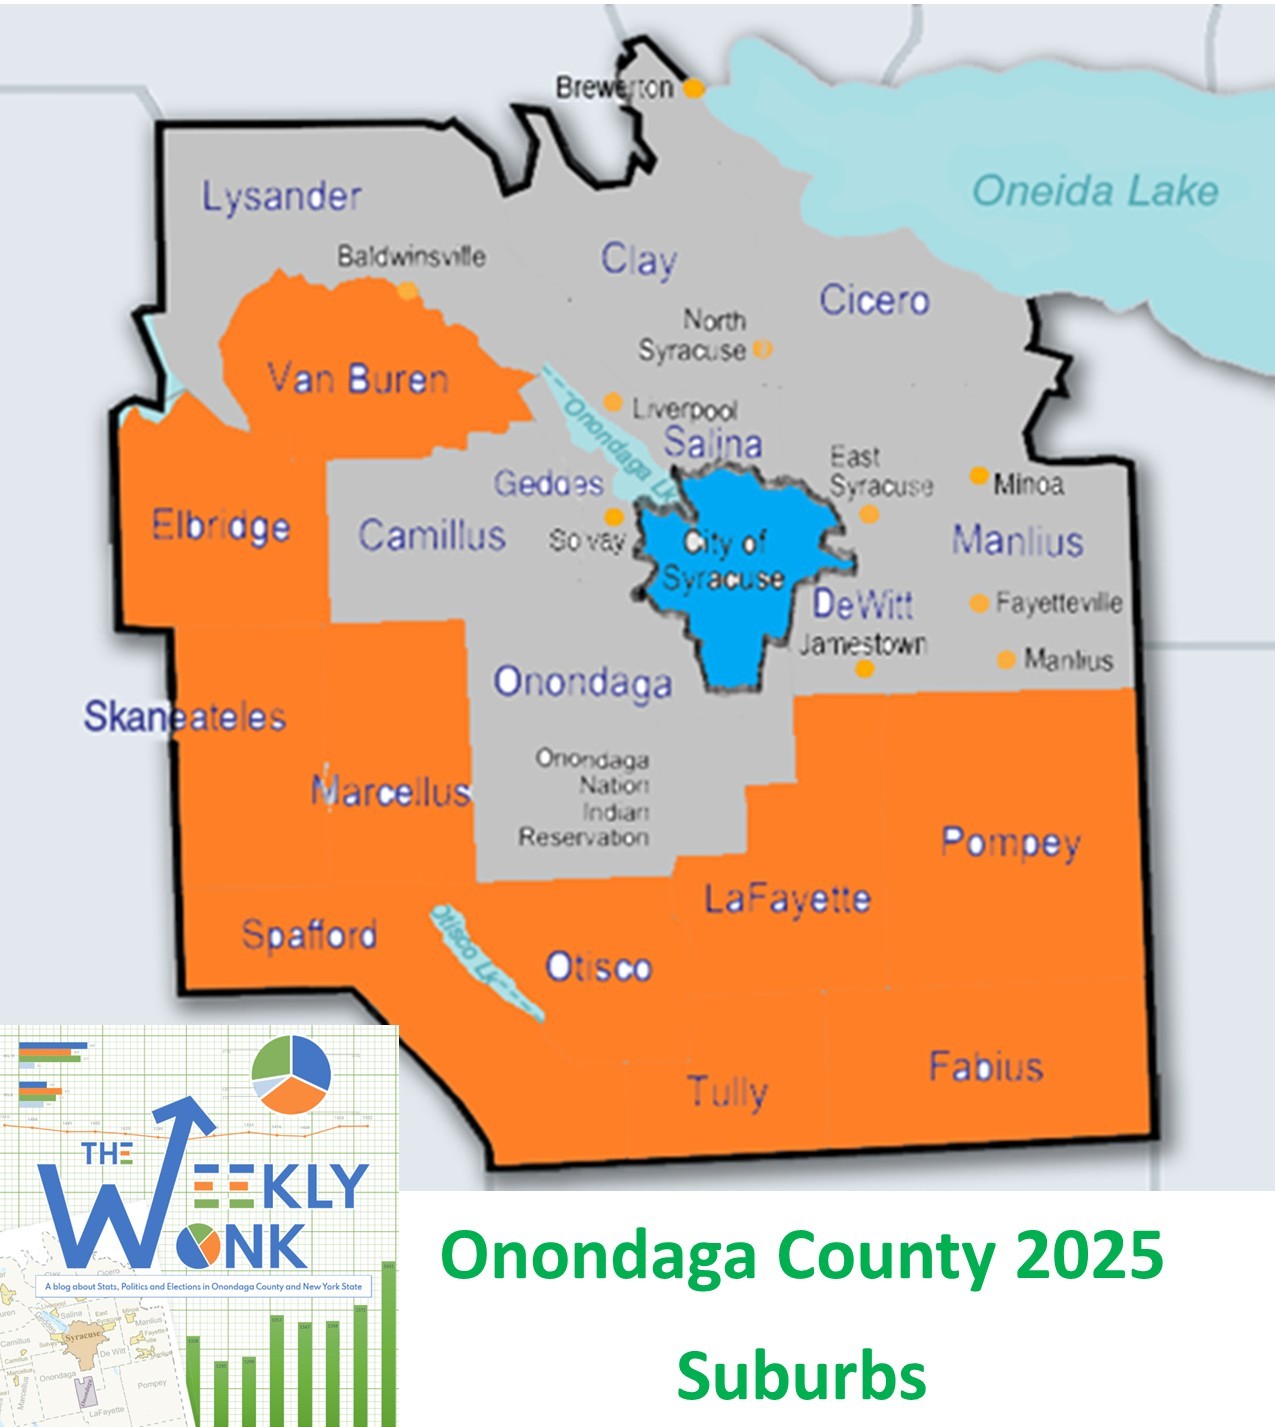
Welcome back to the #weeklywonk! Each week I take a deep dive in some form of electoral and registration data. By examining this data, I hope to give a more comprehensive view of our home, Onondaga County. I am currently looking at the political subdivisions having elections this November. This week we will focus on the City of Syracuse which among other races is having an open election for the next Mayor.

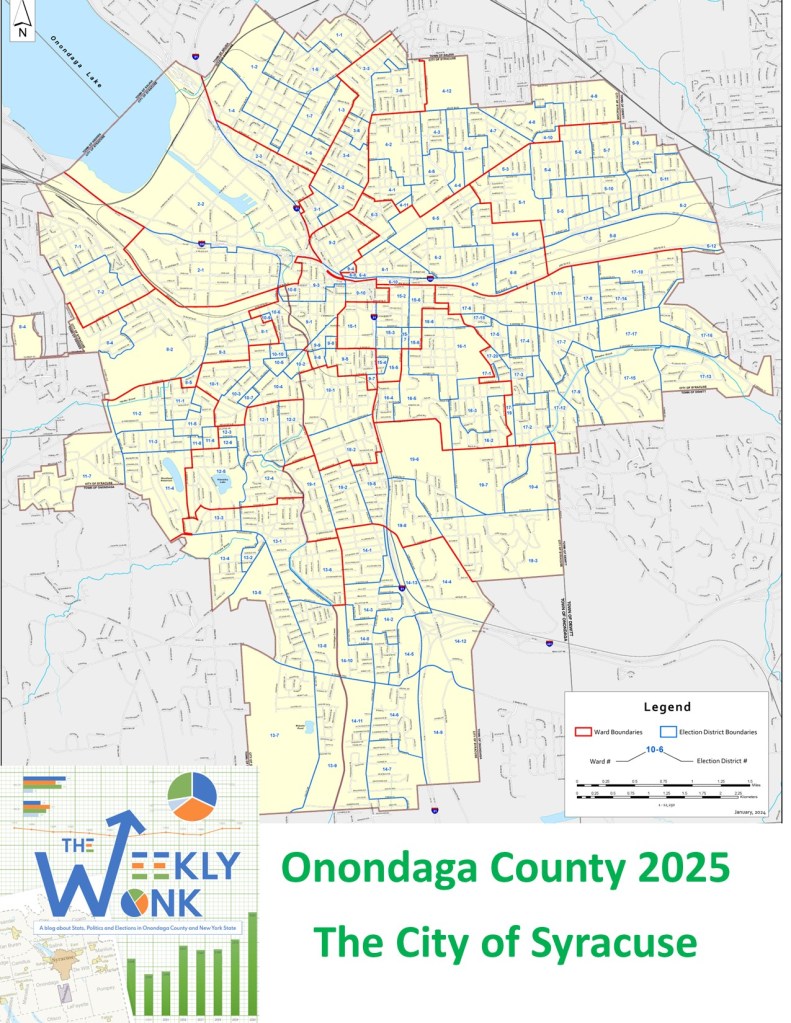
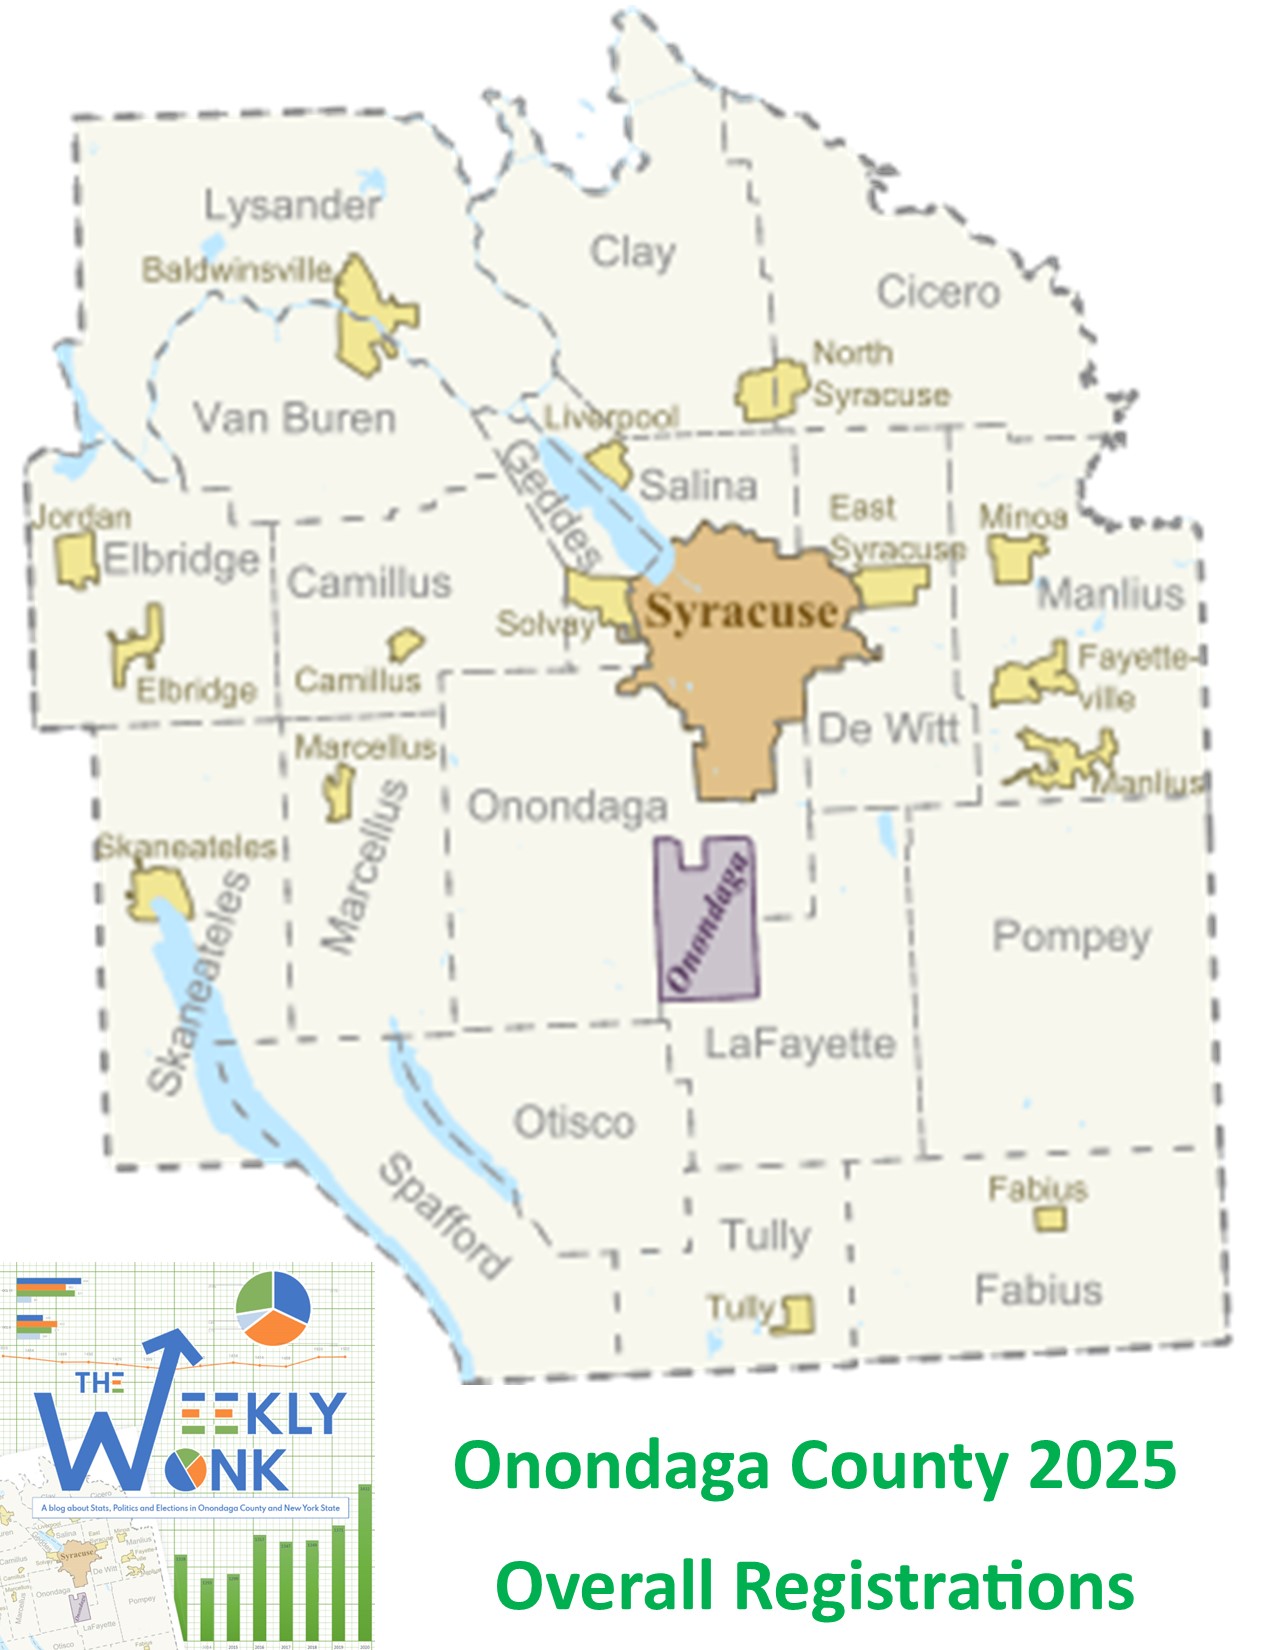
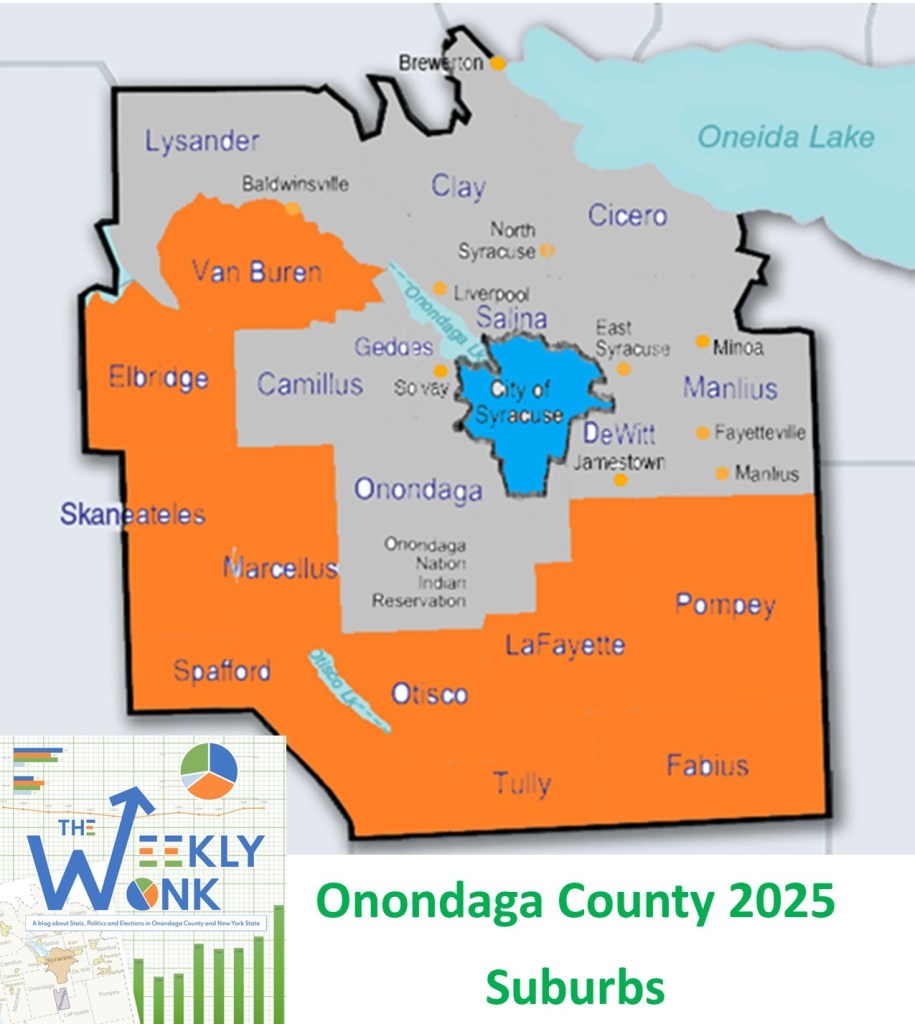
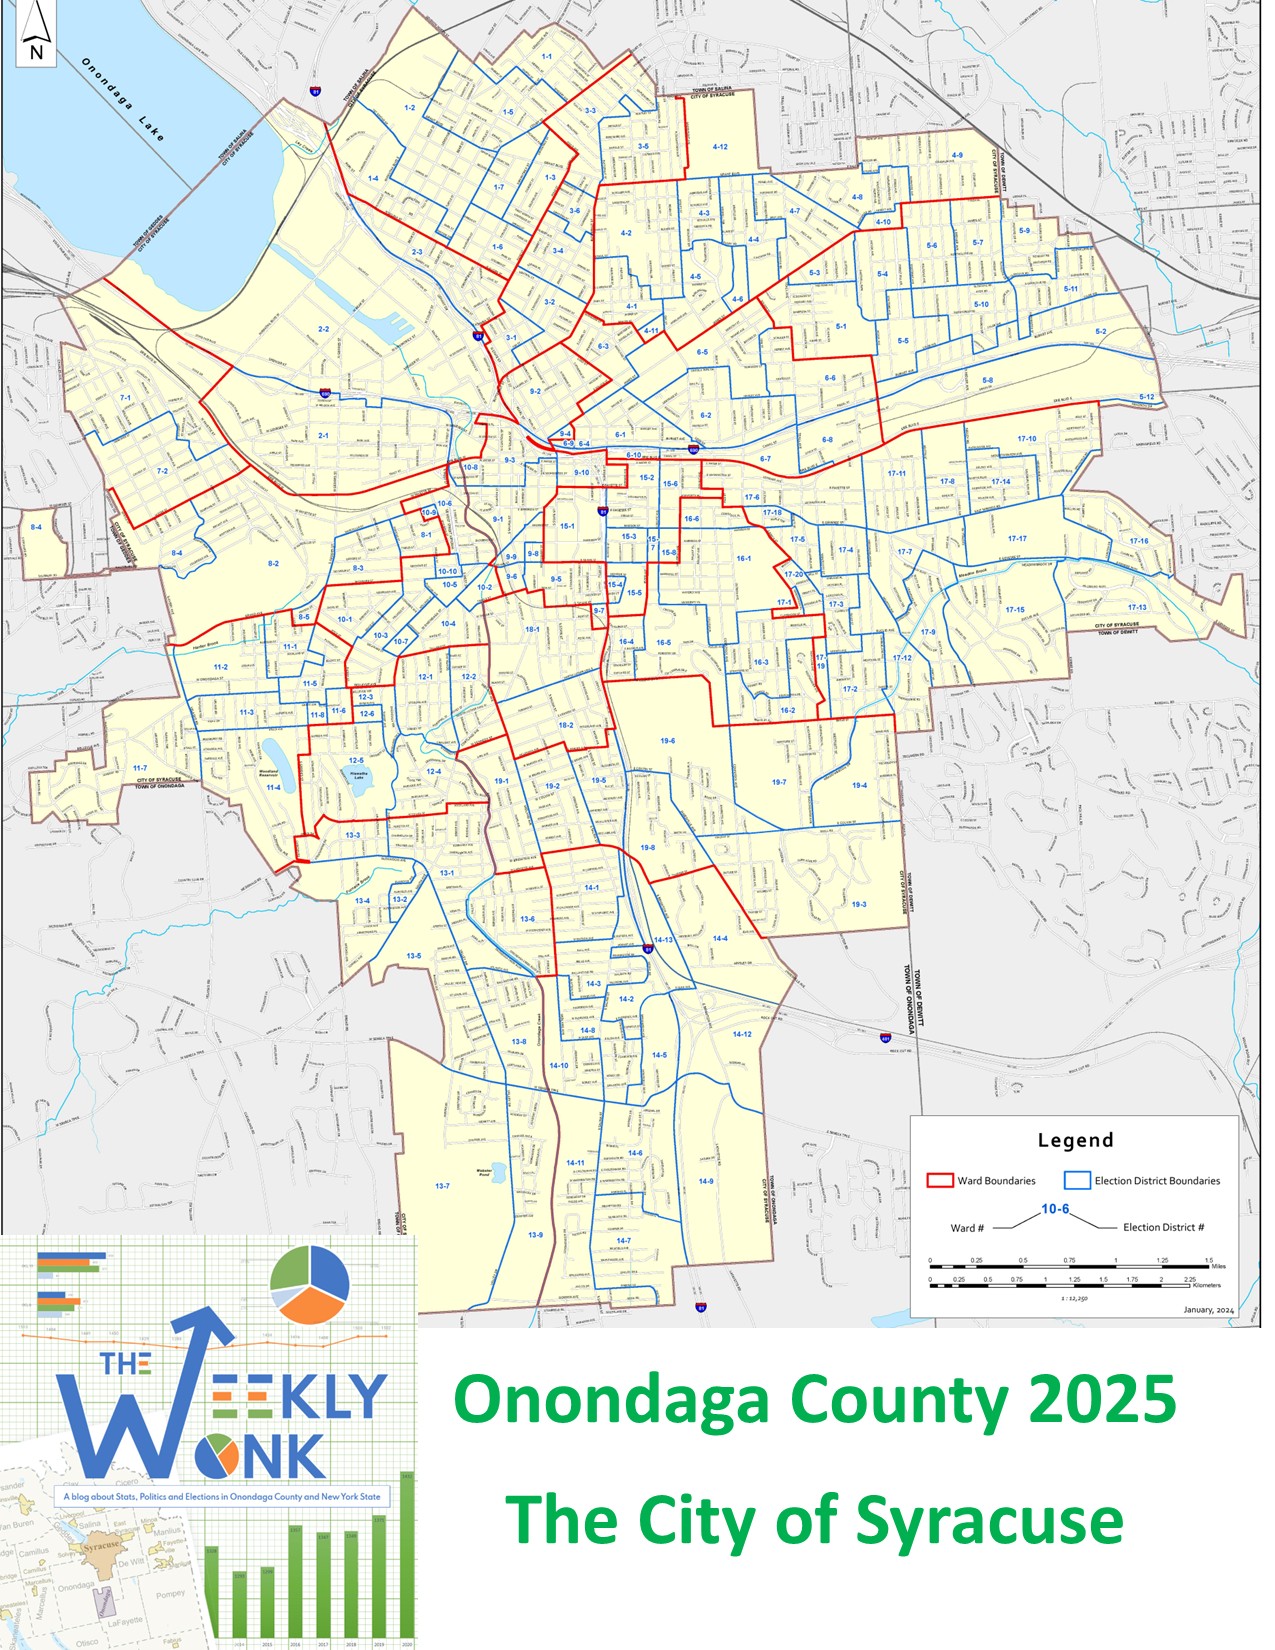
The City of Syracuse is the bright blue center of Onondaga County. Democrats have a majority of the active voter registration with 40,935 voters (53%). The non-enrolled is second with 22,557 voters (29%). The GOP is a distant third with 9,860 voters (13%). Rounding out the active voter population are the Conservatives (709 1%), Working family Party (707 1%), and voters enrolled in various other parties (2,371 3%). In 2023 the City of Syracuse reshaped their five Common Council districts using the newly created citizen redistricting commission. These new common council districts better reflected the neighborhoods and population inside the city. However since redistricting was based on population not registered voters it creates some large differences in voter population. The first common council district in the north side of Syracuse has a large population of non-citizens and thus has the least voter population (12,637 16%). This is followed by the 3rd Common Council (14,115 18%) which is home to Syracuse University who has large populations unregistered or registered in other communities. Rounding out the city is 2nd Common Council District (16,429 21%, 4th Common Council (16,633 22%), and the 5th Common Council District (17,325 23%).
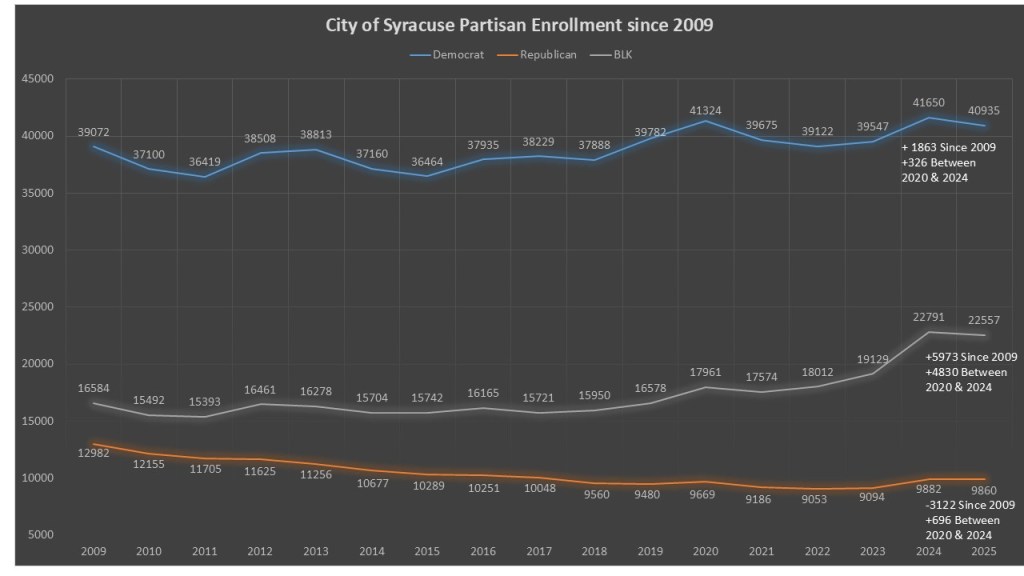
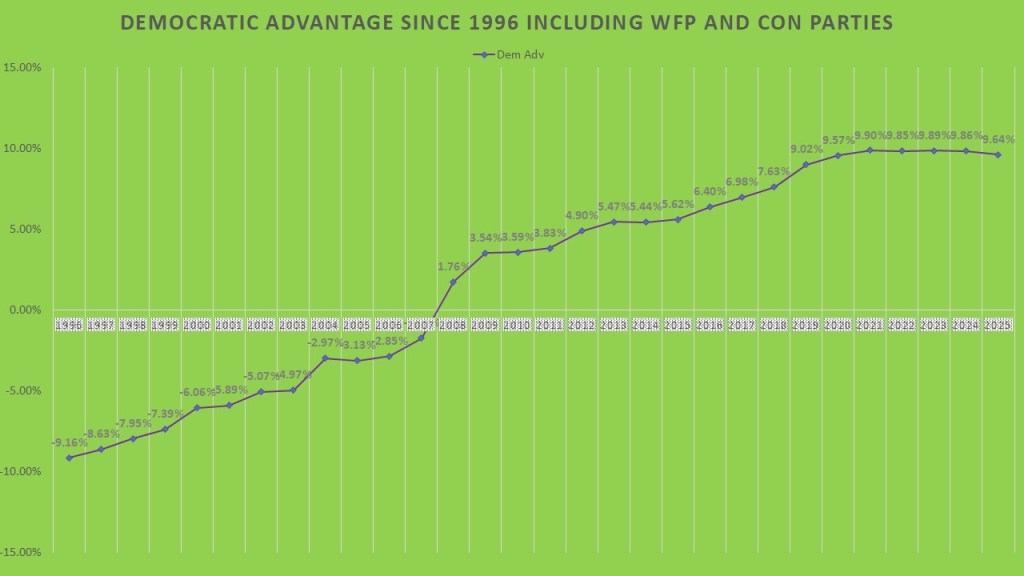
The City of Syracuse has long been a Democratic stronghold. However now at the completion of a gull Presidential Cycle we can compare long term trends to a recent short term. Democrats have gained 1,863 since 2009, however between November 2020 and November 2024 they gained 326 voters. The republicans have lost 3,122 voters since 2009, but in contrast they gained 696 voters between November 2020 & November 2024. The big gainer though is the non-enrolled. Not only did they gain 5,973 voters since 2009, but most of that gain also happened between November 2020 & November 2024 with 4,830 voters added. So while it raises an eyebrow that the GOP gained at double the rate that the Democrats did in the last four years, that pales in comparison to the Non-enrolled gain at 7 times the rate of GOP and 14 times the rate of Democrats.
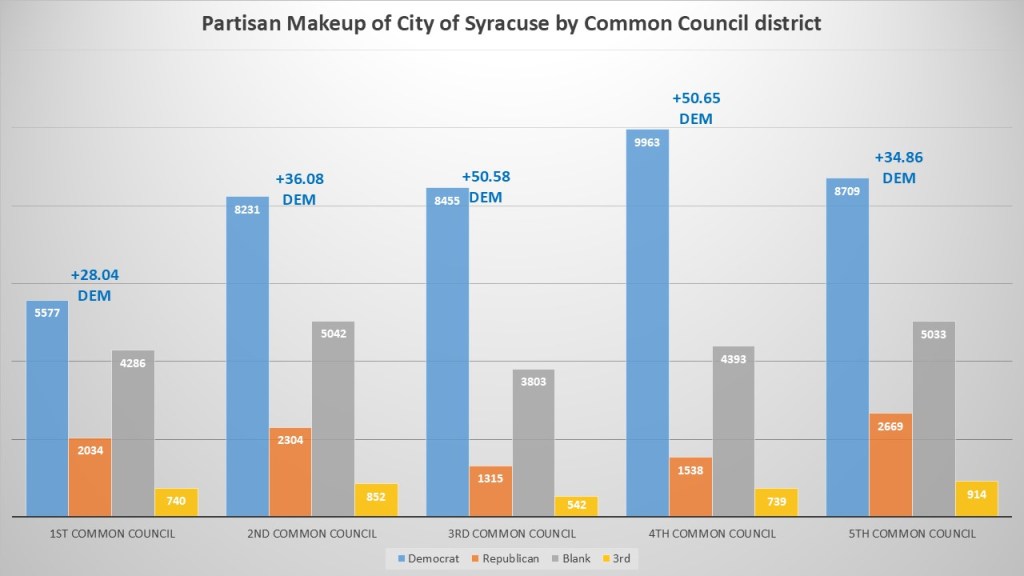
The partisan makeup of the City of Syracuse Common Council districts is all similar in their Democratic dominance, but in varying degrees. In every district the Democrats are well over the other categories, with non-enrolled in second, and the GOP in distant third. The least Democratic dominant district is district one with a +28.04% representing the northside. That is followed by the second common council district at +36.08% which represents the west side of Syracuse. Next is the fifth common council representing Eastwood and Sedgewick at +34.86%. #rd common council district representing the university and east side of Syracuse has a +50.58%. Finally, the most Democratic district is the fourth common council representing downtown and the south side into the valley. At +50.65%.
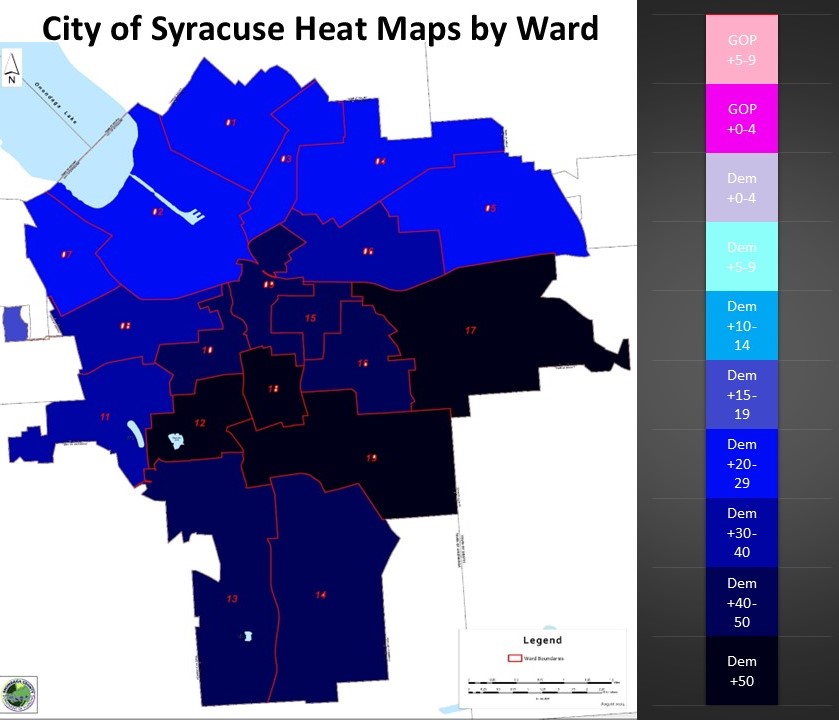
Syracuse is so dominated by Democrats I had to add a few categories for the heat map. For this map we look at the wards of the City of Syracuse and color them based on the degree of Democratic enrollment edges. Wards 1,2,3,7,4, & 5 are the least Democratic wards in the City of Syracuse falling in the Dem +20-29% range. Wards 6, 8, & 11 are in the Dem +30-39 range. Wards 9, 10,13, 14, 15, & 16 fall in the Dem +40-49 range. The most democratic wards are 12, 17, 18 & 19 in the +50-59% range.
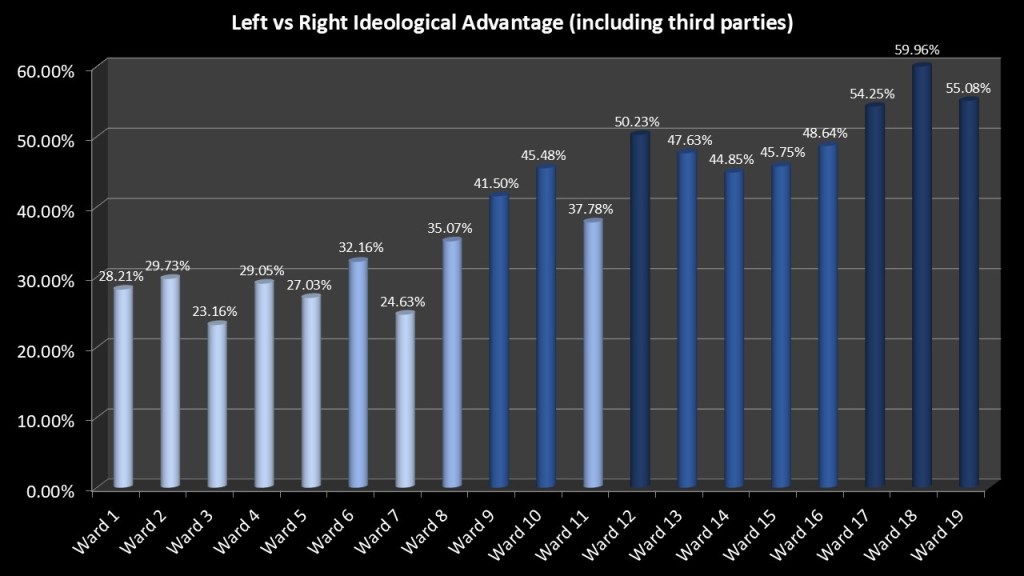
It is helpful to not just look at straight Democratic enrollment edges but to factor in the third parties as well. The Conservative party tends to align with the GOP and the WFP tends to align with the Democrats. Usually, the conservatives outnumber the WFP by a factor of five or more and thus it can swing districts to the right. However, in the City of Syracuse the WFP and Conservatives are essentially tied. That means the wards really do not change much when we look at the ideological leans of the wards when compared to the heat map that just shows the Dem % gain over GOP.
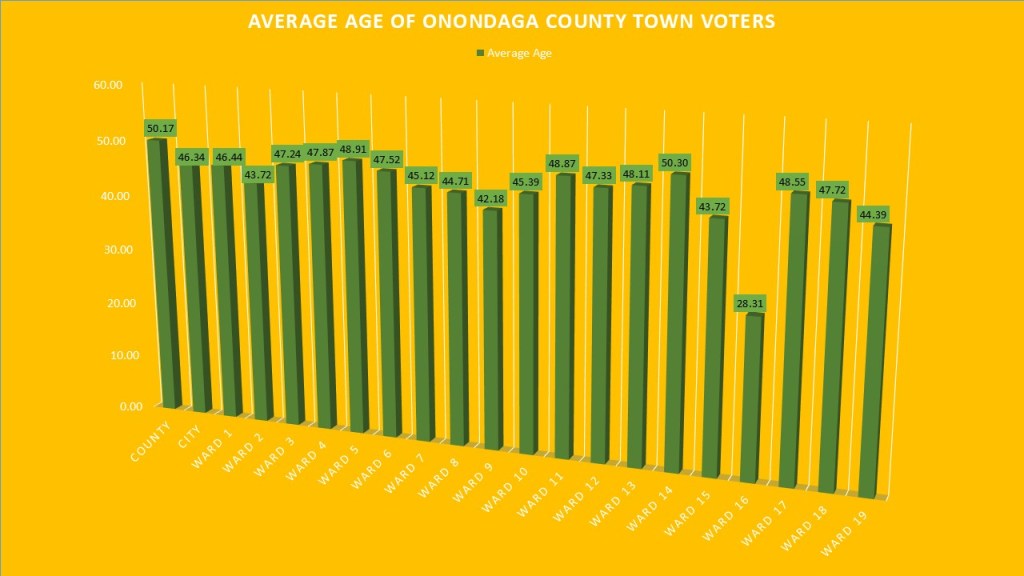
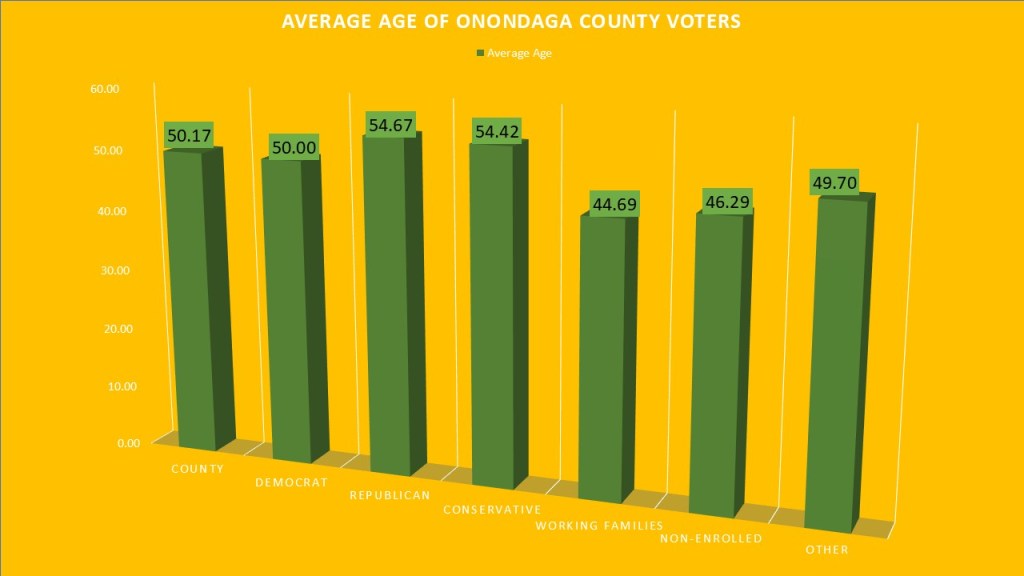
New to this year’s #weeklywonk I am incorporating age into our analysis. The average age of an active registered voter of Onondaga County is 50.17 years old. Only one ward in the City of Syracuse is older than the county as a whole, and that is Ward 14. The youngest ward is of course the 16th Ward whose average age is 28.31. This is the home of Syracuse University and that significantly brings it down. It is worth noting that younger wards like 2 (43.72), 9 (42.18) 15 (43.72) also are known to have student population in them or large apartment complexes that attract younger populations. That is why more residential wards like Ward 4 (Sedgewick 47.87), Ward 5 (Eastwood 48.91), Ward 11 (Strathmore 48.87), Ward 13 & 14 (Valley 48.11,50.30) and Ward 17 (Bradford hills, Meadowbrook, Salt Springs, Westcott 48.55) are on average older than the other wards.
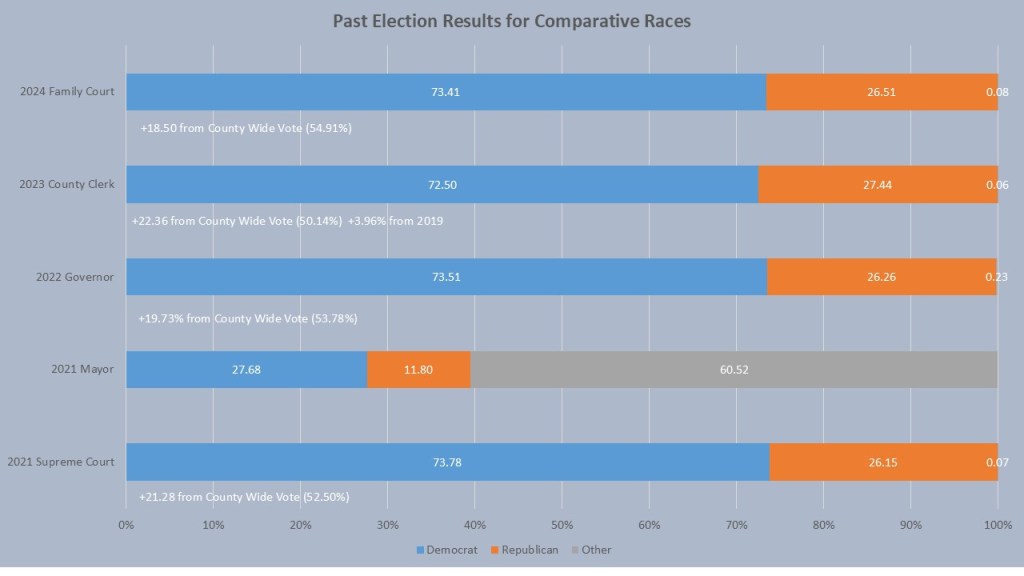
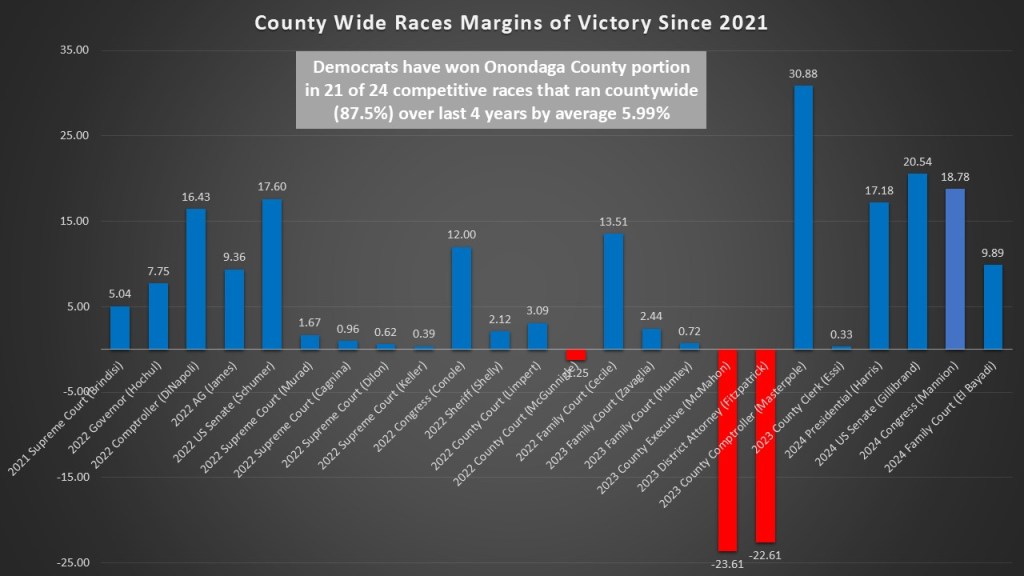
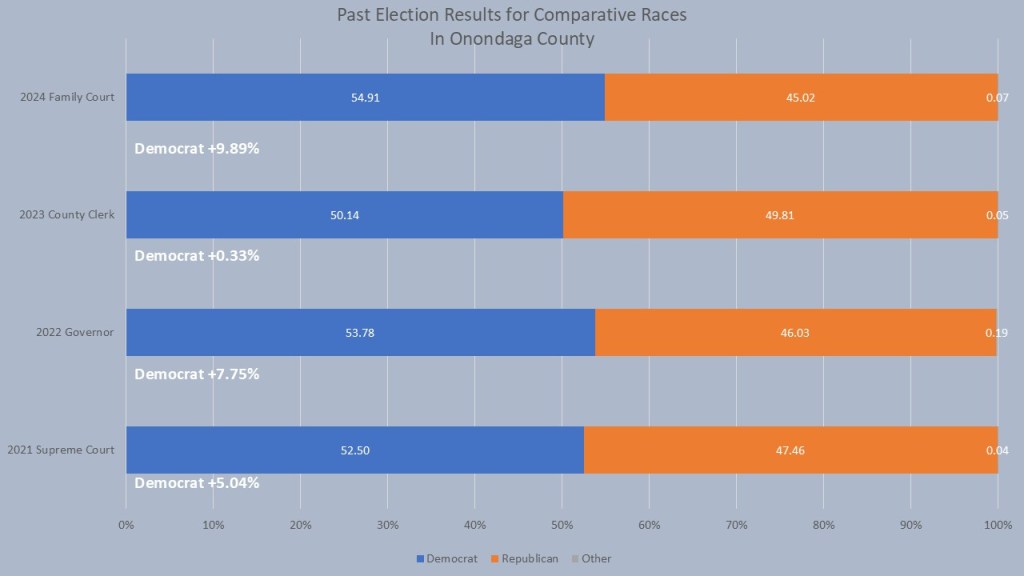
Finally, we look at the comparative races to get a sense of how the City of Syracuse when compared to the rest of the County. As you can imagine the City of Syracuse performs quite to the left of the county. In 2024 the Family Court judge race the Democrat got 73.41% of the vote, 18.50% more than the county average. The 2023 County Clerk race the Democrat got 72.50% of the vote, 22.36% more than the county average. The 2022 Governor race the Democrat got 73.51% of the vote, 19.73% more than the county average. The 2021 Supreme Court race the Democrat got 73.78% of the vote, 21.28% more than the county average. This means a Democrat can generally expect to receive 18-22% more votes than their county average in the city. This makes the performance of Ben Walsh in both of his elections all the more interesting. In his 2021 race he won 60.52% of the voter while the Democrat had 27.68% and the GOP had 11.80%. It is unlikely we will see an independent candidate this popular again this year, but the possibility remains since it has happened recently.
That is it for this edition of the #weeklywonk. Next week I will do a deep dive on two facets of our county I have not done yet. I will take a deep dive into age and gender in our County and city. Tune in next week to take a look at how this breaks down. As always you can subscribe to dustinczarny.com for all content and election news updates.