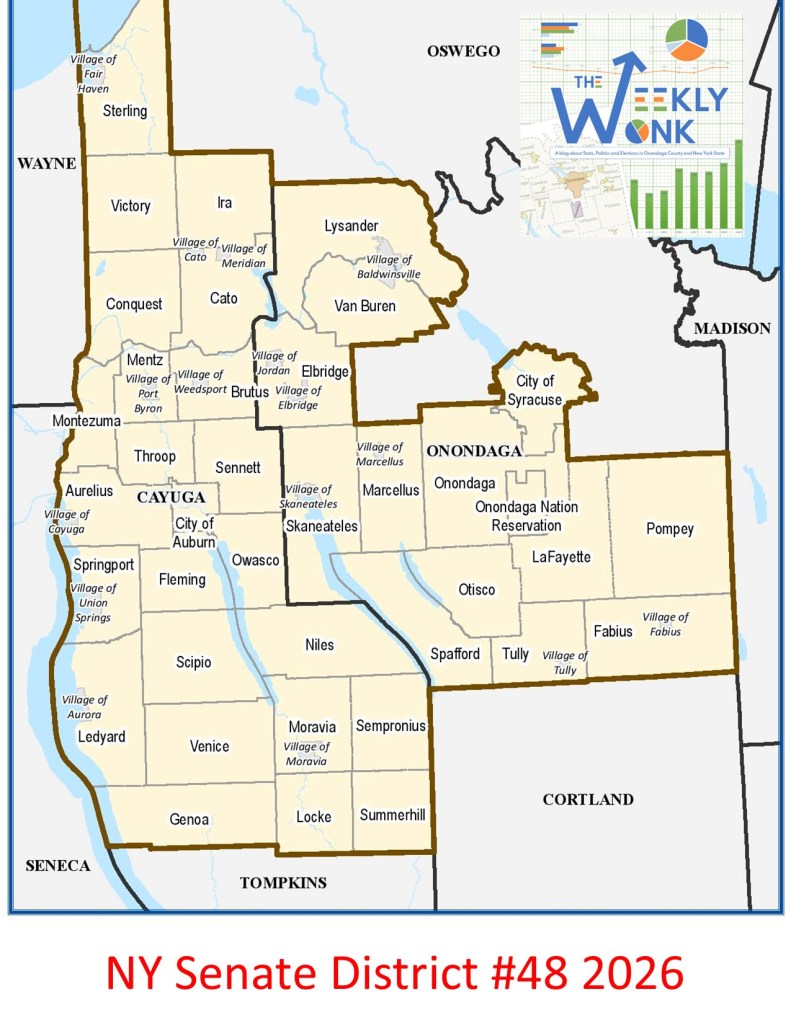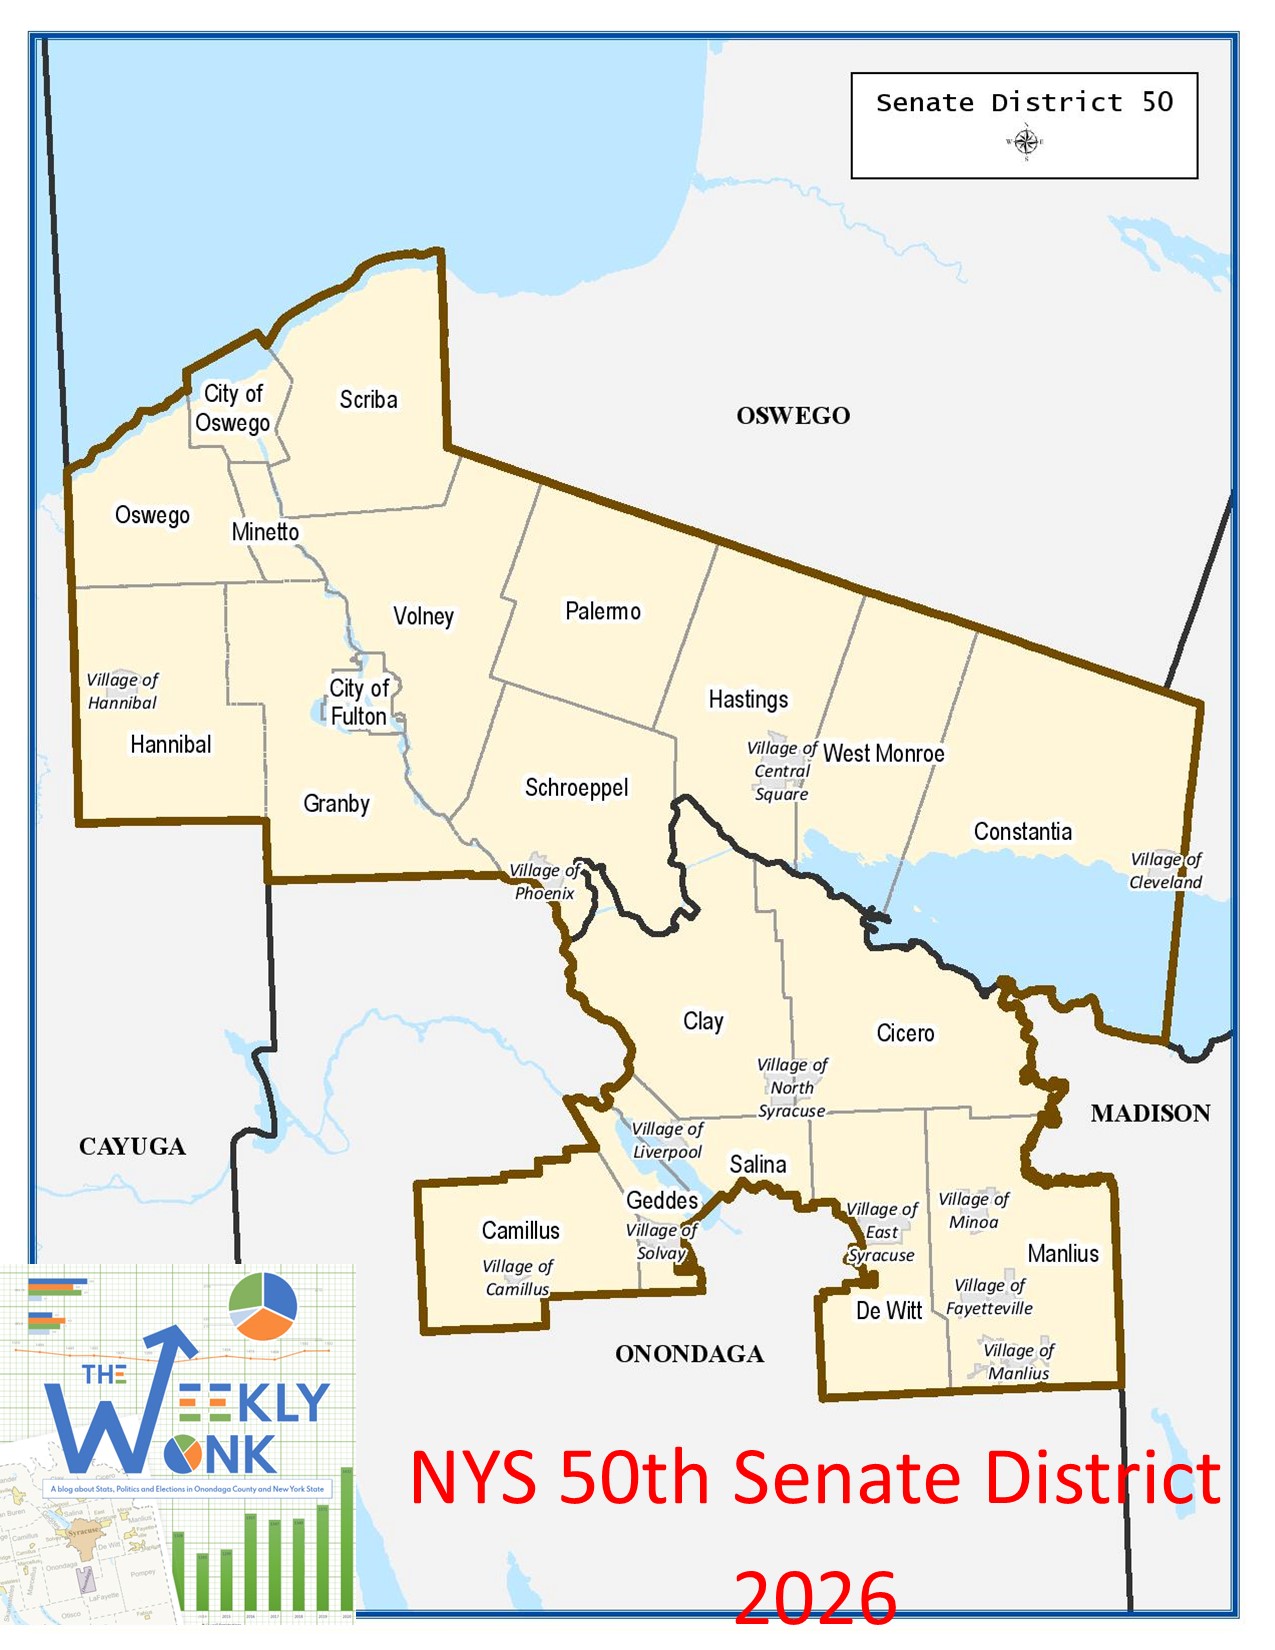
Welcome back to the #weeklywonk. This is my weekly article on dustinczarny.com on statistics and data. Each week I look at a political subdivision having a competitive election this fall and analyze the registration, electoral, and other pertinent data that encompasses it. This helps you understand the story behind election results in our home of Onondaga County. This week I look at the other Senate district, Senate district fifty encompassing the west, east, and northern suburbs as well as the southern part of Oswego County.
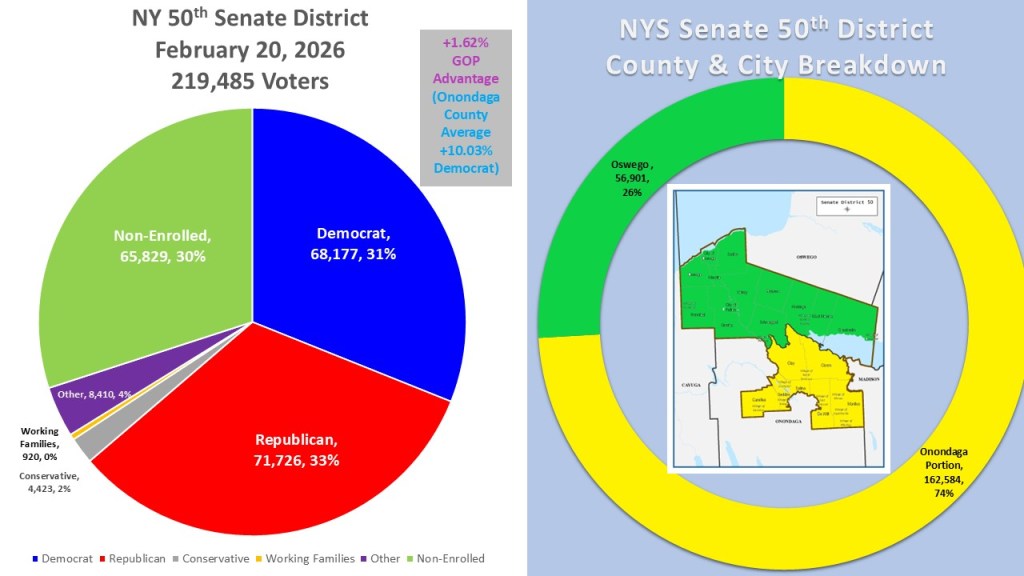
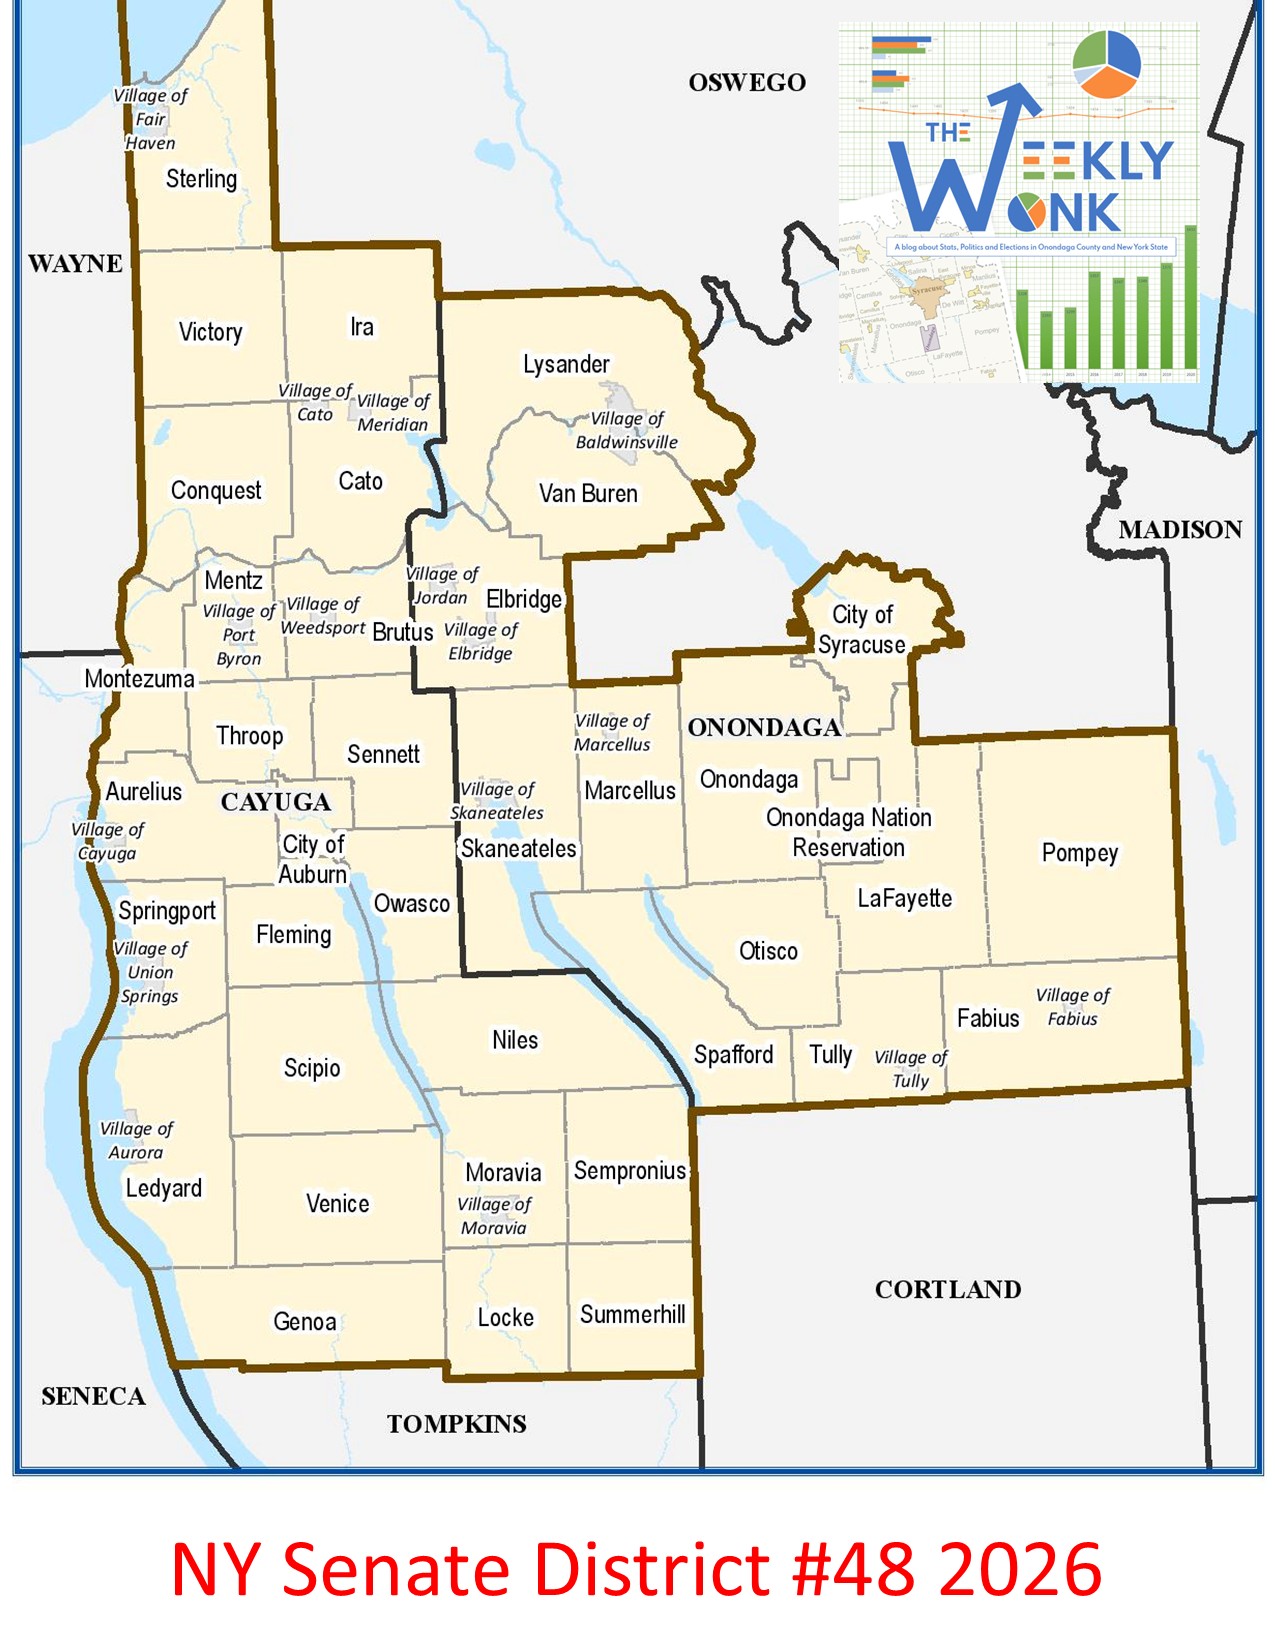
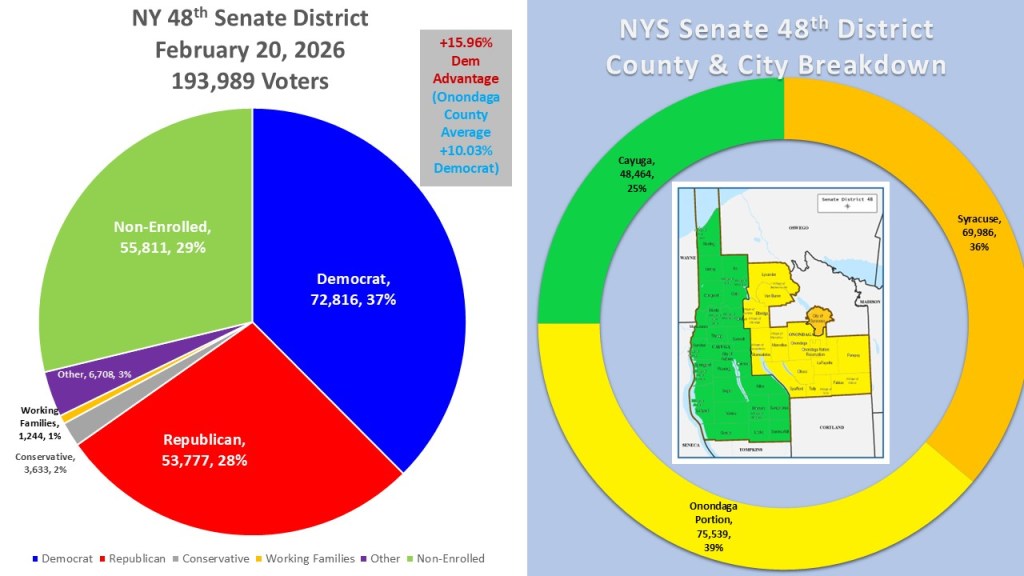
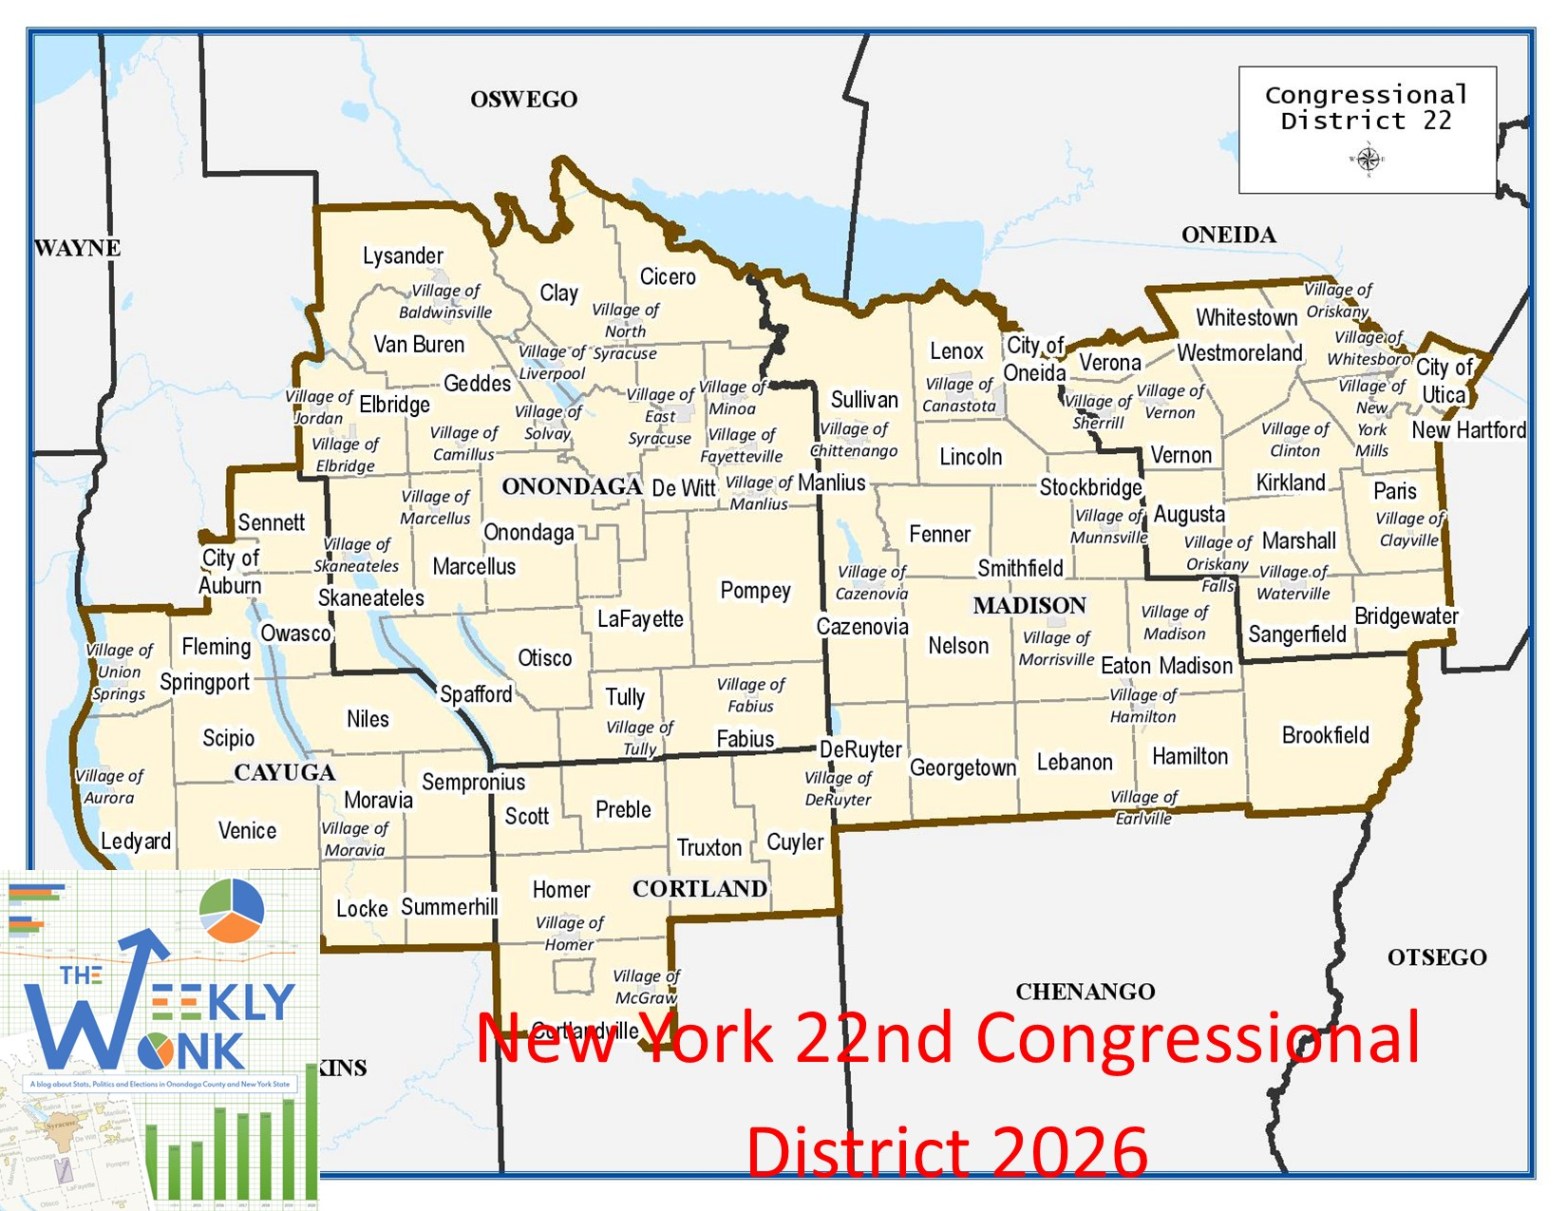
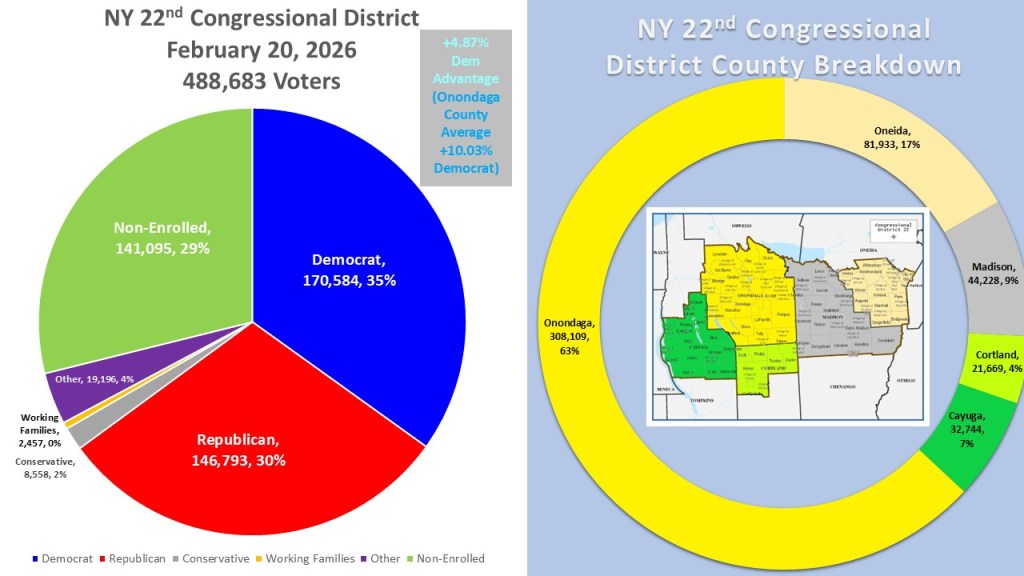
Senate District 50 spans two counties, so this week’s analysis relies on the New York State Board of Elections enrollment files dated February 20, 2026. On that date, the district had 219,485 active voters. Republicans made up the largest group with 71,726 voters (33%), followed by Democrats with 68,177 (31%) and non-enrolled voters with 65,829 (30%). The remaining voters included 8,410 in the “other” category (4%), 4,423 Conservatives (2%), and 920 Working Families Party members (<1%). Oswego and Onondaga counties are the major divides in SD 50. Although the Oswego County portion covers more geographic area, it contains just 56,901 voters, or 25% of the district total. The Onondaga County portion includes the northern towns of Clay and Cicero, the eastern towns of DeWitt and Manlius, and the western towns of Geddes and Camillus. Together, those towns account for 162,584 active voters, or 74% of the district.
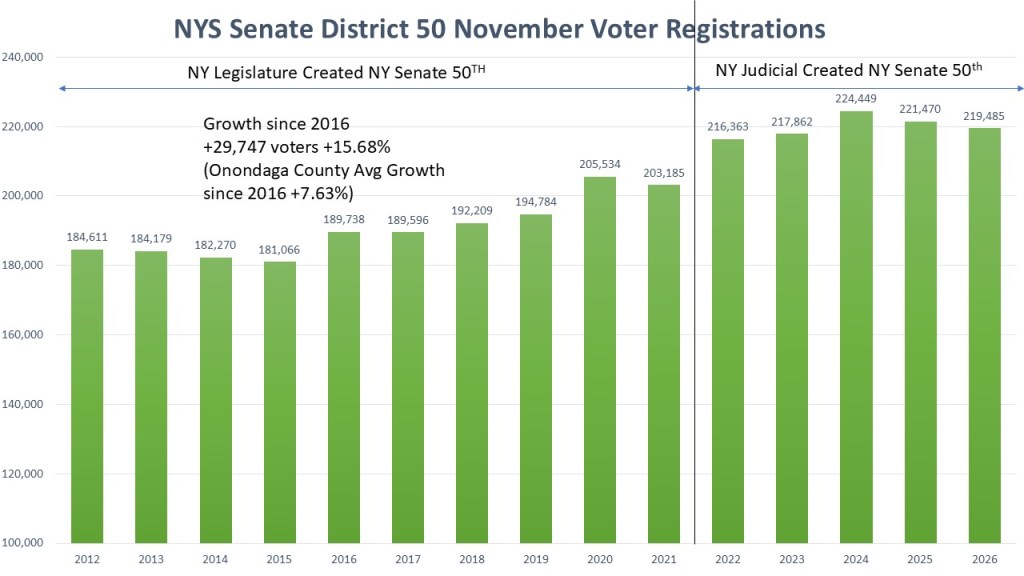
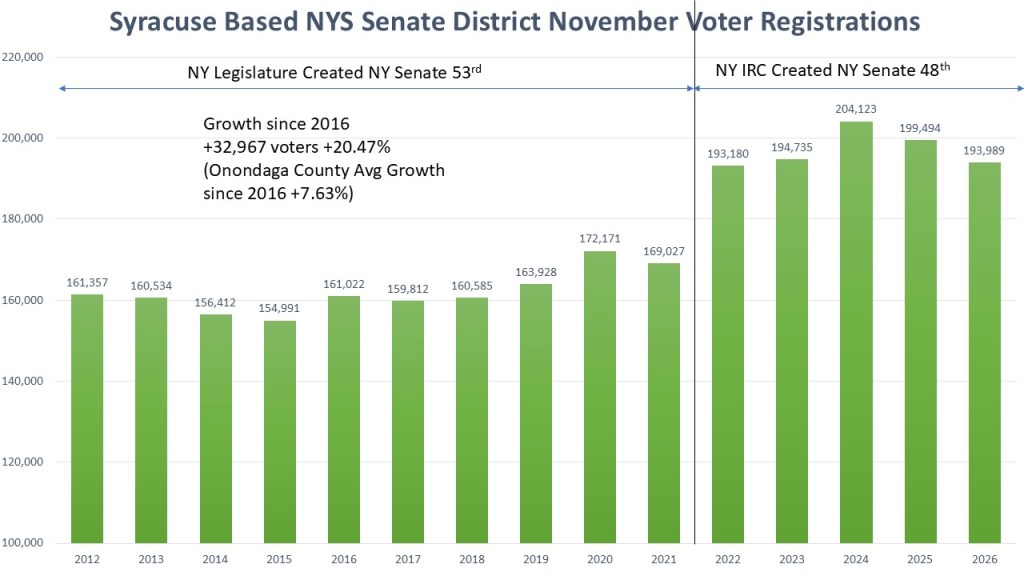
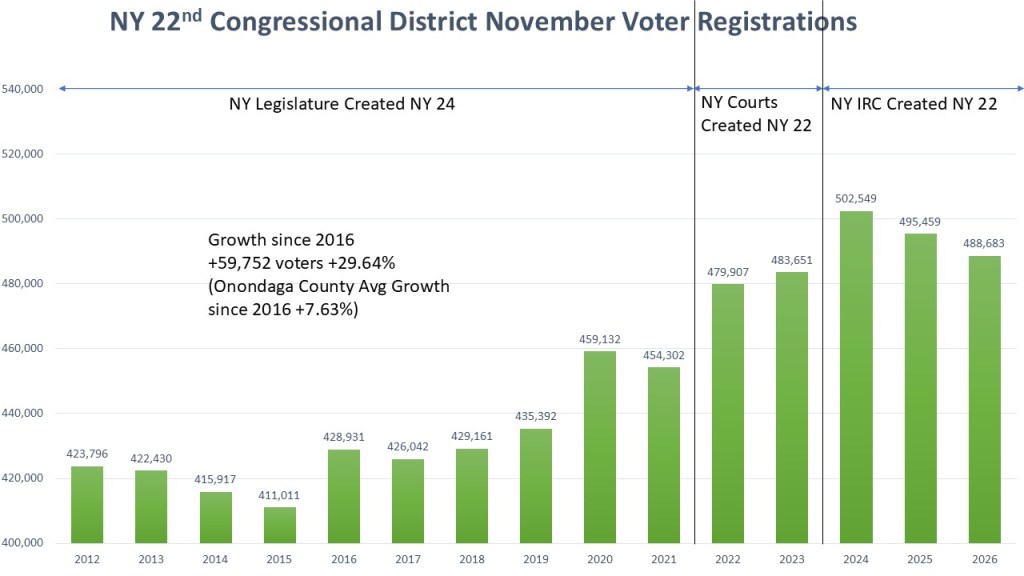
The story of NY Senate District 50 revolves around the redistricting of 2022. The district used to be partially in Syracuse (though only a small chunk), then spread north and west into Cayuga County. The 2022 map, drawn by a special master appointed by the NY Supreme court, came about after the NY Appeals court deemed the legislature drawn map unconstitutional. Unlike the Congressional map, the special master map remains the map today. The NY Independent redistricting Commission never redrew them as they did the Assembly and Congressional maps. That is why you see such a large population change between 2021 and 2002, and why you will see stark differences in the partisan makeup later. It is now a more populous district than before, in fact it has gained 29,747 voters since 2016. That resulted in a +15.68% difference, over double the growth Onondaga County saw at the same time (+7.63%).
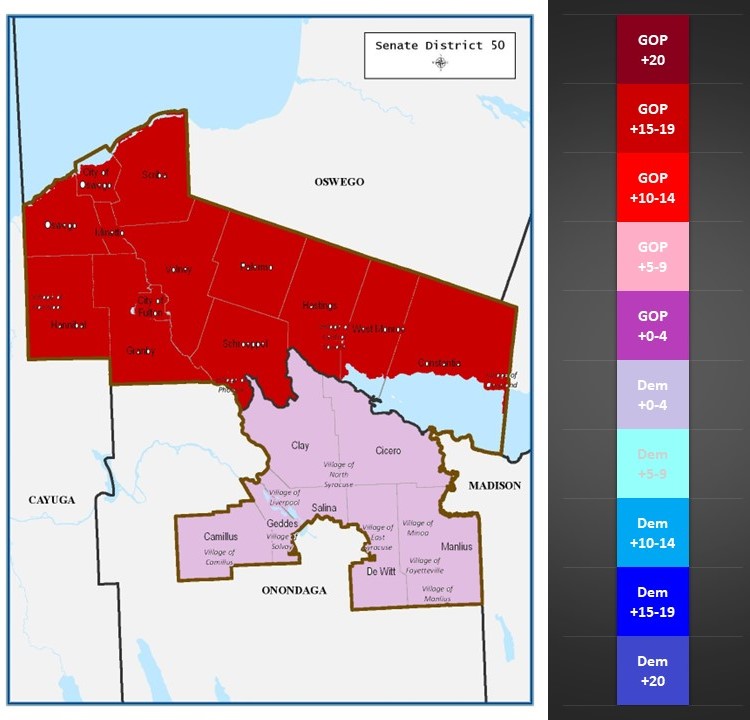
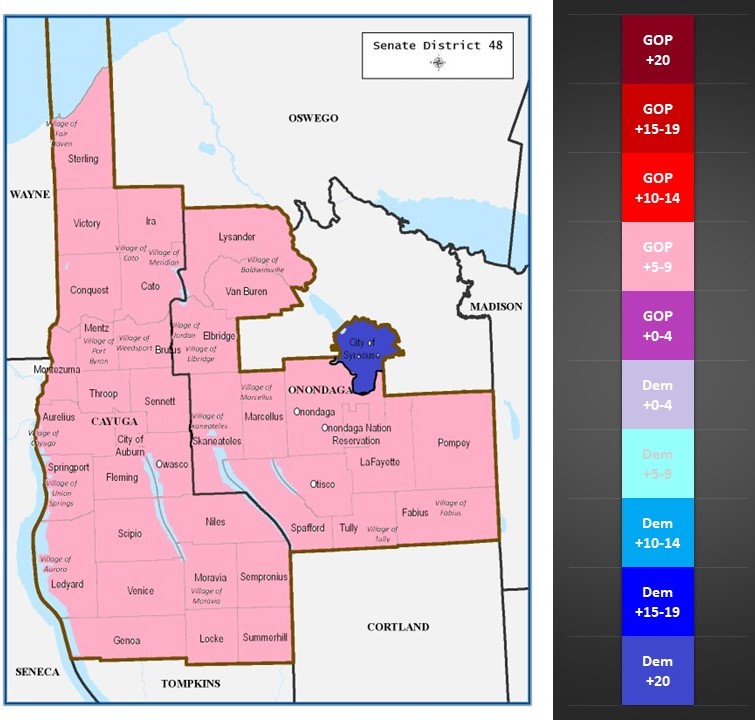
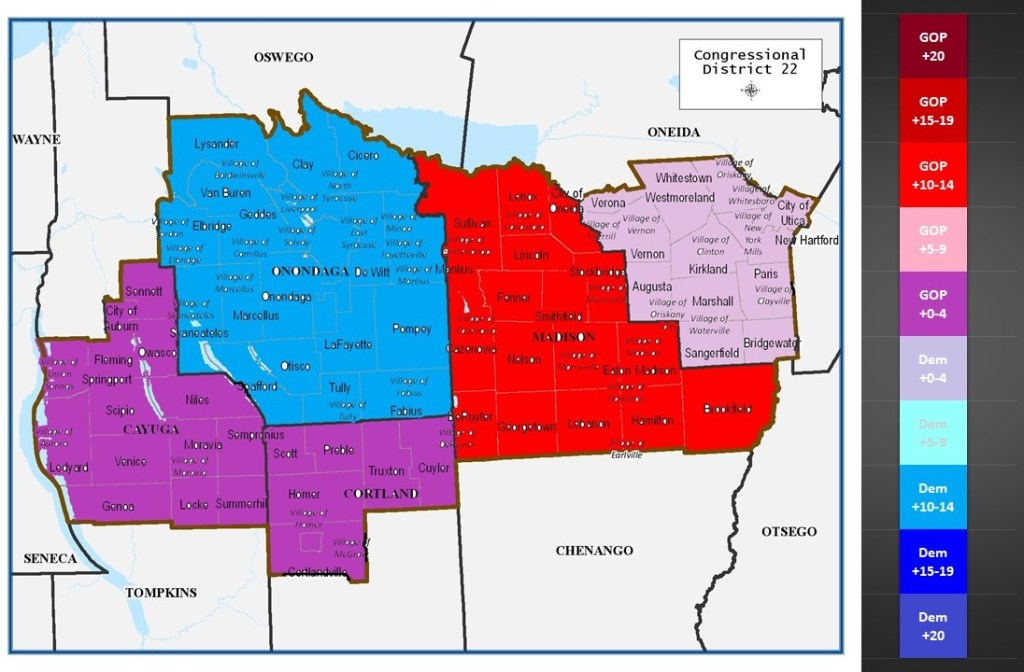
In the heat map we can really see the stark differences between the two halves of the district. The northern Oswego district is smaller, but decidedly more partisan. All together the district has one of the highest GOP ratings we have, in the strong GOP 15-19% dark red stage. The Onondaga County district has three times more voters than the Oswego portion but not as polarized. The suburbs lean Democrat but not as republican as Oswego County. This puts the Onondaga County portion in the borderline blue +0-4% Democrat range.
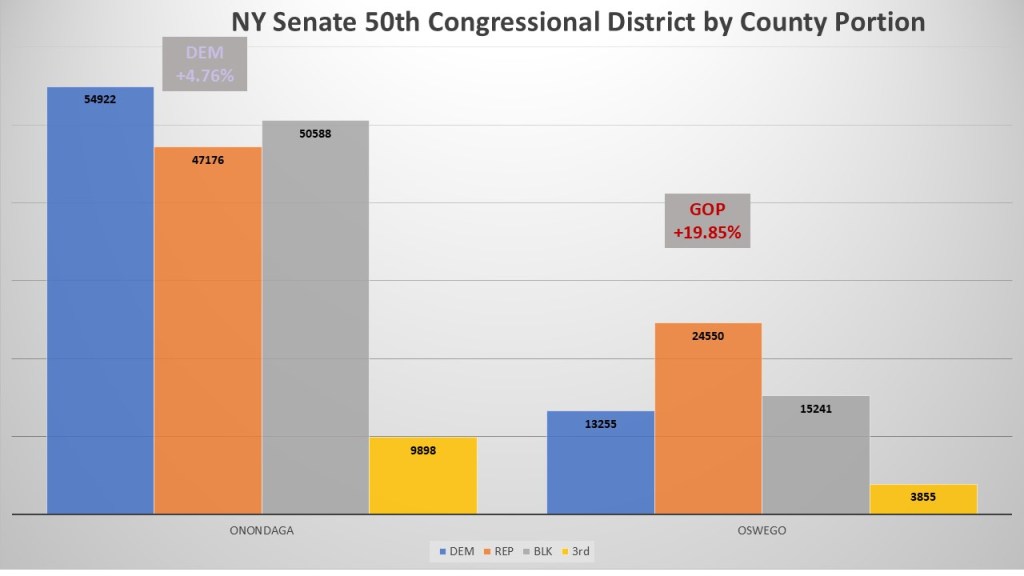
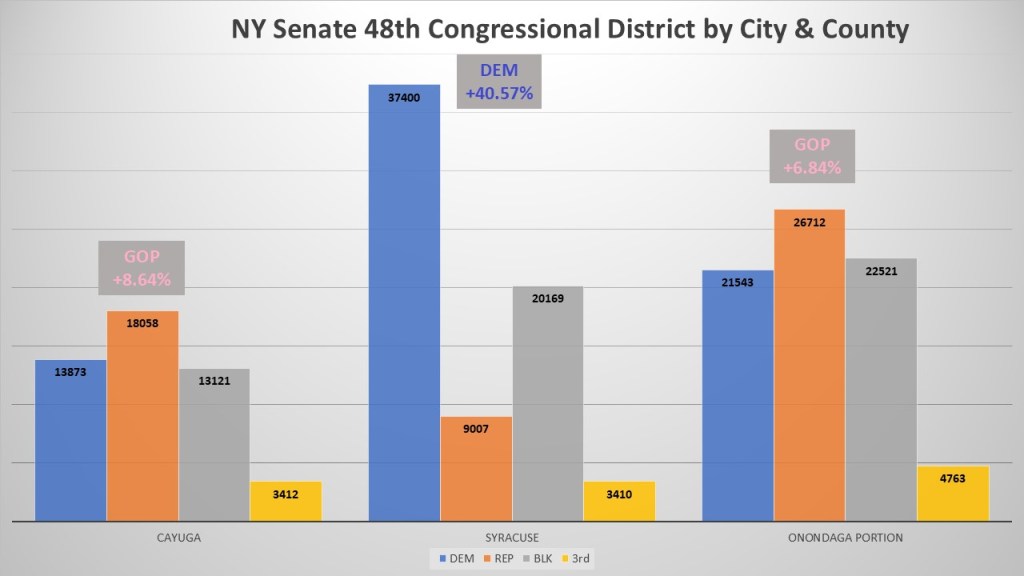
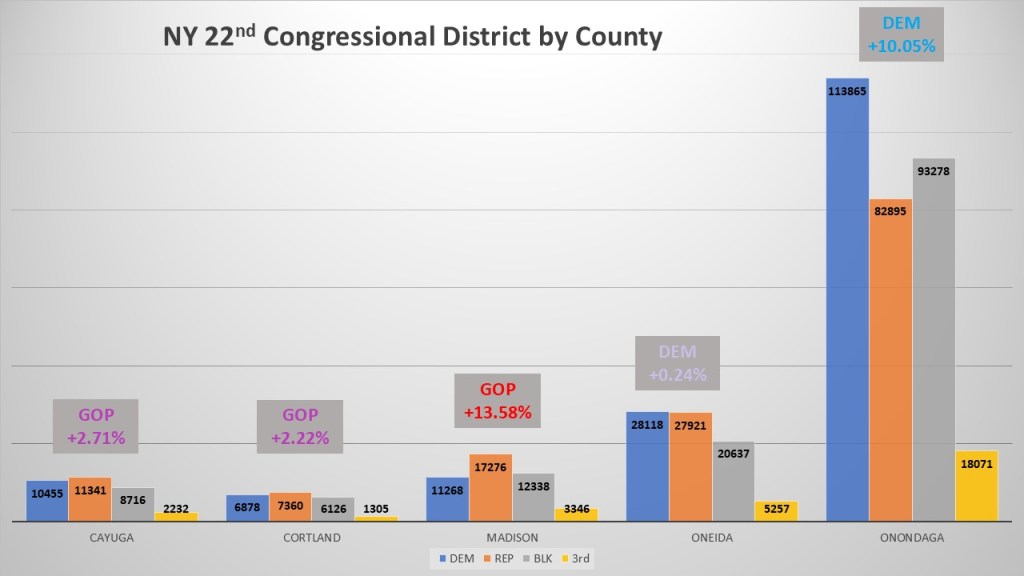
When we dive into the details of these two portions of the district we really see how opposite the two halves of the district are. The Onondaga County Portion Democrats outnumber the GOP by 4.76%. However, the non-enrolled outnumber the GOP. In the Oswego County portion, the GOP nearly double the number of Democrats and hold a +19.85% registration advantage. The non-enrolled here outnumber the Democrats as well.
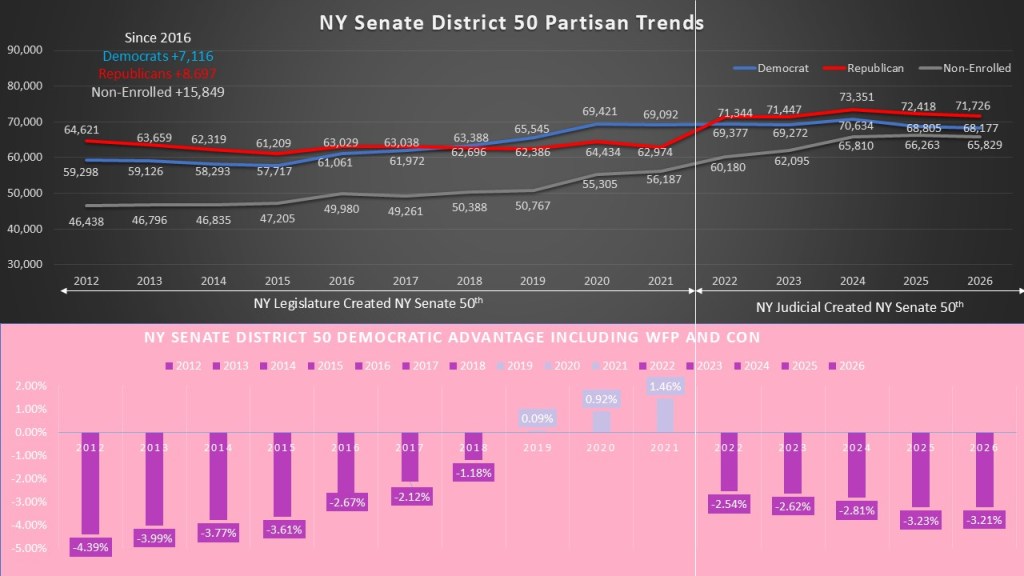
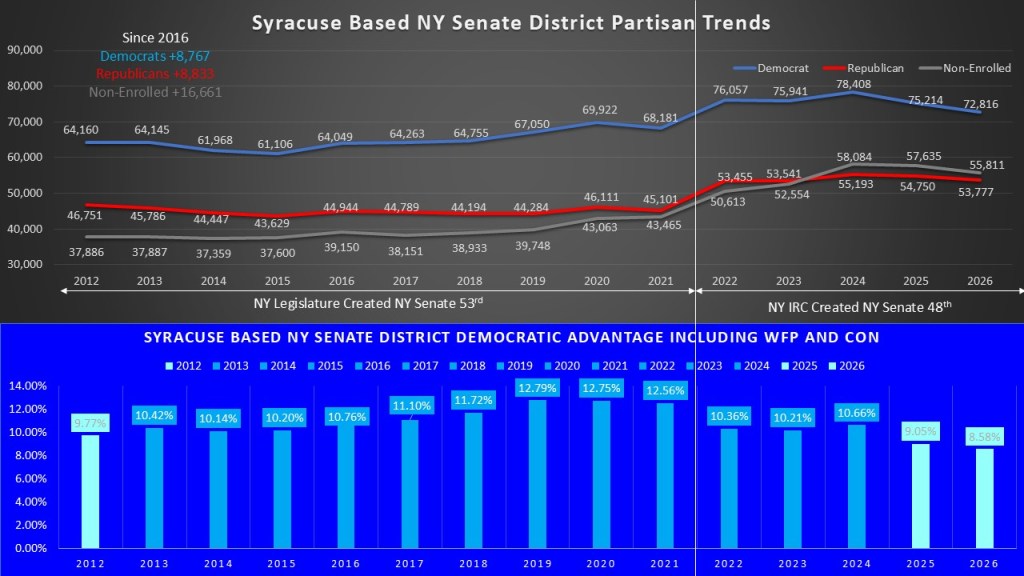
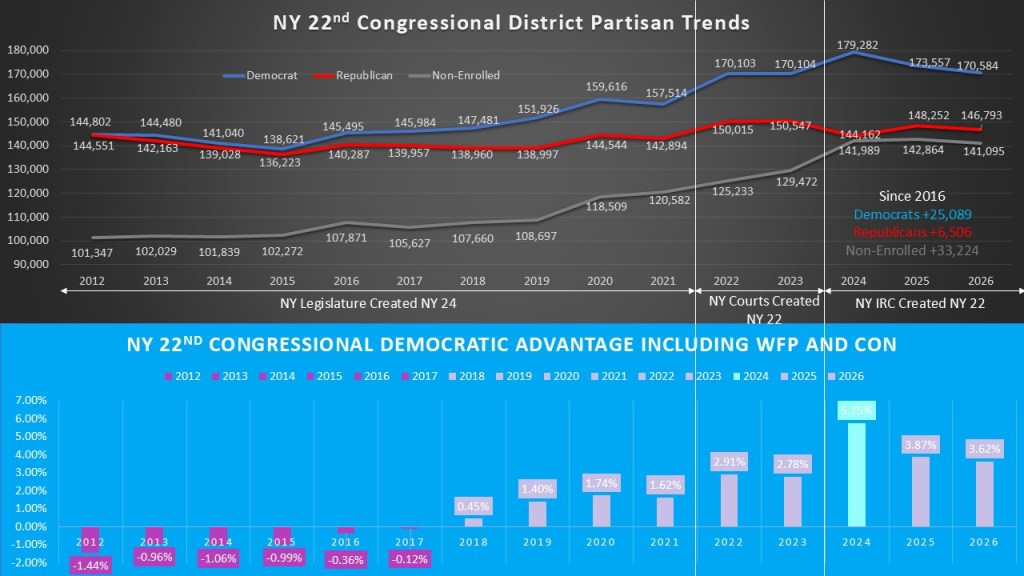
In the partisan trends of SD 50 we can see how the redistricting of 2022 really changed the makeup of the district. As we can see the old, constituted SD 50 under the legislature drawn maps that started in 2012 the district protected Senator John DeFrancisco, a longtime republican representative (Even so much as drawing a small annexation of the City of Syracuse to just encompass his residence). However, as the suburbs grew more blue under the first trump administration, the district started to have not only more Democrats but a growing number of swing vote independents. We see that in 2021 the district was a high-water mark for Democrats in both vote gap and partisan. n. The Special Master map in 2021 altered the regional makeup drastically and “reset” the district back. its traditional republican leans. However, despite the drastic change their effect of the non-enrolled still dominates the district. Si. 2016 Democrats have added 7,116 enrolled voters, Republicans have added 8,697. The. n-enrolled has eclipsed them both together adding 15,849 voters.
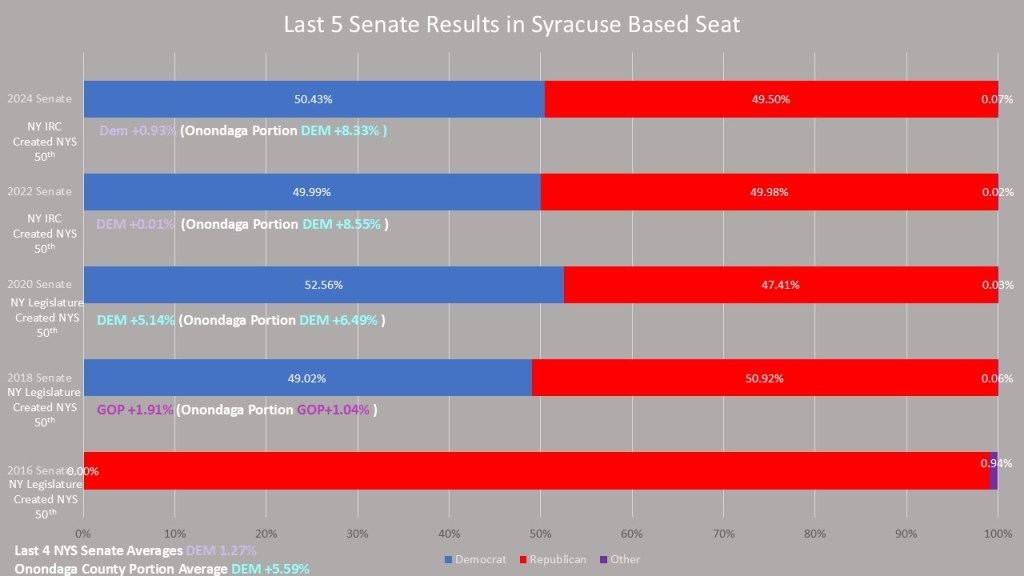
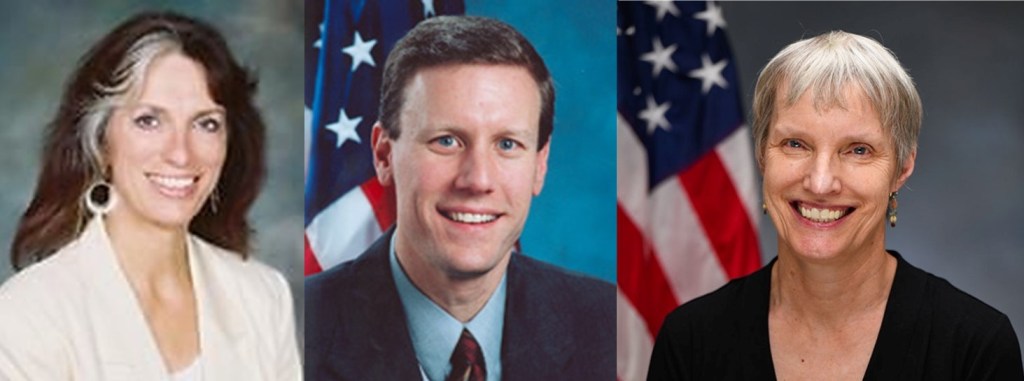
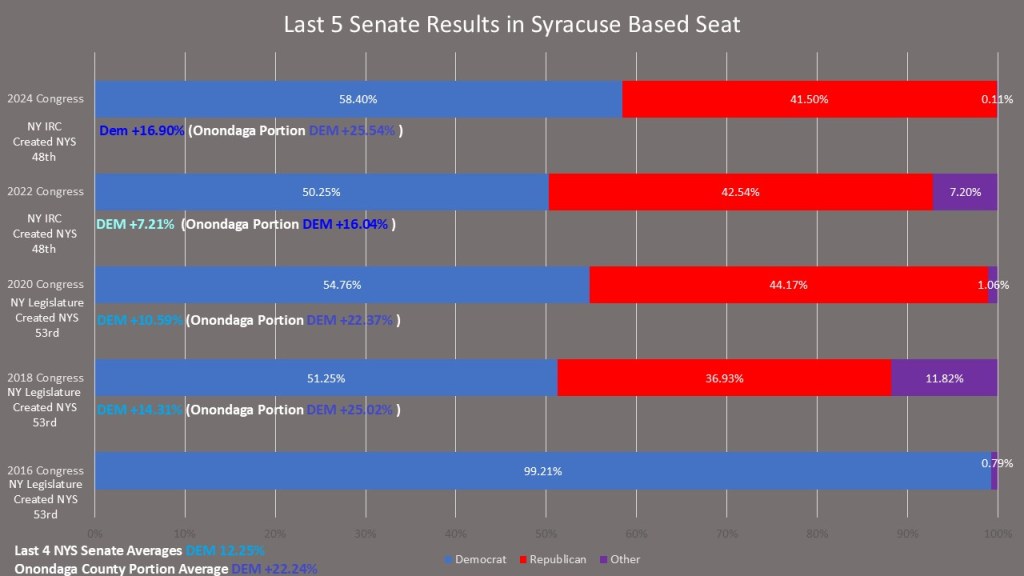
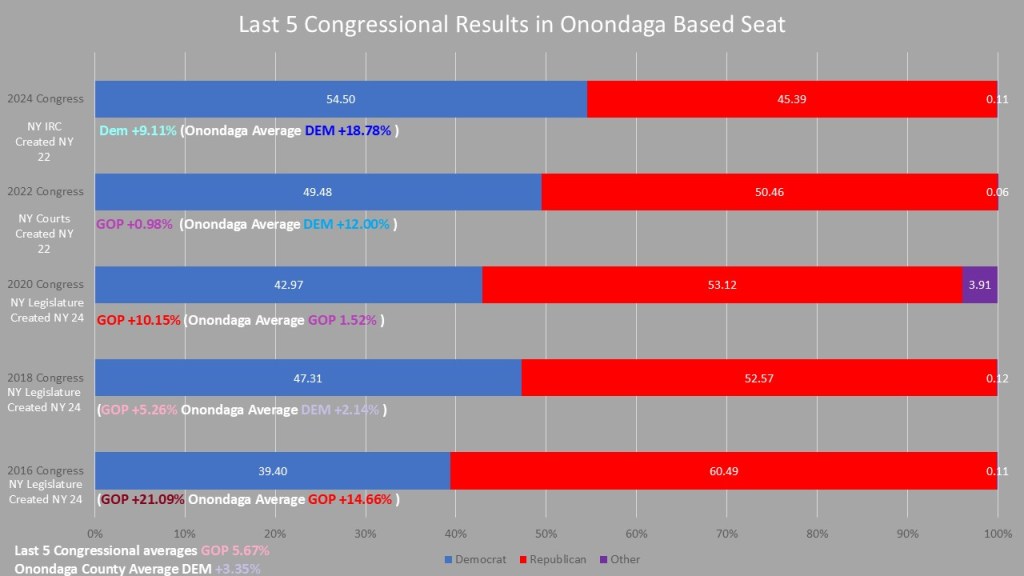
We see the growing influence of independents and drastic redraw effect the last 5 Senate races. In 2016, John DeFranciso’s last runs he ran unopposed. Little known teacher John Mannion came remarkably close to beating Onondaga County Comptroller Rob Antonacci in 2018, coming to beat 1.91%. In 2020 John Mannion finally flipped this seat to the Democrats beating Angie Renna by 5.14%. In 2022 John Mannion won re-election but by one of the closest margins ever in a NY Senate race, by just ten votes after a sprawling hand count that lasted until middle of December. John Mannion left to run for Congress in 2024, and the sitting minority leader of the Onondaga County Legislature Chris Ryan beat Salina town Supervisor by a close 0.93%. Overall, the last 4 Senate races Democrats have averaged a 1.27% margin of victory while winning Onondaga County portion by 5.59%. The redraw in 2021 not only made the elections closer, but it also heightened the difference between the Onondaga County portion and the rest of the district. In 2018 and 2020 there was less than a 2% difference between the result and the Onondaga County portion. In 2022 and 2024 that difference grew to over 8%.
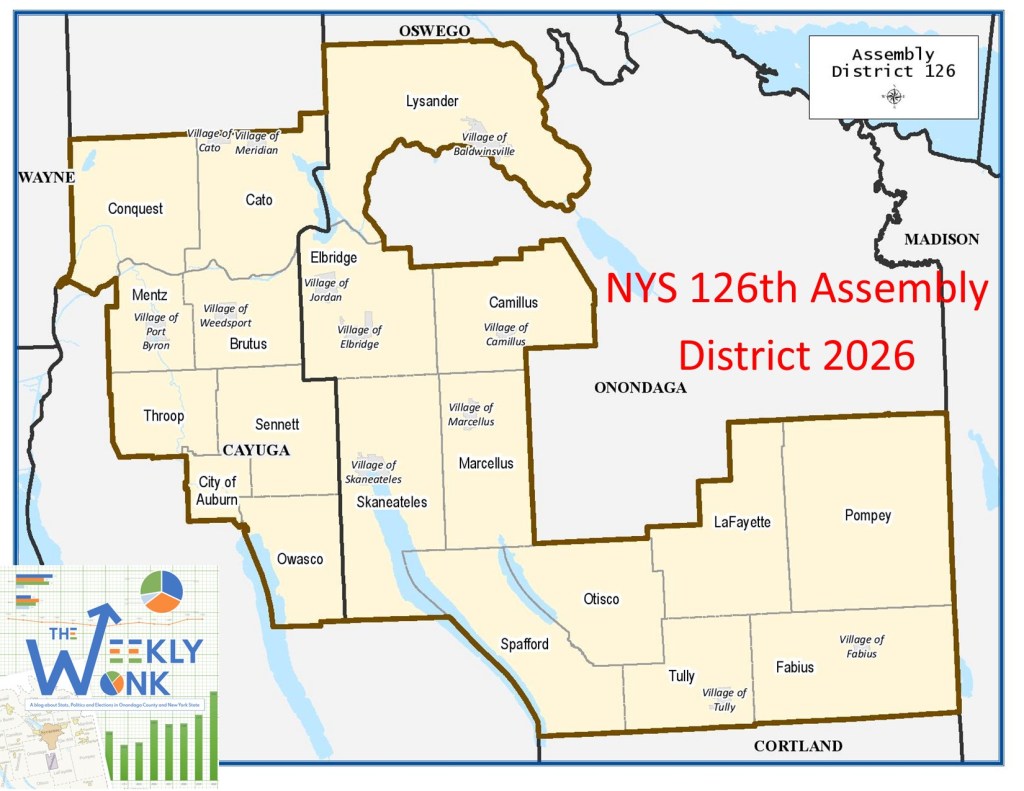
That is, it for this week’s Weekly Wonk. Next week we will move onto the Assembly races in Onondaga County. We will start with the only seat held by a republican, the 126th Assembly seat along the southern and western parts of county and stretching into Cayuga County. As always, you can follow along by subscribing to dustinczarny.com to get all content and election news updates.