Welcome back to the #WeeklyWonk, my weekly article on Dustinczarny.com exploring election statistics and data. Each week, I examine a political subdivision with a competitive election this fall and analyze its voter registration, election results, and other relevant data. The goal is to help readers better understand the stories behind election outcomes across our home county of Onondaga. This week, I begin a series examining the towns that nominate candidates through caucuses for the fall elections. I start with the Town of Camillus, one of the most closely contested towns in 2025 and one that will again feature competitive races in 2026.
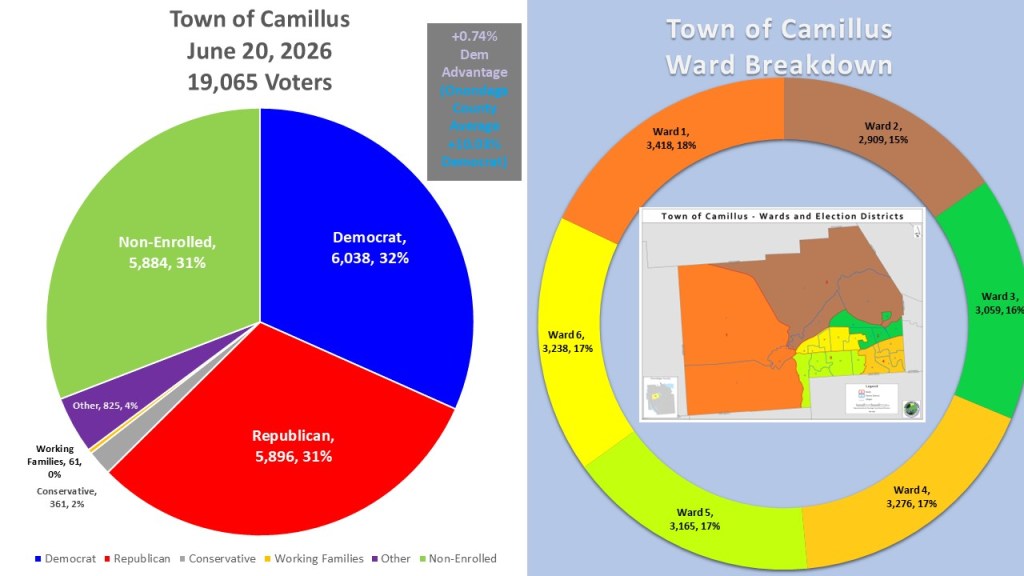
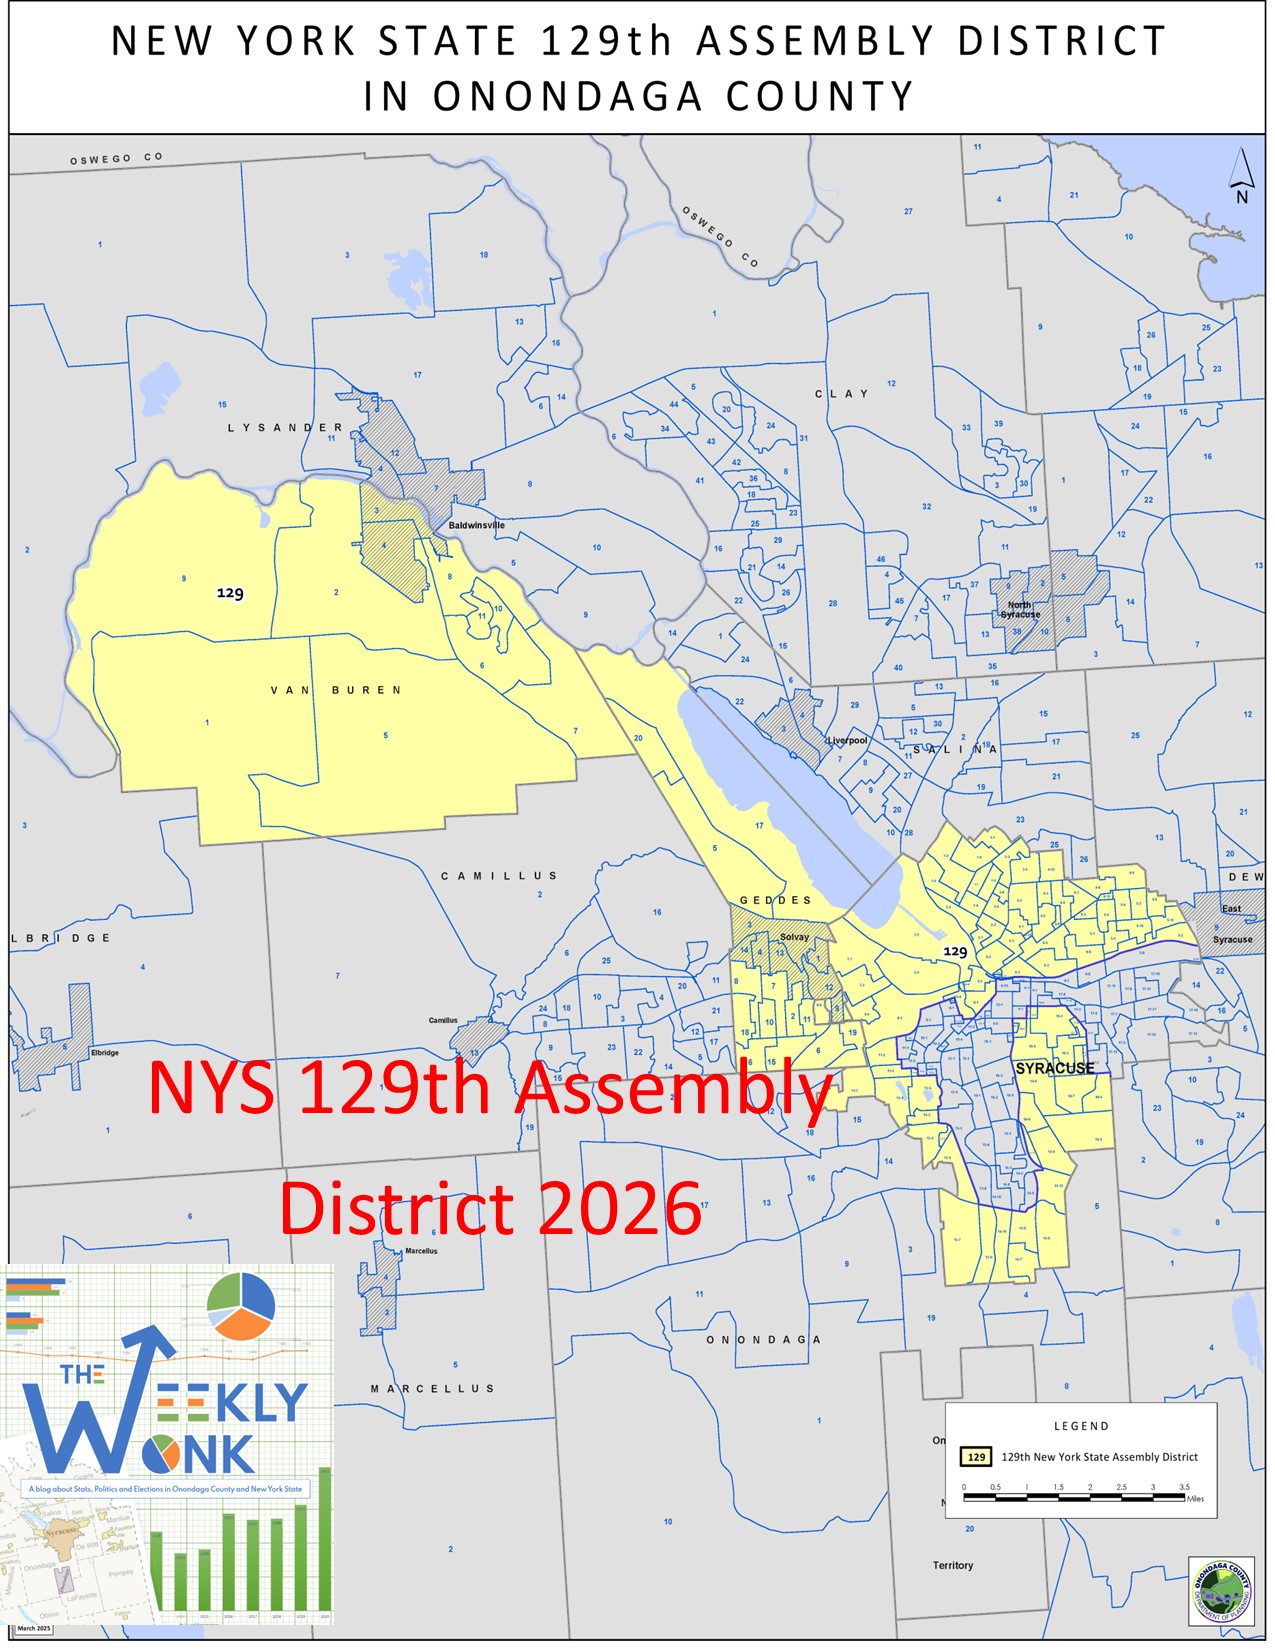
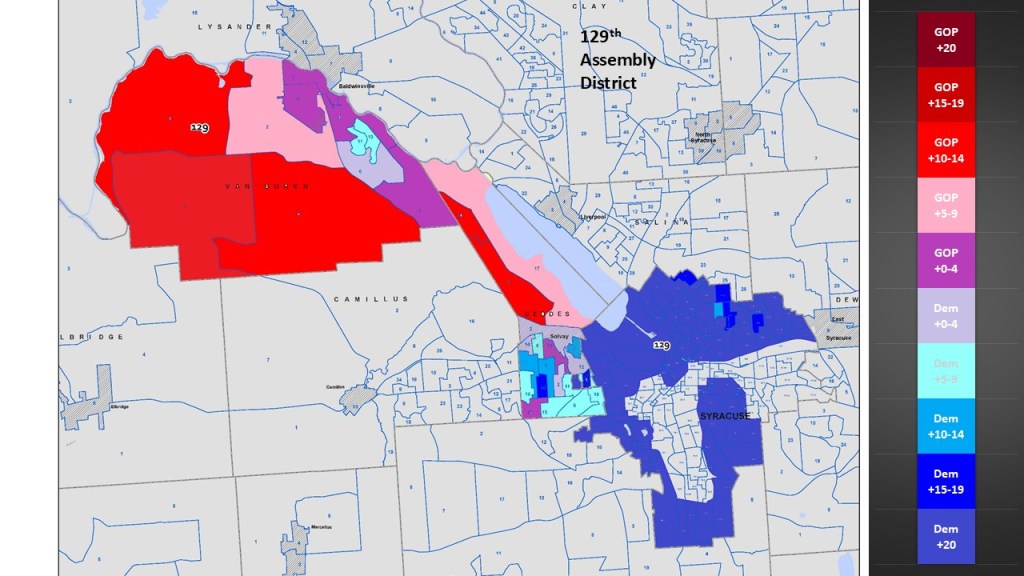
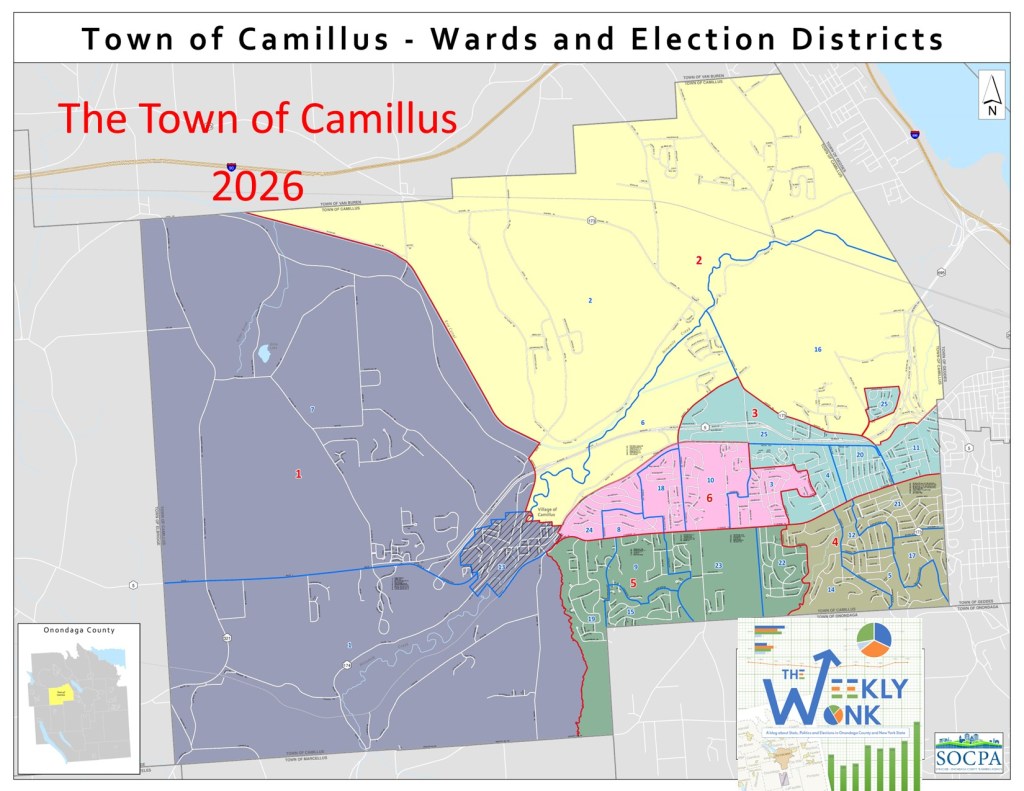
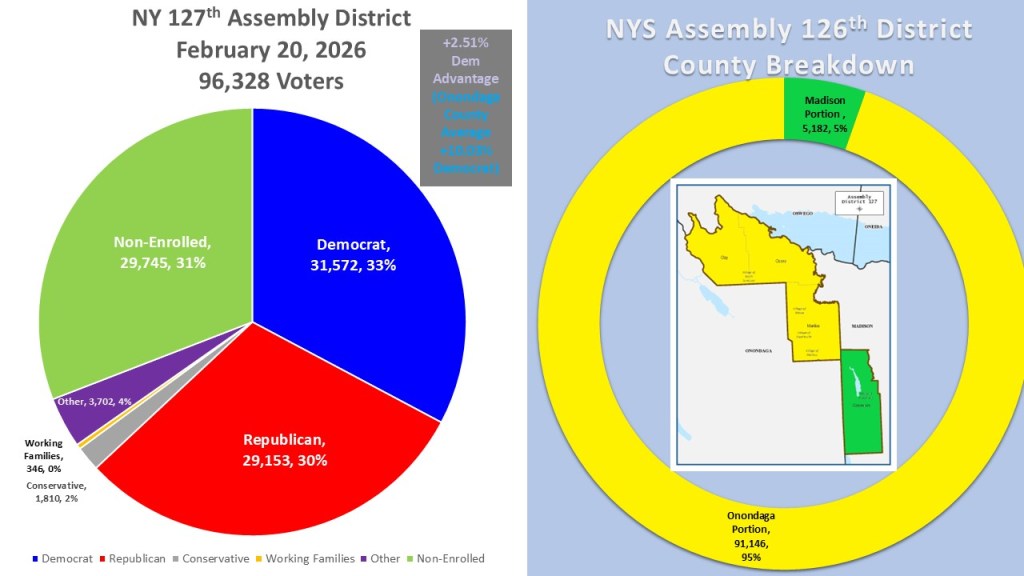
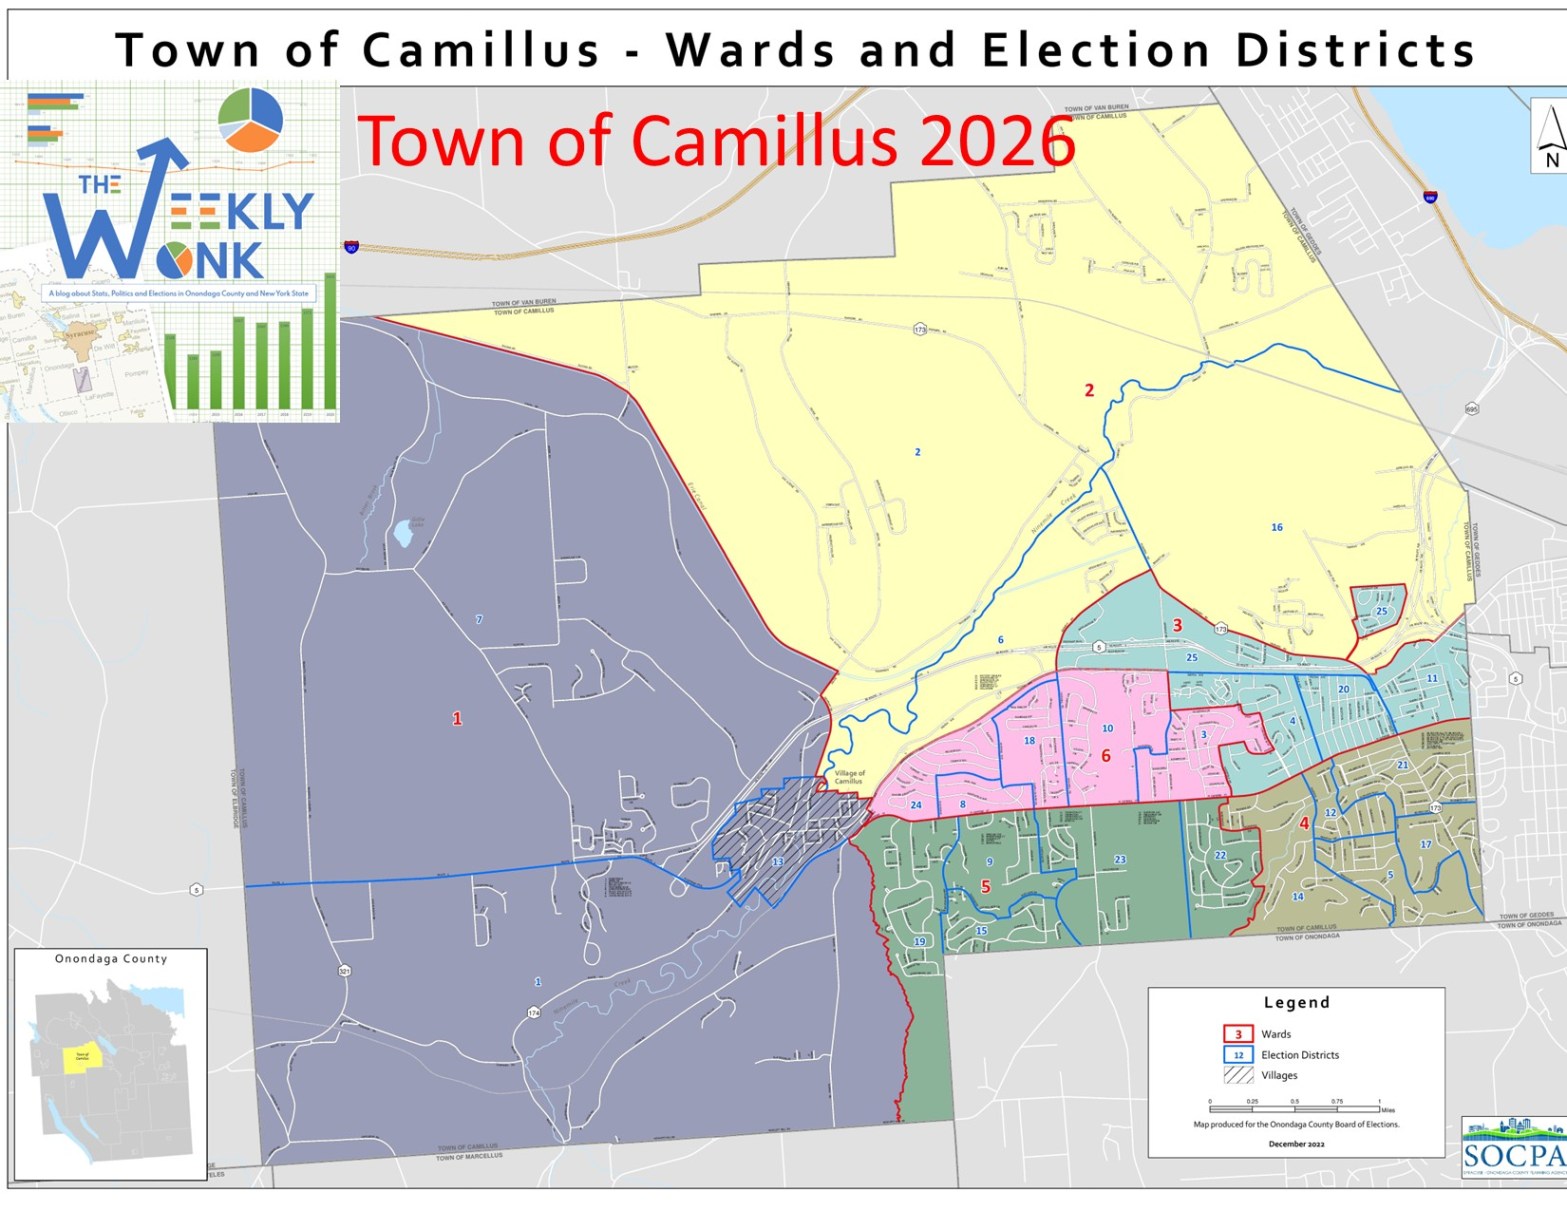
As of June 20, 2026, the Town of Camillus has 19,065 active voters. Democrats hold a narrow plurality with 6,038 voters (32%). Republicans are a close second with 5,896 voters (31%), while non-enrolled voters are an even closer third with 5,884 voters (31%). The remaining registration consists of voters in the “Other” category (825, 4%), the Conservative Party (361, 1%), and the Working Families Party (61, less than 1%). Democrats currently hold just a 0.74% registration advantage, making Camillus one of the most evenly divided towns in Onondaga County. Camillus is also one of only two towns in the county that elect Town Board members by ward rather than at-large. Instead of running townwide, candidates compete within six geographically defined wards, as shown in the chart above.
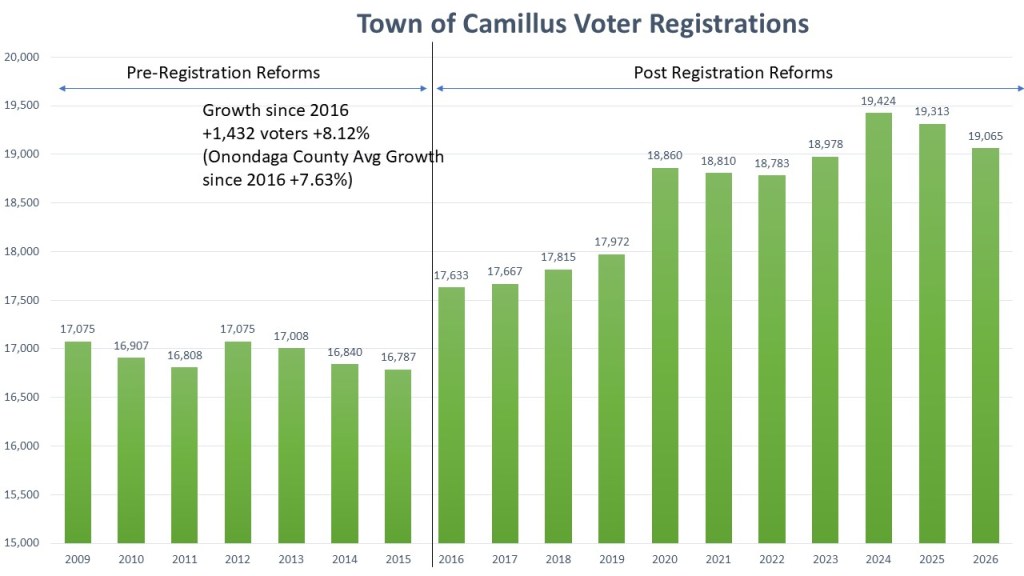
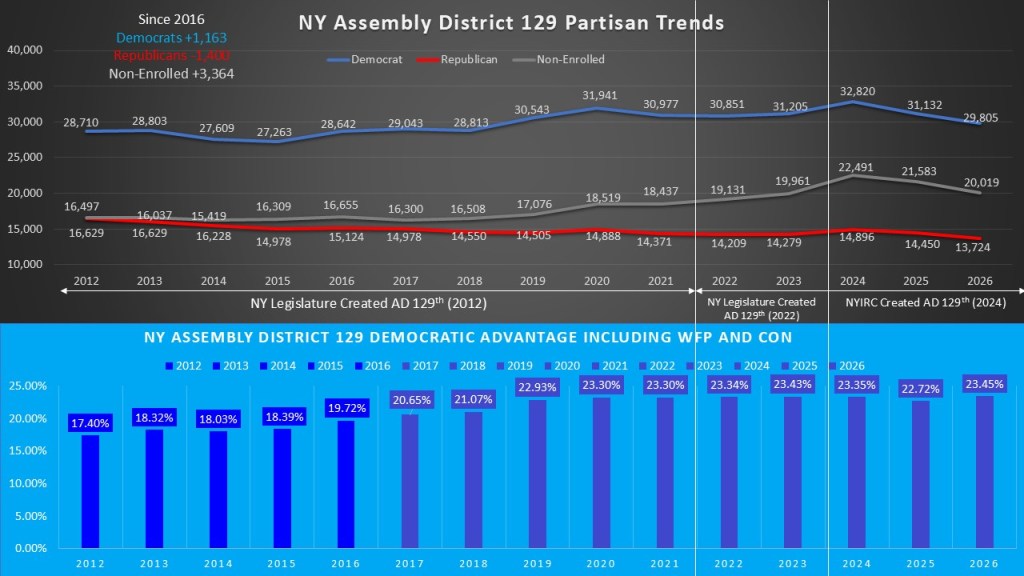
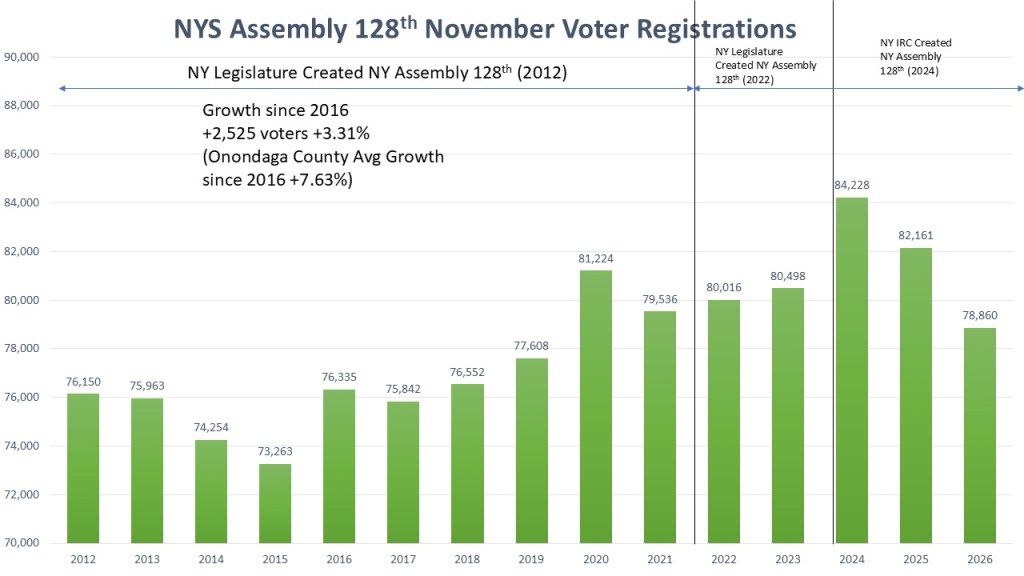
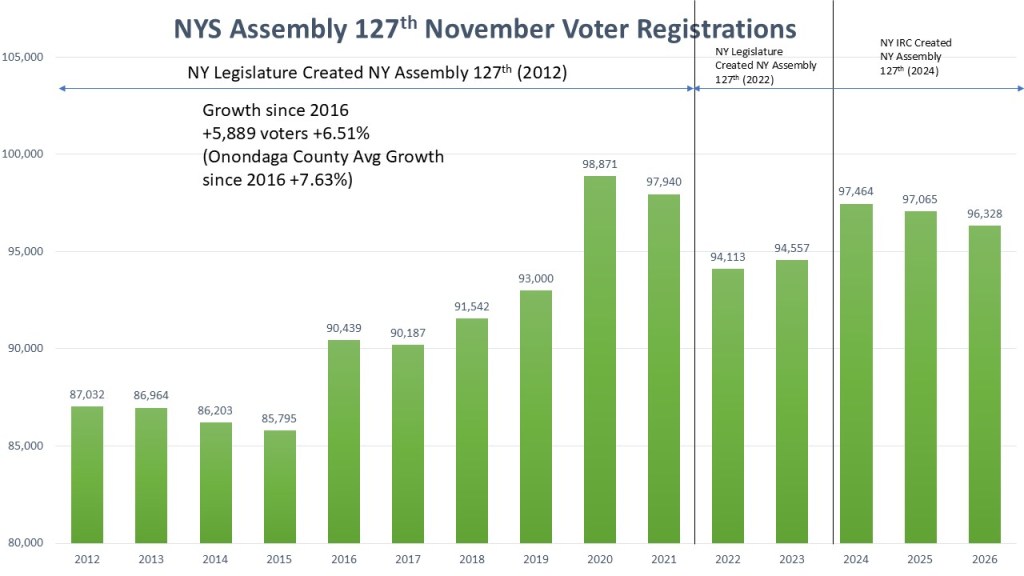
Unlike the state legislative districts analyzed in recent weeks, redistricting has had little impact on town boundaries. While minor adjustments occasionally occur in Camillus and Salina, the more significant factor affecting voter registration has been New York’s voting reforms. Beginning with online voter registration through the DMV in 2016 and accelerating with reforms enacted by the unified Democratic state government in 2019, voter registration has increased substantially. Since 2016, Camillus has added 1,432 active voters, an increase of 8.12%, slightly above Onondaga County’s overall growth rate of 7.63%.
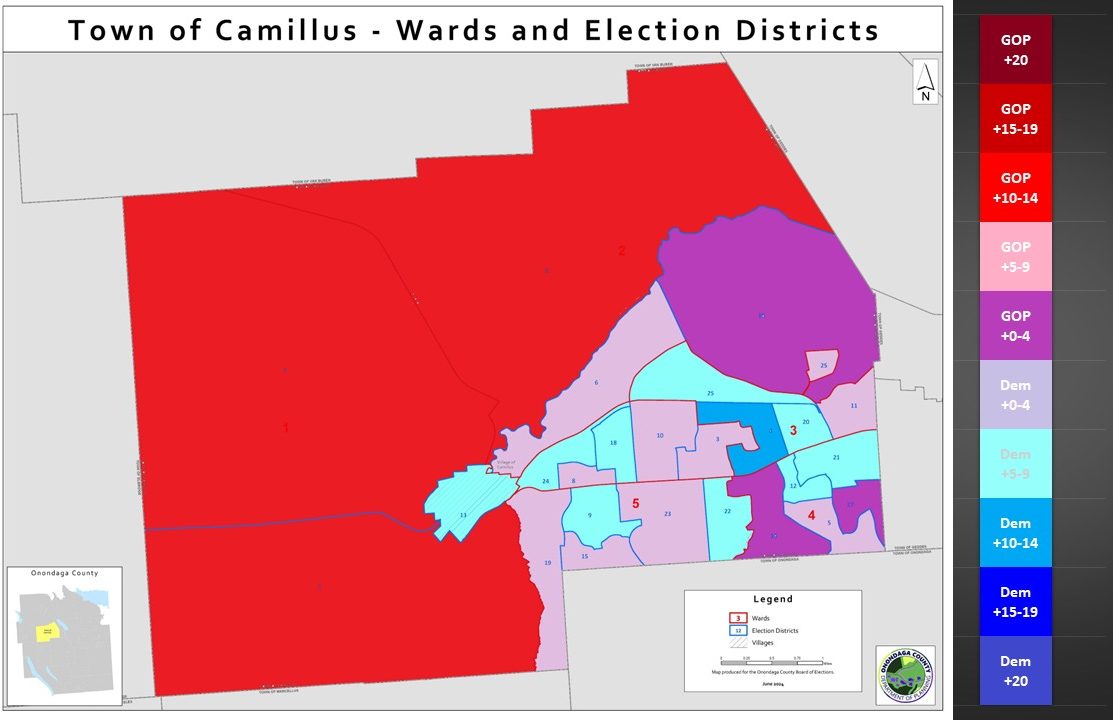
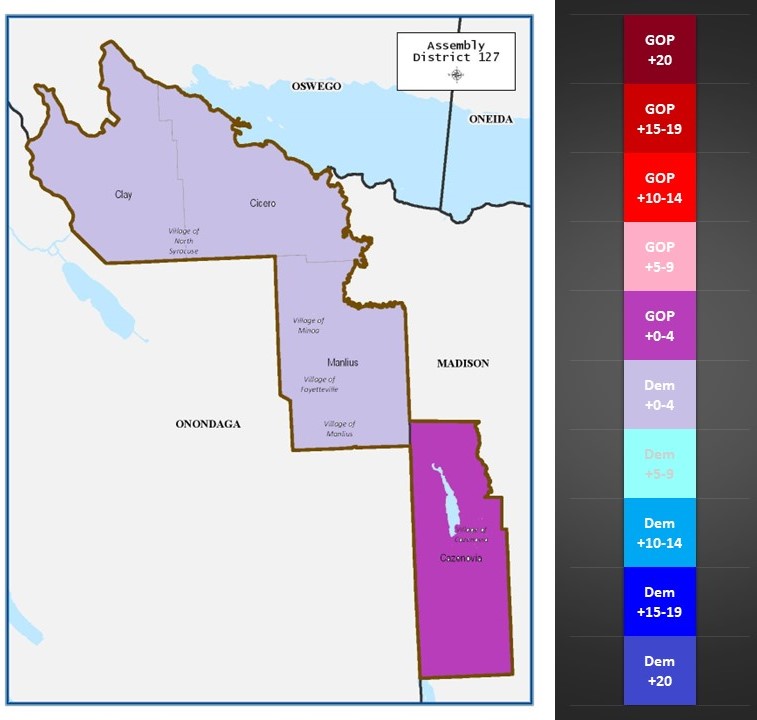
The registration heat map demonstrates just how evenly divided Camillus is, even at the election district level. Ten election districts fall into the light-purple category, indicating a slight Democratic advantage of 0–5%. Three districts are dark purple, reflecting a slight Republican advantage of 0–5%. Several districts are light blue, showing a Democratic advantage of 5–9%, while one district is solid blue with a Democratic advantage between 10% and 14%. Three northern and western election districts are solid red, indicating Republican advantages between 10% and 14%. Altogether, these patterns reinforce the balanced political nature of the town.
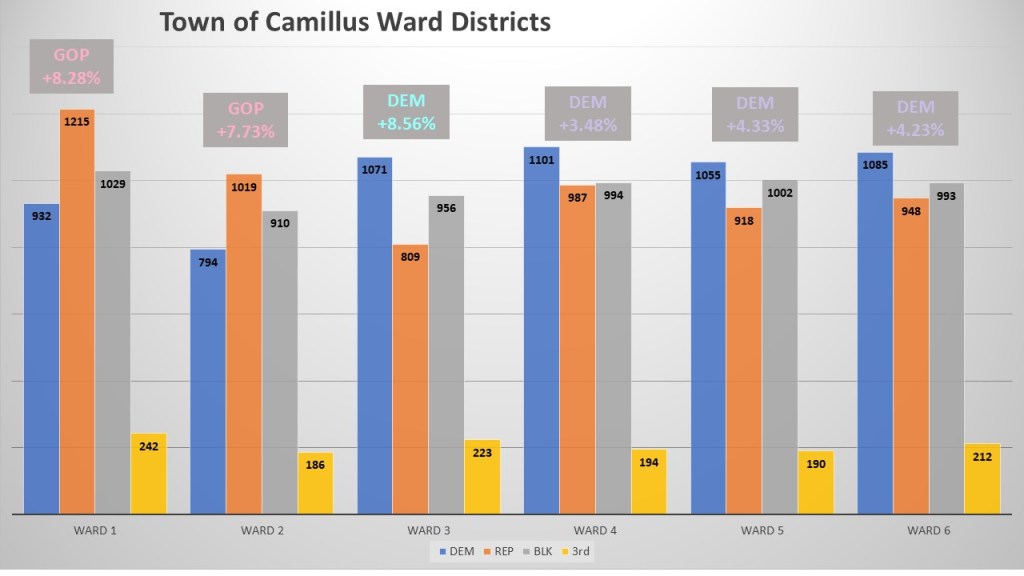
The ward structure further illustrates why Camillus remains so competitive. In 2025, Democrats won three Town Board seats for the first time in several election cycles. Those victories came in Ward 3, which has an 8.56% Democratic registration advantage; Ward 4, with a 3.48% Democratic advantage; and Ward 6, with a 4.23% Democratic advantage. Notably, these were the only wards where Democrats fielded candidates. Meanwhile, Republicans continue to represent Ward 1, where Republicans hold an 8.28% registration advantage; Ward 2, with a 7.73% Republican advantage; and Ward 5, despite a Democratic registration advantage of 3.48%. As a result, a gain of just one additional seat could shift control of the Town Board.
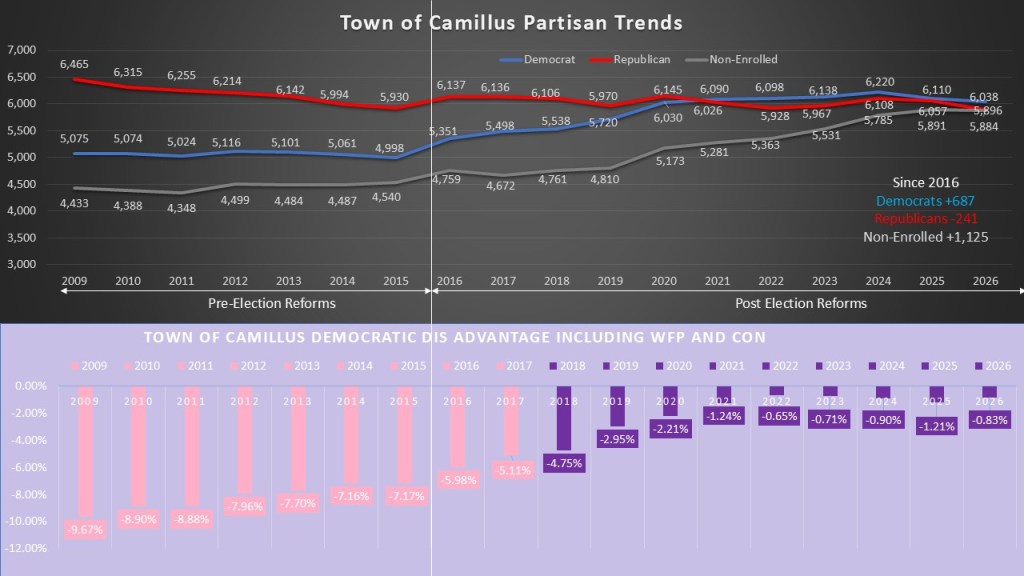
Like many suburban communities, Camillus has steadily become more competitive for Democrats over the last two decades. In 2009, the town maintained a clear Republican registration advantage. Democratic gains were already underway in many suburbs, but those gains accelerated after 2016 as suburban voters became increasingly receptive to Democratic candidates. Since 2016, Democrats have added 687 voters while Republicans have lost 241. The biggest story, however, is the growth of non-enrolled voters, who have increased by 1,125 registrants and now nearly equal Republicans in number. Despite the Democrats’ narrow registration edge, Republicans still benefit from the presence of the Conservative Party, whose voters typically support Republican candidates at much higher rates than Working Families Party voters support Democratic candidates. When Conservative registrations are combined with Republican registrations, right-leaning candidates hold an effective registration advantage of approximately 0.83%.
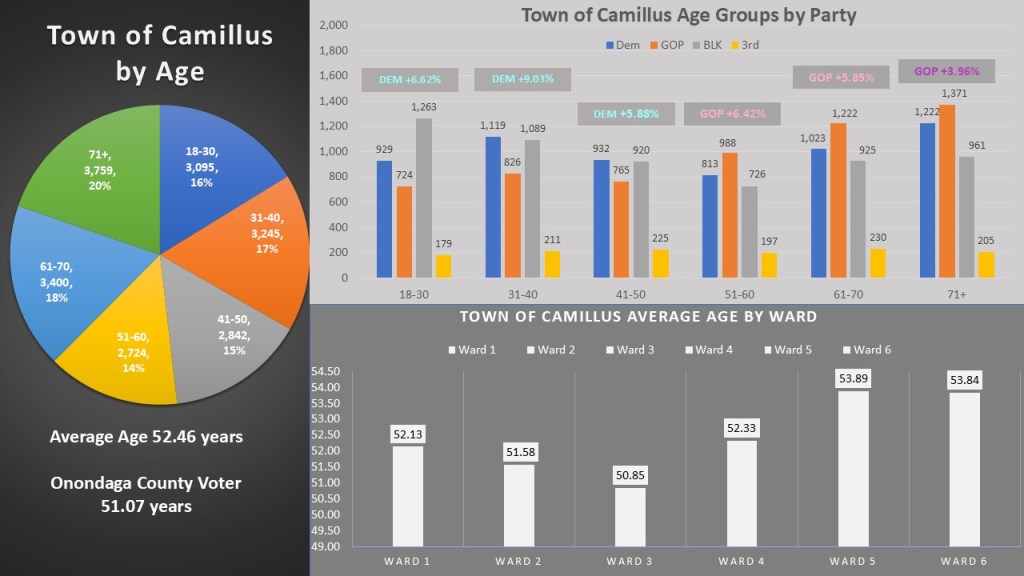
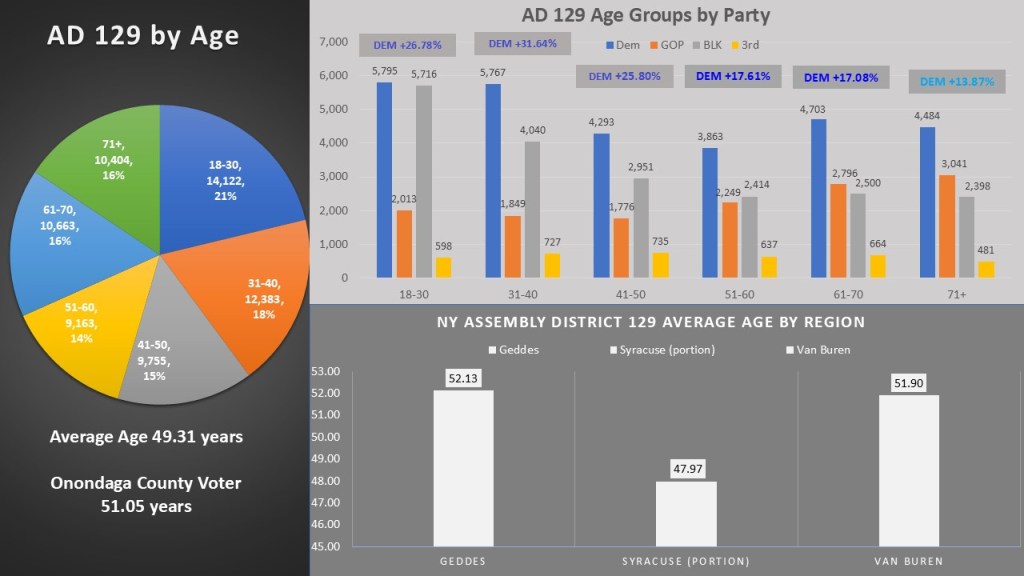
Age demographics provide another example of Camillus’s political divide. The average voter age in the town is 52.46 years, slightly older than the countywide average of 51.07 years. Voters aged 71 and older make up the largest age group at 20% of the electorate. At the same time, younger voters are becoming increasingly influential. Voters under age 50 generally lean Democratic, while voters over age 50 tend to lean Republican. The wards tell an interesting story as well. Ward 3 is the youngest, with an average voter age of 50.85 years, slightly younger than the county average. Ward 2 follows at 51.58 years. Wards 1 (52.13) and 4 (52.33) are close to the town average, while Wards 5 (53.89) and 6 (53.84) are significantly older than the rest of the town.
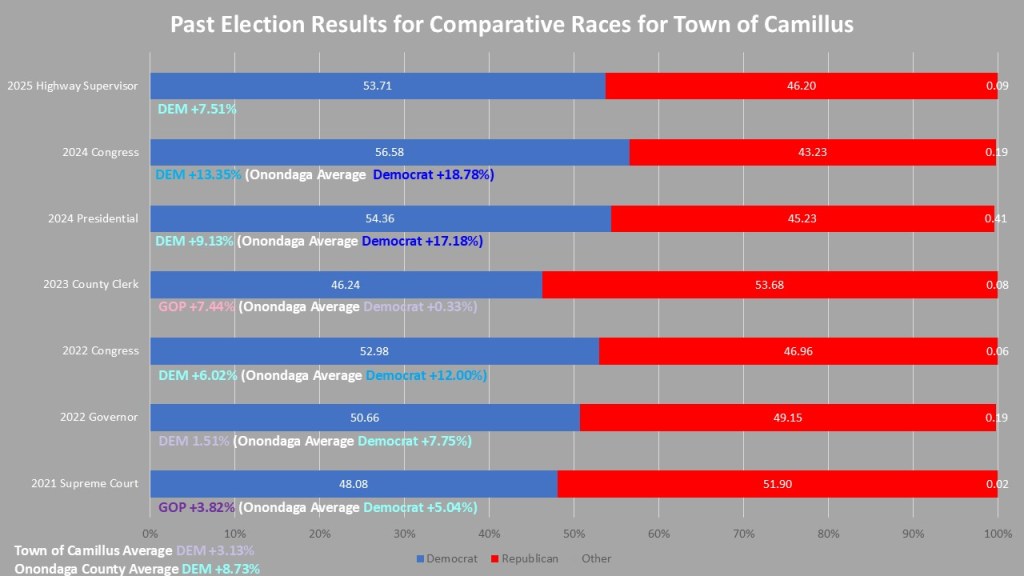
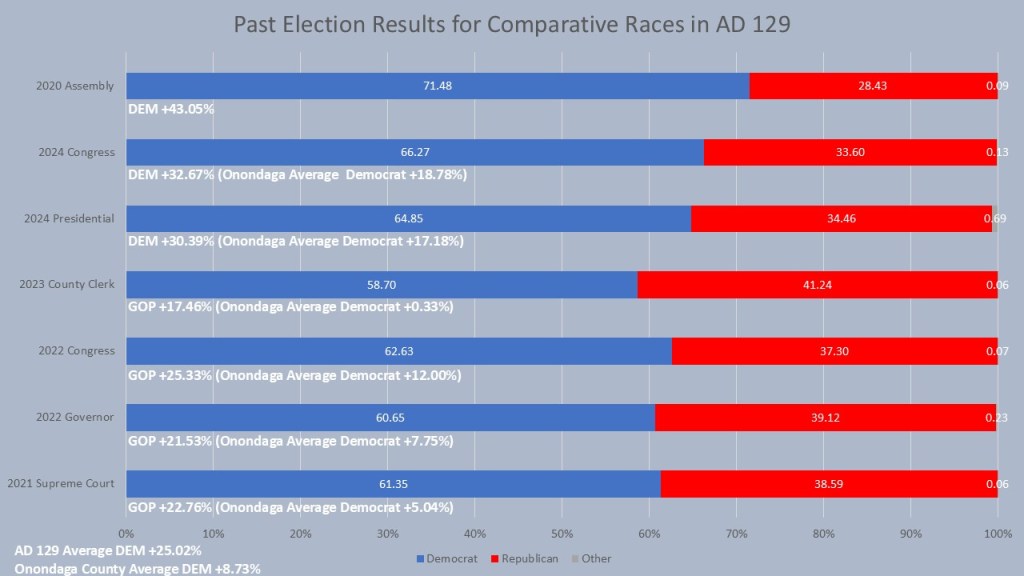
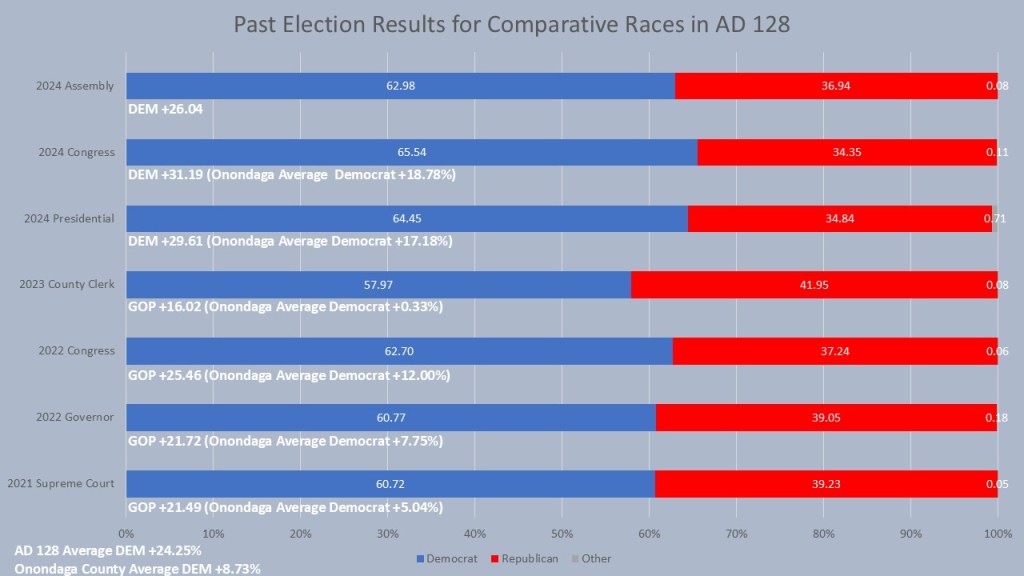
Camillus also behaves differently in even-year and odd-year elections. In the seven federal and statewide races included in this analysis, Camillus has generally favored Democrats. In 2024, John Mannion carried the town by 13.35%, while Kamala Harris won it by 9.13%. In gubernatorial election years, however, results are much closer. Fran Conole carried Camillus by 6.02% in his congressional race, while Governor Kathy Hochul won the town by only 1.51%. Odd-year elections have tended to favor Republicans. In 2023, Lisa Dell carried Camillus by 7.44% in the County Clerk race, while Danielle Fogel won the town by 3.82% during her successful campaign for State Supreme Court. This makes Ken Stoneberg’s 7.15% victory for Town Supervisor in 2025 particularly notable for a Democratic candidate. Across all comparable races, Democrats average a 3.13% advantage in Camillus, considerably lower than the countywide average Democratic advantage of 8.73%.
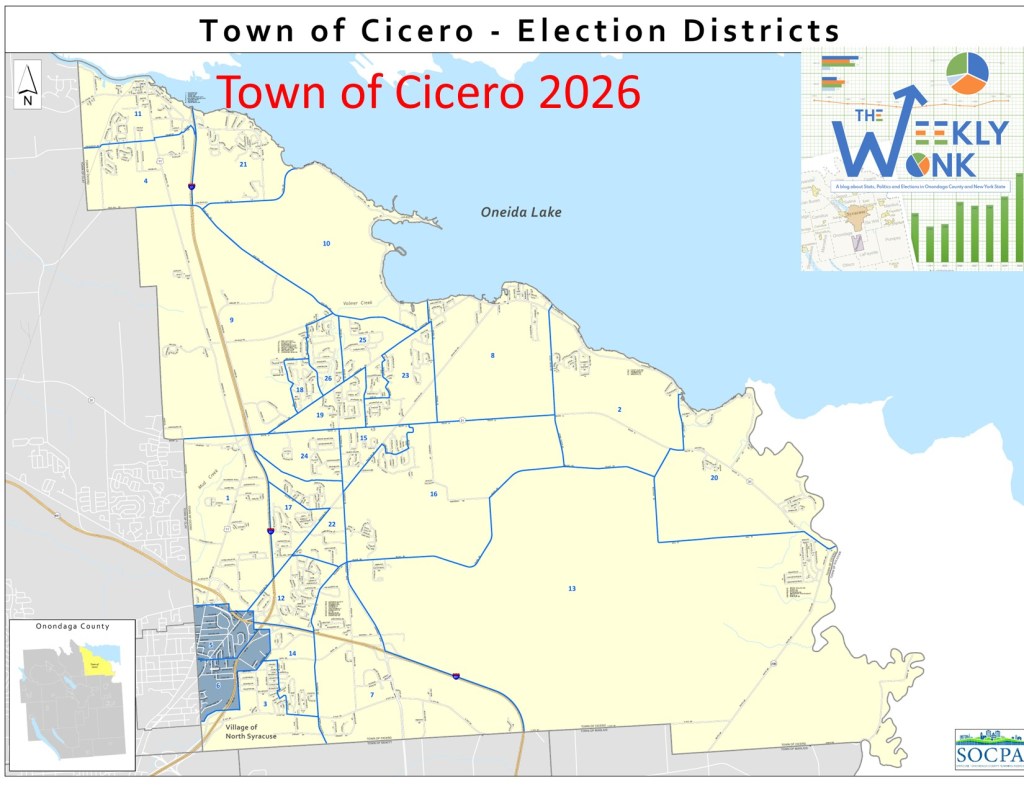
That’s it for this week’s edition of the #WeeklyWonk. Next week, I will continue my tour of the caucus towns with the Town of Cicero. While traditionally one of the reddest towns in Onondaga County, Cicero has produced a few surprises in recent years. We’ll take a closer look at the data and see what trends may be emerging there. As always, subscribe to Dustinczarny.com for future editions, election analysis, and the latest election news from Onondaga County and beyond.